Free with trial Economic crisis and recession. Board 2026 with a downward arrow and money with piggy bank. Bankruptcy and financial crisis. Analysis and analytics. Capital outflow, GDP and Forecasting. Board decrease illustrations Economic crisis and recession. Board 2026 with a downward arrow and money with piggy bank. Bankruptcy and financial crisis
Free with trial Hand holding a Wooden doll above a red target Pain relief or management concept. 3D rendering on black background. Board decrease illustrations Hand holding a Wooden doll above a red target Pain relief or management concept.
Free with trial Hand drawing a downward trend graph with a yellow marker on a dark blackboard representing financial decline and economic downturn concepts. Bar chart visualization. Board decrease illustrations Hand Drawing Downward Trend Graph With Yellow Marker On Dark Blackboard Representing Financial Decline. Hand drawing a downward trend graph with a yellow marker on a dark blackboard representing financial decline and economic downturn concepts. Bar chart visualization
Free with trial Economic crisis and recession. Board 2026 with a downward arrow and money with piggy bank. Bankruptcy and financial crisis. Analysis and analytics. Capital outflow, GDP and Forecasting. Board decrease illustrations Economic crisis and recession. Board 2026 with a downward arrow and money with piggy bank. Bankruptcy and financial crisis
Free with trial Economic crisis and recession. Board 2026 with a downward arrow and money with piggy bank. Bankruptcy and financial crisis. Analysis and analytics. Capital outflow, GDP and Forecasting. Board decrease illustrations Economic crisis and recession. Board 2026 with a downward arrow and money with piggy bank. Bankruptcy and financial crisis
Free with trial Set line Arrow Pie chart infographic Graph chart diagram Wrench and gear Pyramid infographics Financial growth decrease Flag and Factory icon. Vector. Board decrease vectors Set line Arrow, Pie chart infographic, Graph, chart, diagram, Wrench and gear, Pyramid infographics, Financial growth. Set line Arrow Pie chart infographic Graph chart diagram Wrench and gear Pyramid infographics Financial growth decrease Flag and Factory icon. Vector.
Free with trial Chart with rising and falling trends on a grid board alongside a smaller cloud-connected line graph. Ideal for analytics, data analysis, statistics, forecasting, technology, research. Board decrease illustrations Data Analytics Visualization with Graphs and Cloud Integration Concept. Chart with rising and falling trends on a grid board alongside a smaller cloud-connected line graph. Ideal for analytics, data analysis, statistics, forecasting, technology, research
Free with trial Narrow road ahead sign : A narrow road ahead sign warns that the roadway width will decrease further along the route. Board decrease vectors Narrow road ahead sign
Free with trial A bar graph with a red downward arrow illustrates a decline in data over time. Board decrease illustrations Decline in bar graph indicates downward trend. A bar graph with a red downward arrow illustrates a decline in data over time
Free with trial Climate change, sustainability, eco-friendly practices, carbon footprint, energy efficiency, environmental awareness. Man pointing at charts and graphs. Environmental awareness and sustainability. Board decrease vectors Environmental Data Analysis with Focus on Carbon Footprint, Emission Reduction, and Home Energy Efficiency. Climate change, sustainability, eco-friendly practices, carbon footprint, energy efficiency, environmental awareness. Man pointing at charts and graphs. Environmental awareness and sustainability
Free with trial Conceptual image showing a magnifying glass focusing on a business presentation with a declining graph. Board decrease illustrations Decline Analysis Magnifying Glass on Business Loss Graph. Conceptual image showing a magnifying glass focusing on a business presentation with a declining graph.
Free with trial A dynamic image of a digital stock market ticker screen displaying financial data. The background is filled with red, downward-pointing arrows and negative numbers, symbolizing a bearish market, recession, or economic downturn. In stark contrast, a single, large, bright green arrow points upwards, representing growth, success, profit, and recovery. This powerful visual metaphor illustrates a single stock's success or a broader economic turnaround amidst widespread losses. It's perfect for concepts related to investment strategy, financial analysis, market volatility, and economic hope. Board decrease illustrations Stock Market Recovery and Growth Concept. A dynamic image of a digital stock market ticker screen displaying financial data. The background is filled with red, downward-pointing arrows and negative numbers, symbolizing a bearish market, recession, or economic downturn. In stark contrast, a single, large, bright green arrow points upwards, representing growth, success, profit, and recovery. This powerful visual metaphor illustrates a single stock's success or a broader economic turnaround amidst widespread losses. It's perfect for concepts related to investment strategy, financial analysis, market volatility, and economic hope.
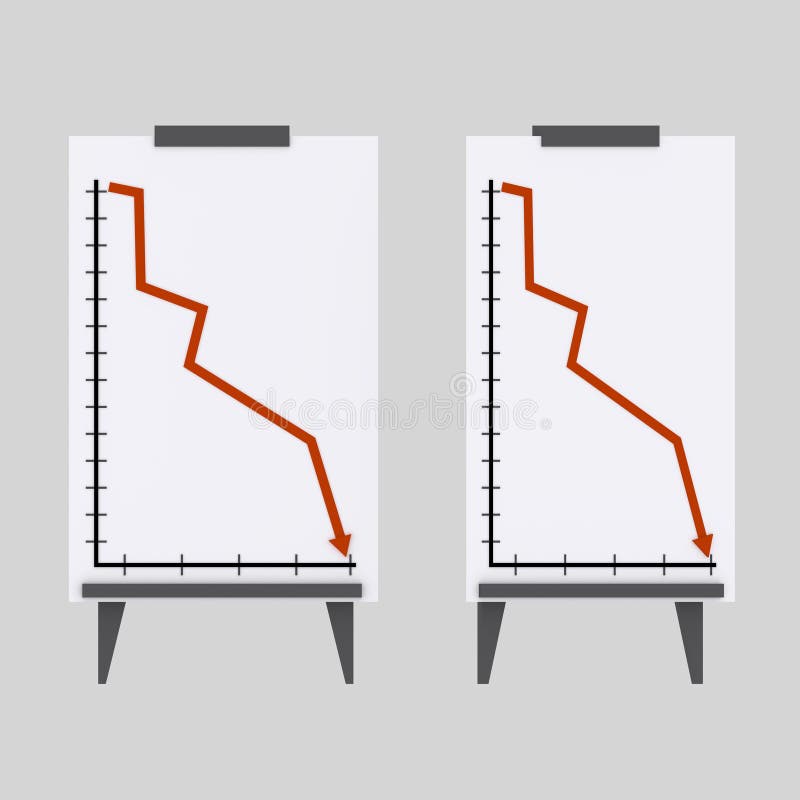
Free with trial A falling graph displayed on an easel, isolated on a white background. The image represents a negative trend, indicating decline in business or finance. Board decrease vectors Illustration of falling graph on easel isolated on transparent background, showing negative trend. A falling graph displayed on an easel, isolated on a white background. The image represents a negative trend, indicating decline in business or finance
Free with trial Financial chart displays data points and lines indicating trends against a blue background and is useful for presentations. Board decrease illustrations Financial Data on Chart. Financial chart displays data points and lines indicating trends against a blue background and is useful for presentations
Free with trial Innovative Eco-Friendly Electronics Merging Nature with Technology for a Sustainable Future Vision, Generated by AI. Board decrease illustrations Innovative Eco-Friendly Electronics Merging Nature with Technology for a Sustainable Future Vision
Free with trial A red arrow dramatically points downward on a flip chart displaying a sharply declining sales graph in a modern office setting. The image symbolizes business downturn, financial loss, and market recession. Ideal for illustrating negative trends, economic crisis, and failed business strategies, generated by AI. Board decrease illustrations Decreasing sales chart on flip chart in office. A red arrow dramatically points downward on a flip chart displaying a sharply declining sales graph in a modern office setting. The image symbolizes business downturn, financial loss, and market recession. Ideal for illustrating negative trends, economic crisis, and failed business strategies, generated by AI.
Free with trial A minimalist, black and white icon depicting a bar chart displayed on a presentation easel. The chart shows bars of varying heights, suggesting growth, data analysis, or performance metrics. The easel has a simple, three-legged stand. This graphic is ideal for representing business concepts, financial reports, educational materials, or any context involving data visualization and presentations. Board decrease vectors Black Bar Chart on Presentation Easel Icon. A minimalist, black and white icon depicting a bar chart displayed on a presentation easel. The chart shows bars of. A minimalist, black and white icon depicting a bar chart displayed on a presentation easel. The chart shows bars of varying heights, suggesting growth, data analysis, or performance metrics. The easel has a simple, three-legged stand. This graphic is ideal for representing business concepts, financial reports, educational materials, or any context involving data visualization and presentations.
Free with trial NYSE stock index going down, 3d rendering. Board decrease illustrations NYSE stock index going down
Free with trial A whiteboard on an easel displaying a red bar graph with a downward trend, indicated by a large red arrow. Board decrease illustrations A red graph on a whiteboard showing a downward trend. a whiteboard on an easel displaying a red bar graph with a downward trend, indicated by a large red arrow
Free with trial A 3D rendered bar chart is displayed on a purple easel against a white background. The chart features a white board with a purple horizontal axis and three vertical purple bars of varying heights, indicating data or growth. The easel has three purple legs supporting the board. The overall aesthetic is clean and minimalist, suitable for business or educational contexts. Board decrease illustrations A Purple 3D Rendered Bar Chart on an Easel Against a White Background graph statistics. A 3D rendered bar chart is displayed on a purple easel against a white background. The chart features a white board with a purple horizontal axis and three vertical purple bars of varying heights, indicating data or growth. The easel has three purple legs supporting the board. The overall aesthetic is clean and minimalist, suitable for business or educational contexts
Free with trial Easel holds a financial chart showing upward green and downward red arrows. Board decrease vectors Easel Displaying Financial Chart With Green And Red Arrows. Easel holds a financial chart showing upward green and downward red arrows
Free with trial A large red arrow symbolizes a financial downturn and falling stock market values against a dark background, indicating losses, perfect for illustrating financial crisis concepts. Board decrease illustrations Stock Market Downturn Red Arrow Indicates Declining Finance and Investment. A large red arrow symbolizes a financial downturn and falling stock market values against a dark background, indicating losses, perfect for illustrating financial crisis concepts
Free with trial SP 500 stock with red arrow point down 3d rendering. Board decrease illustrations SP 500 stock with red arrow point down
Free with trial The image depicts a flip chart with a bar chart showing a downward trend in performance or data values. Overlaid on the bar chart is a red line graph that also trends downward, emphasizing a continuous decline. The chart is likely used to visually communicate negative trends or reductions in metrics over time, such as sales, productivity, or other measurable quantities. Board decrease illustrations Declining performance illustrated by a bar and line chart on a flip chart. The image depicts a flip chart with a bar chart showing a downward trend in performance or data values. Overlaid on the bar chart is a red line graph that also trends downward, emphasizing a continuous decline. The chart is likely used to visually communicate negative trends or reductions in metrics over time, such as sales, productivity, or other measurable quantities
Free with trial Success in business competition concept. Red figurine and wooden ones. Leadership with business success concept. 3D rendering on white background. Board decrease illustrations Success in business competition concept. Red figurine and wooden ones.
Free with trial Success in business competition concept. Red figurine and wooden ones. Leadership with business success concept. 3D rendering on black background. Board decrease illustrations Success in business competition concept. Red figurine and wooden ones.
Free with trial The image shows a wooden easel holding a whiteboard with a declining trend chart. The chart features a combination of red vertical bars and a downward-sloping red line, indicating a decrease in values over time. The easel stands on a light gray surface, and the chart appears to be used for visual presentations or data analysis. Board decrease illustrations Declining trend chart displayed on an easel with red bar and line graph elements. The image shows a wooden easel holding a whiteboard with a declining trend chart. The chart features a combination of red vertical bars and a downward-sloping red line, indicating a decrease in values over time. The easel stands on a light gray surface, and the chart appears to be used for visual presentations or data analysis
Free with trial Rustic wooden arrow sign with grain texture pointing down in a cartoon style illustration. Board decrease vectors Rustic wooden arrow sign with grain texture pointing down in a cartoon style illustration
Free with trial The image depicts a wooden easel holding a white board with a downward-trending red line, a pie chart showing a small green segment, and a red warning triangle. Below the easel, three stacks of gold coins symbolize financial loss or economic downturn. The visual elements collectively suggest financial warnings, market decline, or poor investment returns. Board decrease illustrations Financial decline illustrated with warning and pie chart graphics on easel with gold coins. The image depicts a wooden easel holding a white board with a downward-trending red line, a pie chart showing a small green segment, and a red warning triangle. Below the easel, three stacks of gold coins symbolize financial loss or economic downturn. The visual elements collectively suggest financial warnings, market decline, or poor investment returns
Free with trial Stylized business chart icon depicting financial growth, percentage, and decline. Flat design, blue outline with light blue fill, minimalistic style. Board decrease vectors Business chart icon showing growth, percentage, and decline in a simple outlined style. Stylized business chart icon depicting financial growth, percentage, and decline. Flat design, blue outline with light blue fill, minimalistic style.
Free with trial Declining business graph with downward trend line and colorful bars for financial loss concept, illustration. Board decrease vectors Declining business graph with downward trend line and colorful bars for financial loss concept
Free with trial Close Up of L. E. D. Stock Ticker Showing Market Data Prices and Numbers at Night With Blurred Crowd, Generated by AI. Board decrease illustrations Close Up of L.E.D. Stock Ticker Showing Market Data Prices and Numbers at Night With Blurred Crowd
Free with trial Success in business competition concept. Red figurine and wooden ones. Leadership with business success concept. Made and rendered in C4D, not AI. Board decrease illustrations Success in business competition concept. Red figurine and wooden ones
Free with trial Success in business competition concept. Red figurine and wooden ones. Leadership with business success concept. Made and rendered in C4D, not AI. Board decrease illustrations Success in business competition concept. Red figurine and wooden ones
Free with trial Digital display shows gas prices changing from 3. 59 to 3. 60 and then to 3. 71 at a gas station with blurred pumps in the background. Board decrease illustrations Digital fuel price display showing decreasing gas prices from 3.59 to 3.60 and finally to 3.71 at a gas station with blurred. Digital display shows gas prices changing from 3.59 to 3.60 and then to 3.71 at a gas station with blurred pumps in the background
Free with trial Isometric illustration of a chart board displaying upward and downward trend lines. Board decrease vectors Isometric graph chart with trends on display. Isometric illustration of a chart board displaying upward and downward trend lines
Free with trial Minimalist illustration of a presentation showing a negative trend, with a chart and a red arrow going down. Board decrease illustrations Presentation showing negative trend with arrow and chart going down. Minimalist illustration of a presentation showing a negative trend, with a chart and a red arrow going down
Free with trial Hand holding a pawn above a red target Pain relief or management concept. Composite image between a hand photography and a 3D background. Board decrease illustrations Pawn above a red target Pain relief or management concept. Composite image between a hand photograph
Free with trial Hand holding a pawn above a red target Pain relief or management concept. Composite image between a hand photography and a 3D background. Board decrease illustrations Pawn above a red target Pain relief or management concept. Composite image between a hand photography
Free with trial Cartoon jungle sign boards set. Blank empty wood planks wooden pointers arrows banners with tropical leaves vector illustration AI gen. Board decrease vectors Cartoon jungle sign boards set. Blank empty wood planks wooden pointers arrows banners with tropical leaves vector
Free with trial Stock crisis red price drop arrow down chart fall. Stock market exchange analysis or forex graph business and finance money losing moving economic inflation deflation investment loss crash. Illustration. Board decrease illustrations Stock crisis red price drop arrow down chart fall
Free with trial Stock crisis red price drop arrow down chart fall. Stock market exchange analysis or forex graph business and finance money losing moving economic inflation deflation investment loss crash. Illustration. Board decrease illustrations Stock crisis red price drop arrow down chart fall
Free with trial Stock crisis red price drop arrow down chart fall. Stock market exchange analysis or forex graph business and finance money losing moving economic inflation deflation investment loss crash. Illustration. Board decrease illustrations Stock crisis red price drop arrow down chart fall
Free with trial Stock crisis red price drop arrow down chart fall. Stock market exchange analysis or forex graph business and finance money losing moving economic inflation deflation investment loss crash. Illustration. Board decrease illustrations Stock crisis red price drop arrow down chart fall
Free with trial Line art icon of a flip chart showing a graph with decreasing statistics, concept for business failure. Board decrease vectors Flip chart showing decreasing statistics on whiteboard. Line art icon of a flip chart showing a graph with decreasing statistics, concept for business failure
Free with trial White downtrend arrow on black asphalt,. Board decrease illustrations Downtrend economic arrow on blacktop, AI generated. White downtrend arrow on black asphalt,
Free with trial Black and white icon of a flip chart presenting a negative trend. Board decrease vectors Flip chart presenting negative trend on a white background. Black and white icon of a flip chart presenting a negative trend
Free with trial Image is generated with the use of an AI. Board decrease illustrations Chess generative ai. image is generated with the use of an AI
Free with trial Image is generated with the use of an AI. Board decrease illustrations Chess generative ai. image is generated with the use of an AI
Free with trial Description: A 3D rendering of a businessman figure presenting a bar chart showing upward growth trend on a whiteboard. The chart illustrates business success and progress. Board decrease illustrations Businessman Presenting Positive Growth Chart on Whiteboard. Description: A 3D rendering of a businessman figure presenting a bar chart showing upward growth trend on a whiteboard. The chart illustrates business success and progress.
Free with trial Purple downward arrow against background of broken old computers. Decreasing market trend for outdated technology. Graph showing recession and fall. Board decrease illustrations Purple downward arrow against background of broken old computers
Free with trial Business chart is displaying market data analytics with a candlestick chart, pie chart and line graph. Board decrease vectors Business chart displaying market data analytics with candlestick chart, pie chart and line graph
Free with trial This image captures a conceptual business planning session, suggesting a focus on market trend analysis, charting of progress and addressing potential declines. Board decrease illustrations Conceptual business strategy session with downward trend and coffee break. This image captures a conceptual business planning session, suggesting a focus on market trend analysis, charting of progress and addressing potential declines
Free with trial Hand holding a Wooden doll above a red target Pain relief or management concept. 3D rendering on white background. Board decrease illustrations Hand holding a Wooden doll above a red target Pain relief or management concept.
Free with trial Red candlestick graph showing falling stock market prices during trading session with warm lights in the foreground. Board decrease illustrations Stock market crash showing falling prices during trading session. Red candlestick graph showing falling stock market prices during trading session with warm lights in the foreground
Free with trial Close-up of tax percentages written on a whiteboard with markers nearby. Board decrease illustrations Tax percentages written on a whiteboard with markers nearby
Free with trial Close-up of tax percentages written on a whiteboard with markers nearby. Board decrease illustrations Tax percentages written on a whiteboard with markers nearby
Free with trial Close-up of tax percentages written on a whiteboard with markers nearby. Board decrease illustrations Tax percentages written on a whiteboard with markers nearby
Free with trial Close-up of tax percentages written on a whiteboard with markers nearby. Board decrease illustrations Tax percentages written on a whiteboard with markers nearby
Free with trial Success in business competition concept. Red figurine and wooden ones. Leadership with business success concept. 3D rendering on black background. Board decrease illustrations Success in business competition concept. Red figurine and wooden ones.
Free with trial Success in business competition concept. Red figurine and wooden ones. Leadership with business success concept. 3D rendering on white background. Board decrease illustrations Success in business competition concept. Red figurine and wooden ones.
Free with trial Songkran water festival thailand, happy new year thailand, summer holiday fun, poster flyer three designs collections background, Eps 10 vector illustration. Board decrease vectors Songkran water festival thailand, happy new year thailand, summer holiday fun, poster flyer three designs collections background
Free with trial Set Digital speed meter Location Delivery tracking Graph chart diagram Hierarchy organogram Infographic element and Financial growth decrease icon. Vector. Board decrease illustrations Set Digital speed meter, Location, Delivery tracking, Graph, chart, diagram, Hierarchy organogram, Infographic element. Set Digital speed meter Location Delivery tracking Graph chart diagram Hierarchy organogram Infographic element and Financial growth decrease icon. Vector.
Free with trial Saving the planet, World Environment Day. Planet Earth in smoke, plastic, garbage. Global warming set. Greenhouse effect of CO2. Eco activist. Ecological catastrophy. Earth with reasons of destroying. Board decrease vectors Global warming set. Greenhouse effect of CO2. Eco activist. Ecological catastrophy
Free with trial Saving the planet, World Environment Day. Planet Earth in smoke, plastic, garbage. Global warming set. Greenhouse effect of CO2. Eco activist. Ecological catastrophy. Earth with reasons of destroying. Board decrease vectors Metaphor climate change and water crisis. Save the planet. Earth day. Global warming. Saving the planet, World Environment Day. Planet Earth in smoke, plastic, garbage. Global warming set. Greenhouse effect of CO2. Eco activist. Ecological catastrophy. Earth with reasons of destroying
Free with trial A set of line art icons illustrating financial growth, investment strategies, and market analysis, perfect for business presentations and reports with clean design. Board decrease vectors Vector art of line art icons depicting financial growth, investment strategies, and market analysis, ideal for illustrating. A set of line art icons illustrating financial growth, investment strategies, and market analysis, perfect for business presentations and reports with clean design
Free with trial Set line Pie chart infographic, Graph, chart, diagram, Location, Hierarchy organogram, Arrow and icon. Vector. Board decrease vectors Set line Pie chart infographic, Graph, chart, diagram, Location, Hierarchy organogram, Arrow and icon. Vector
Free with trial Hand holding a pawn above a red target Pain relief or management concept. Composite image between a hand photography and a 3D background. Board decrease illustrations Hand holding a pawn above a red target Pain relief or management concept. Composite image between a hand photography
Free with trial Hand holding a pawn above a red target Pain relief or management concept. Composite image between a hand photography and a 3D background. Board decrease illustrations Hand holding a pawn above a red target Pain relief or management concept. Composite image between a hand photography
Free with trial Checkerboard optical illusion featuring a pattern of alternating yellow and white squares arranged in a radial, circular fashion. The design creates a dizzying effect as the squares progressively decrease in size towards the center, drawing the eye inward. The repetition and alignment of the squares produce an illusion of depth and motion, playing tricks on the viewer's perception. Board decrease vectors Checkerboard Optical Illusion Yellow White background images. Checkerboard optical illusion featuring a pattern of alternating yellow and white squares arranged in a radial, circular fashion. The design creates a dizzying effect as the squares progressively decrease in size towards the center, drawing the eye inward. The repetition and alignment of the squares produce an illusion of depth and motion, playing tricks on the viewer's perception.
Free with trial Gamer down graphic board for decrease report vector illustration. Board decrease vectors Gamer down graphic board for decrease report
Free with trial With gift down graphic board for decrease report vector illustration. Board decrease vectors With gift down graphic board for decrease report
Free with trial With juice down graphic board for decrease report vector illustration. Board decrease vectors With juice down graphic board for decrease report
Free with trial White board decrease graph Easy combine! 4000 x 4000 / 300 dpi / Isolate. Custom 3d illustration!. Board decrease illustrations White board decrease graph
Free with trial Miner down graphic board for decrease report vector illustration. Board decrease vectors Miner down graphic board for decrease report
Free with trial Listening music down graphic board for decrease report vector illustration. Board decrease vectors Listening music down graphic board for decrease report
Free with trial With menu down graphic board for decrease report vector illustration. Board decrease vectors With menu down graphic board for decrease report
Free with trial Angry down graphic board for decrease report vector illustration. Board decrease vectors Angry down graphic board for decrease report
Free with trial Chef with food down graphic board for decrease report vector illustration. Board decrease vectors Chef with food down graphic board for decrease report
Free with trial In love down graphic board for decrease report vector illustration. Board decrease vectors In love down graphic board for decrease report