Free with trial A downward trend is shown on a graph. The graph is black and white. Decrease arrow chart illustrations A downward trend is shown on a graph
Free with trial This whiteboard displays hand-drawn charts illustrating a sharp market decline. The red lines, representing a dramatic downturn, are prominently featured, alongside other less defined financial graphs. This image was generated by AI for illustrative purposes. Decrease arrow chart illustrations Red Ink Market Crash Whiteboard. This whiteboard displays hand-drawn charts illustrating a sharp market decline. The red lines, representing a dramatic downturn, are prominently featured, alongside other less defined financial graphs. This image was generated by AI for illustrative purposes.
Free with trial Businessman on percentage sign with falling down. Depicts Inflation, decline, falling profits in an economic recession and falling stock market values. Success talent concept. Decrease arrow chart vectors Profit Fall in Economic Recession. Businessman on Percentage Sign with Falling Down. Businessman on percentage sign with falling down. Depicts Inflation, decline, falling profits in an economic recession and falling stock market values. Success talent concept
Free with trial Set line Shutdown of factory, Bank building, Global economic crisis news and Stop delivery cargo truck icon. Vector. Decrease arrow chart illustrations Set line Shutdown of factory, Bank building, Global economic crisis news and Stop delivery cargo truck icon. Vector
Free with trial Set of six black business charts icons showing growth and decline trends with arrows and bars in vector style clear and simple design calm. Generative AI. Decrease arrow chart vectors Business growth and decline charts arrows statistics bar graph icons vector illustration. Set of six black business charts icons showing growth and decline trends with arrows and bars in vector style clear and simple design calm. Generative AI
Free with trial A visual representation of declining trends, depicted by a graph with red and blue lines moving downwards, symbolizing a negative trajectory or market shift. Decrease arrow chart illustrations Downward trending graph with word trends. A visual representation of declining trends, depicted by a graph with red and blue lines moving downwards, symbolizing a negative trajectory or market shift
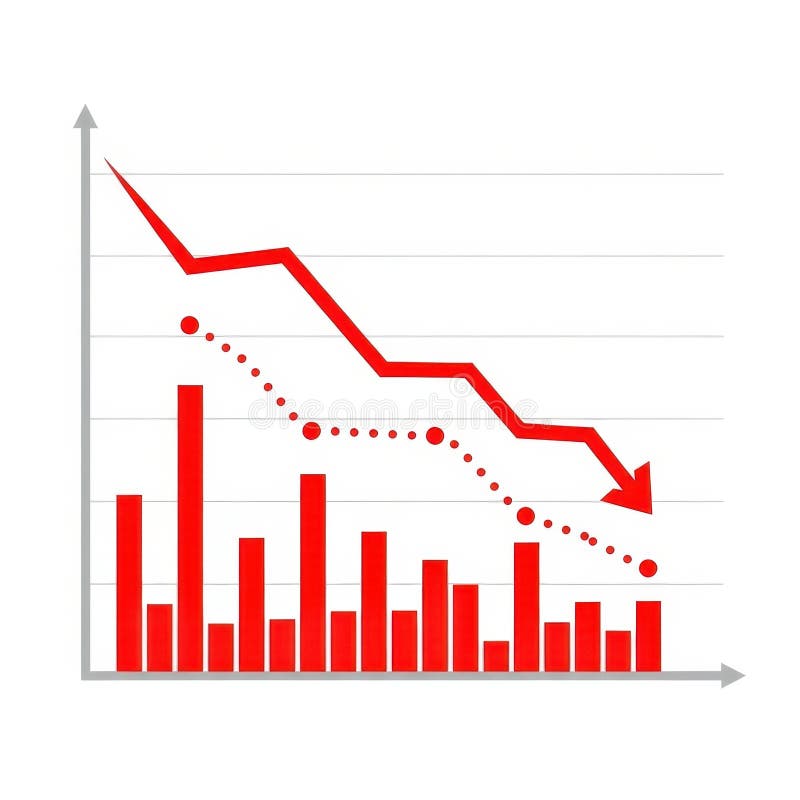
Free with trial A visual representation of negative financial performance. It features red bars and a red line graph showing a downward trend, accompanied by a dotted line indicating a similar pattern. Decrease arrow chart illustrations Red downward trending graph with bars and dotted line. A visual representation of negative financial performance. It features red bars and a red line graph showing a downward trend, accompanied by a dotted line indicating a similar pattern
Free with trial This illustration shows a downward trend for the US dollar and an upward trend for the Japanese Yen, generated by AI. The graphic uses stylized gold coins with currency symbols and directional arrows to clearly visualize the contrasting market movements. Decrease arrow chart illustrations USD vs. Yen: Currency Fluctuation. This illustration shows a downward trend for the US dollar and an upward trend for the Japanese Yen, generated by AI. The graphic uses stylized gold coins with currency symbols and directional arrows to clearly visualize the contrasting market movements.
Free with trial Financial arrows up and down. Financial growth and decline. Graph with green and red arrows. Finance diagram, graphic charts icon set. Decrease arrow chart vectors Financial arrows up and down. Financial growth and decline. Graph with green and red arrows. Finance diagram, graphic charts icon
Free with trial Downward Business Graph with Arrows Financial Loss and Market Decline Concept. Decrease arrow chart vectors Downward Business Graph with Arrows Financial Loss and Market Decline Concept
Free with trial 3D rendered graphic showing the word Finance in bold black letters with a green upward trending arrow above and a red downward trending arrow below, flanked by blue opposing arrows on a grid background. Decrease arrow chart illustrations Finance growth upward trend with opposing arrows image. 3D rendered graphic showing the word Finance in bold black letters with a green upward trending arrow above and a red downward trending arrow below, flanked by blue opposing arrows on a grid background
Free with trial A silver laptop sits on a light brown wooden surface. Its screen displays a dark background with a grid pattern and a prominent red line graph sharply declining from left to right. The red line is brightly lit, creating a strong visual contrast against the dark background. The overall mood is one of concern or warning, suggesting a negative trend or decline. The image is clean and simple, focusing, generated by AI. Decrease arrow chart illustrations Laptop Screen Showing Red Downward Trend Graph computer. A silver laptop sits on a light brown wooden surface. Its screen displays a dark background with a grid pattern and a prominent red line graph sharply declining from left to right. The red line is brightly lit, creating a strong visual contrast against the dark background. The overall mood is one of concern or warning, suggesting a negative trend or decline. The image is clean and simple, focusing, generated by AI.
Free with trial Data Stats Board Display Line Icon Downward Down Trend Statistic Performance Market Decline Economy Downturn Bar Graph Progress Outline Presentation. Decrease arrow chart vectors Data Stats Board Display Line Icon Downward Down Trend Statistic Performance Market Decline Economy Downturn Bar Graph
Free with trial A visual creation that highlights a balanced composition with interesting details and style, presenting a harmonious and aesthetic blend of elements, suitable for various creative purposes. Decrease arrow chart vectors Colorful vector icons depicting growth, flow, and transition. A visual creation that highlights a balanced composition with interesting details and style, presenting a harmonious and aesthetic blend of elements, suitable for various creative purposes.
Free with trial This vector illustration shows a set of black graph icons with rising and falling charts indicated by arrows showing trends in data with clear simple design and sharp edges calm. Generative AI. Decrease arrow chart vectors Black graph icons set rising and falling charts with arrows vector illustration simple design. This vector illustration shows a set of black graph icons with rising and falling charts indicated by arrows showing trends in data with clear simple design and sharp edges calm. Generative AI
Free with trial An image showcasing four different graphical representations of financial trends using arrows and lines on grid backgrounds. Decrease arrow chart illustrations Graphical representation of financial trends isolated on transparent background. An image showcasing four different graphical representations of financial trends using arrows and lines on grid backgrounds
Free with trial A bustling market scene with stalls displaying upward and downward financial trends represented by glowing green and red arrows, symbolizing economic activity. Decrease arrow chart illustrations Market stalls with financial growth and decline indicators. A bustling market scene with stalls displaying upward and downward financial trends represented by glowing green and red arrows, symbolizing economic activity
Free with trial Green bar graph illustrating continuous growth or progress. Decrease arrow chart illustrations Green bar graph illustrating continuous growth or progress.
Free with trial Modern collection of business and finance elements. Contains data, charts,diagrams. Use it for presentation, report and infographic projects. Decrease arrow chart vectors Set of Business and Finance Infographic Elements on Transparent Background Vectors. Modern collection of business and finance elements. Contains data, charts,diagrams. Use it for presentation, report and infographic projects
Free with trial Dollar Currency Up Down Icons. Redus and high costs line with dollar icons.. eps. Decrease arrow chart vectors Circular dollar icons showing rising and falling currency values. Dollar Currency Up Down Icons. Redus and high costs line with dollar icons..eps
Free with trial Illustration showing financial data analysis with charts, idea lightbulb, and location pins, perfect for finance and business concepts. Decrease arrow chart illustrations Analyzing Financial Data and Performance Charts Illustration. Illustration showing financial data analysis with charts, idea lightbulb, and location pins, perfect for finance and business concepts
Free with trial Businessman showing graph falling down, geometric pattern. Decrease arrow chart illustrations Falling down of economic activity, geometric pattern. Businessman showing graph falling down, geometric pattern
Free with trial Two bar graphs, one green showing upward growth and one red showing downward decline, against a white background. Decrease arrow chart illustrations Rising and falling bar graphs illustrating financial trends. Two bar graphs, one green showing upward growth and one red showing downward decline, against a white background
Free with trial A collection of colorful flat icons representing marketing and business concepts like growth, analytics, and strategy. Decrease arrow chart illustrations Marketing and Business Growth Icons Set for Digital Strategy and Analytics image photo. A collection of colorful flat icons representing marketing and business concepts like growth, analytics, and strategy
Free with trial Illustration shows a stressed businessman with falling arrows and a sad face beside coins and a happy businessman with rising arrows and graphs. Positive financial mood. Generative AI. Decrease arrow chart vectors Businessman stressed and happy financial growth comparison vector illustration with coins and charts. Illustration shows a stressed businessman with falling arrows and a sad face beside coins and a happy businessman with rising arrows and graphs. Positive financial mood. Generative AI
Free with trial Isometric Tax Deduction Concept with Financial Elements. Tax Deduction and Financial Management Concept. Decrease arrow chart vectors Isometric Tax Deduction Concept with Financial Elements
Free with trial Business failure and economic crisis concept. Stressed businessman despair due to money loss and bankruptcy sitting at desk with broken piggy bank, debt paper and financial falling crash graph. Vector. Decrease arrow chart vectors Business failure and economic crisis concept. Stressed businessman despair due to money loss and bankruptcy sitting at desk with. Broken piggy bank, debt paper. Business failure and economic crisis concept. Stressed businessman despair due to money loss and bankruptcy sitting at desk with broken piggy bank, debt paper and financial falling crash graph. Vector
Free with trial Three green arrows pointing downwards, each displaying a white percentage symbol. Isolated on a transparent background. Decrease arrow chart vectors Three Green Downward Arrows with Percent Symbol isolated on a transparent background. Three green arrows pointing downwards, each displaying a white percentage symbol. Isolated on a transparent background
Free with trial Consultancy company logo suggesting scaling and expansion --chaos 25 --stylize 0 --v 6. 1 Job ID: 645f5170-6b28-4c73-b608-f90141dcd45c. Decrease arrow chart illustrations Business Growth Icon. consultancy company logo suggesting scaling and expansion --chaos 25 --stylize 0 --v 6.1 Job ID: 645f5170-6b28-4c73-b608-f90141dcd45c
Free with trial Three black arrows pointing down connected by horizontal lines on a white background. Decrease arrow chart illustrations Three Black Arrows Pointing Downward Connected by Horizontal Lines direction movement. Three black arrows pointing down connected by horizontal lines on a white background
Free with trial The image depicts a stylized, dark green forest with a bright green, fluctuating line superimposed over it. the line starts high on the left and trends downward to the right, ending with an arrow indicating a continued decline. the forest is composed of many trees with rounded canopies, creating a dense and somewhat mystical atmosphere. the overall impression is one of environmental or economic decline. Decrease arrow chart illustrations Declining trend line in a forest landscape. the image depicts a stylized, dark green forest with a bright green, fluctuating line superimposed over it. the line starts high on the left and trends downward to the right, ending with an arrow indicating a continued decline. the forest is composed of many trees with rounded canopies, creating a dense and somewhat mystical atmosphere. the overall impression is one of environmental or economic decline.
Free with trial A medium shot shows a person's hands cupped together, palms up. Hovering above the hands are two glowing neon outlines of arrows, one pointing down and the other pointing up. Both arrows contain a percentage symbol. A blurred background features faint digital data and bar graphs, suggesting a financial or economic context. The overall mood is abstract and conceptual. Decrease arrow chart illustrations Hands holding glowing up and down percentage arrows. A medium shot shows a person's hands cupped together, palms up. Hovering above the hands are two glowing neon outlines of arrows, one pointing down and the other pointing up. Both arrows contain a percentage symbol. A blurred background features faint digital data and bar graphs, suggesting a financial or economic context. The overall mood is abstract and conceptual
Free with trial Showing helix graph tracking market data in dotted grid display, with bars and arrowed markers. Financial, technology, innovation, data, analytics, digital, futuristic. Decrease arrow chart illustrations Showing helix graph tracking market data in dotted grid display, with bars and arrowed markers
Free with trial Financial crisis concept. Decreasing graph with falling columns. Vector illustration showing recession, bankruptcy, and economic decline. Decrease arrow chart vectors Financial crisis concept. Decreasing graph with falling columns. Vector illustration showing recession, bankruptcy
Free with trial Abstract graph with stars showing growth or decline illustration. Decrease arrow chart vectors Abstract graph with stars showing growth or decline illustration
Free with trial A businessman in a suit holds a digital display showing arrows and percentages, representing the concept of reducing costs while improving quality. The image portrays business strategy and efficiency. Decrease arrow chart illustrations Businessman presents cost reduction and quality improvement concept. A businessman in a suit holds a digital display showing arrows and percentages, representing the concept of reducing costs while improving quality. The image portrays business strategy and efficiency
Free with trial A conceptual image featuring wooden blocks spelling the word "TRUST" alongside a stacked block showing a downward trend graph and a sad face emoji. This composition symbolizes the loss of consumer confidence, economic recession, reputation damage, and the negative impact of poor service or financial decline in a professional business environment. Decrease arrow chart illustrations Declining Trust and Business Failure Concept with Wooden Blocks and Sad Face Icon. A conceptual image featuring wooden blocks spelling the word "TRUST" alongside a stacked block showing a downward trend graph and a sad face emoji. This composition symbolizes the loss of consumer confidence, economic recession, reputation damage, and the negative impact of poor service or financial decline in a professional business environment.
Free with trial Stock market crash showing market downturn with red graph and percentage sign. Decrease arrow chart illustrations Red graph showing a stock market crash and downturn with percentage sign. Stock market crash showing market downturn with red graph and percentage sign
Free with trial Loss Graph Neon Sign. Vector Illustration of Analytics Data Symbol. Decrease arrow chart vectors Loss Graph Neon Sign
Free with trial Line graph with a green line and a red dot on top. The red dot is located at the top left corner of the graph. Decrease arrow chart illustrations Graph with a green line and a red dot
Free with trial Frozen graph showing a downward trend. Cold economy concept, financial crisis, declining business, and cold market conditions. Decrease arrow chart illustrations Frozen graph showing a downward trend. Cold economy concept, financial crisis, declining business
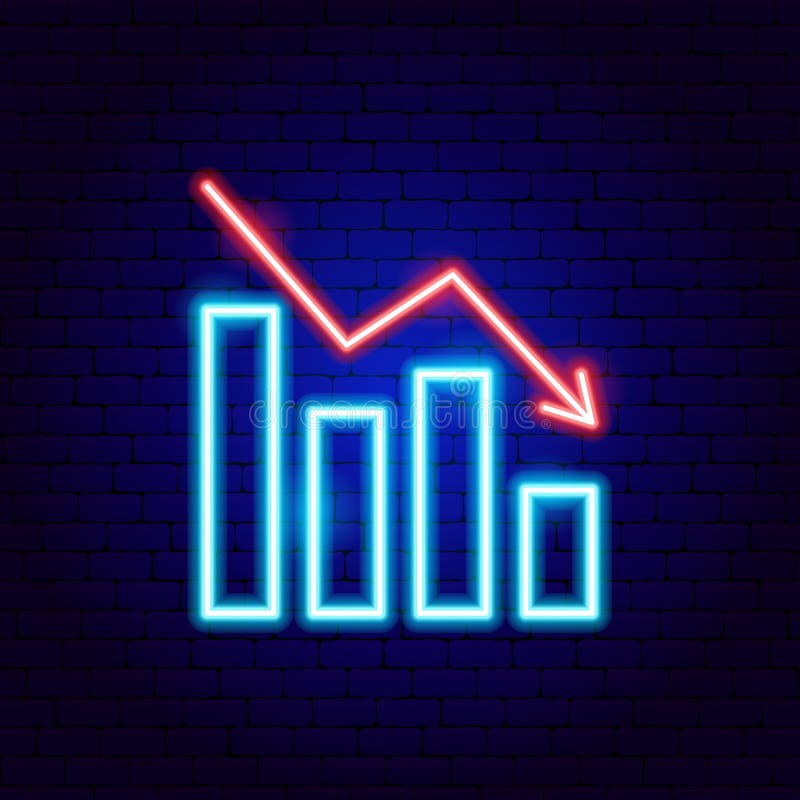
Free with trial The image shows a neon pink graph descending sharply against a dark blue, grid-patterned background. the graph starts high on the left, then plummets downwards with some zigzags before leveling out near the bottom. an arrow at the end of the line points downwards, emphasizing the decline. the overall effect is a visual representation of a significant drop or loss. Decrease arrow chart illustrations Descending neon graph on a dark blue background. the image shows a neon pink graph descending sharply against a dark blue, grid-patterned background. the graph starts high on the left, then plummets downwards with some zigzags before leveling out near the bottom. an arrow at the end of the line points downwards, emphasizing the decline. the overall effect is a visual representation of a significant drop or loss.
Free with trial This image showcases a bar graph depicting rising factory production, generated by AI, superimposed on a blurred background of a bustling industrial facility. The upward trend suggests growth and efficiency in the manufacturing process, highlighting the positive impact of modern technology. Decrease arrow chart illustrations Factory Production Increase. This image showcases a bar graph depicting rising factory production, generated by AI, superimposed on a blurred background of a bustling industrial facility. The upward trend suggests growth and efficiency in the manufacturing process, highlighting the positive impact of modern technology.
Free with trial Black and white icon showing particles falling down a slope with arrows indicating decline. Decrease arrow chart illustrations Black and white icon illustrating deleveraging with falling particles and arrows debt reduction. Black and white icon showing particles falling down a slope with arrows indicating decline
Free with trial A falling graph displayed on an easel, isolated on a white background. The image represents a negative trend, indicating decline in business or finance. Decrease arrow chart vectors Illustration of falling graph on easel isolated on transparent background, showing negative trend. A falling graph displayed on an easel, isolated on a white background. The image represents a negative trend, indicating decline in business or finance
Free with trial Sketchy bar graph illustration of financial decline and economic loss. Decrease arrow chart vectors Sketchy bar graph illustration of financial decline and economic loss
Free with trial Colorful line graph illustrating growth and decline over time, with variously colored data points on a dark background, visualizing financial performance and trends. Decrease arrow chart vectors Colorful line graph illustrating growth and decline over time, with variously colored data points on a dark background
Free with trial Global RAM Shortage Crisis Impacting Computer Hardware Market and Semiconductor Supply Chain with Declining Performance Trend. Decrease arrow chart vectors Global RAM Shortage Crisis Impacting Computer Hardware Market and Semiconductor Supply Chain
Free with trial A graph with a reduction report. A dagram showing the recession and bankruptcy. Business and finance concept. Vector illustration. Decrease arrow chart vectors Graph with a reduction report. A dagram showing the recession and bankruptcy. Business and finance concept. Vector illustration
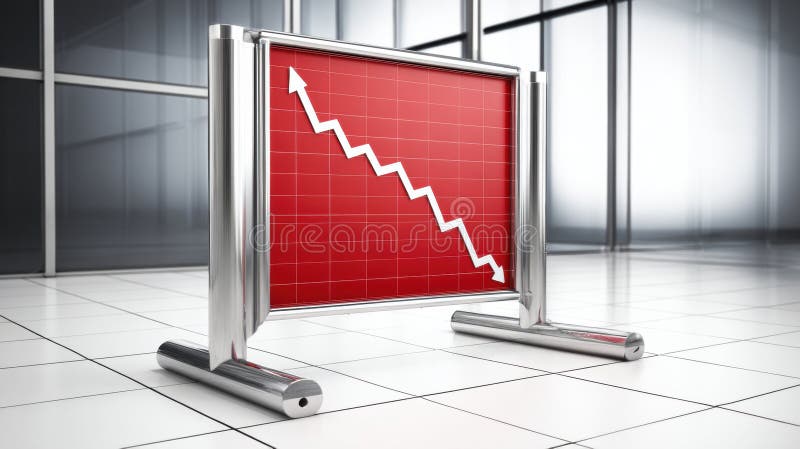
Free with trial This image shows a red graph displaying a downward trend, generated by AI. The graph is presented on a freestanding, metallic sign, suggesting a public display of economic or market data indicating a decline or downturn. The clean, modern setting adds to the professional feel, implying a serious fi. Decrease arrow chart illustrations AI-Generated Declining Graph. This image shows a red graph displaying a downward trend, generated by AI. The graph is presented on a freestanding, metallic sign, suggesting a public display of economic or market data indicating a decline or downturn. The clean, modern setting adds to the professional feel, implying a serious fi
Free with trial A hand holds a piece of paper with a hand-drawn graph showing a sharp decline. The downward trend is clearly visible, indicating a negative development. This image was generated by AI and is ideal for illustrating concepts like economic downturn, market crash, or business failure. Decrease arrow chart illustrations Hand Holding Declining Graph. A hand holds a piece of paper with a hand-drawn graph showing a sharp decline. The downward trend is clearly visible, indicating a negative development. This image was generated by AI and is ideal for illustrating concepts like economic downturn, market crash, or business failure.
Free with trial This image features two prominent arrows pointing upwards one green and one red symbolizing contrasting financial performance or progress in different areas. Decrease arrow chart illustrations Two upward arrows green and red showing growth progress and contrasting trends. This image features two prominent arrows pointing upwards one green and one red symbolizing contrasting financial performance or progress in different areas
Free with trial Business performance decline icon vector. Productivity drop and process efficiency loss symbol. Decrease arrow chart vectors Business performance decline icon. Productivity drop and process efficiency loss symbol
Free with trial Business crisis and financial recession vector concept. Symbol of downturn, fall, bankruptcy. Minimal design eps10 illustration. Decrease arrow chart vectors Business crisis and financial recession vector concept. Symbol of downturn, fall, bankruptcy. Minimal illustration.
Free with trial View of Graphs showing declining CO₂ emissions. Decrease arrow chart illustrations Graphs showing declining CO₂ emissions
Free with trial Three 3D red arrows point downward, each featuring a white percentage sign on the front. The arrows have a glossy, smooth texture and a bold, vibrant red color. They are evenly spaced against a plain white background, symbolizing discounts or reductions. The design conveys a clear message of sales and promotions. Decrease arrow chart vectors Three red downward pointing arrows with percentage signs symbolizing discounts. Three 3D red arrows point downward, each featuring a white percentage sign on the front. The arrows have a glossy, smooth texture and a bold, vibrant red color. They are evenly spaced against a plain white background, symbolizing discounts or reductions. The design conveys a clear message of sales and promotions.
Free with trial Power consumption reduction icon, line vector, eps 10 file, easy to edit. Decrease arrow chart vectors Power consumption reduction icon, line vector
Free with trial This image features two minimalist icons representing financial or data trends. The left icon is a white line graph with circular data points and directional arrows, set against a solid black shield shape. The right icon presents the same line graph and data points within a black outline of a shield, on a white background. Both icons depict fluctuating data, with one showing a downward trend and the other an upward trend, symbolizing market volatility, analysis, and security. Decrease arrow chart illustrations Line Graph Icon with Shield Symbol - Upward and Downward Trends. This image features two minimalist icons representing financial or data trends. The left icon is a white line graph with circular data points and directional arrows, set against a solid black shield shape. The right icon presents the same line graph and data points within a black outline of a shield, on a white background. Both icons depict fluctuating data, with one showing a downward trend and the other an upward trend, symbolizing market volatility, analysis, and security.
Free with trial A collection of black and white icons representing financial concepts such as growth charts, decline arrows, and money symbols, all presented clearly on a plain white background for easy integration i. Decrease arrow chart vectors Financial growth and decline icons isolated on transparent background. A collection of black and white icons representing financial concepts such as growth charts, decline arrows, and money symbols, all presented clearly on a plain white background for easy integration i
Free with trial Red downward arrows symbolize a decline in financial markets or economic downturn. The background features blurred lights, enhancing the dramatic effect. Decrease arrow chart illustrations Red downward arrows symbolize a decline in financial markets or economic downturn.
Free with trial Hydropower concept. Illustration of efficient energy use leading to lower utility expenses with happy individuals. Vector illustration. Decrease arrow chart vectors Hydropower. Flat Vector Illustration. Hydropower concept. Illustration of efficient energy use leading to lower utility expenses with happy individuals. Vector illustration.
Free with trial A bold infographic in flat-style depicting inflation through an upward red arrow, a concerned professional figure, and financial icons symbolizing rising prices and reduced purchasing power �. Decrease arrow chart illustrations . A bold infographic in flat-style depicting inflation through an upward red arrow, a concerned professional figure, and financial icons symbolizing rising prices and reduced purchasing power �
Free with trial Global RAM Shortage Crisis Impacting Computer Hardware Market and Semiconductor Supply Chain with Declining Performance Trend. Decrease arrow chart vectors Global RAM Shortage Crisis Impacting Computer Hardware Market and Semiconductor Supply Chain
Free with trial A vibrant illustration depicting financial challenges, including a broken piggy bank, money stacks, a declining graph, and a safe, symbolizing financial literacy and banking. Decrease arrow chart vectors Financial Challenges and Solutions Illustration. A vibrant illustration depicting financial challenges, including a broken piggy bank, money stacks, a declining graph, and a safe, symbolizing financial literacy and banking.
Free with trial Visual representation of financial trends with euro symbols, depicting both upward and downward movements in bar graph format, suitable for economic analysis. Decrease arrow chart vectors Bar charts showing euro currency growth and decline isolated on transparent background. Visual representation of financial trends with euro symbols, depicting both upward and downward movements in bar graph format, suitable for economic analysis
Free with trial Nuclear power concept. Workers around cooling tower and energy symbols reflect affordable electricity generation. Sustainable power industry. Vector illustration. Decrease arrow chart vectors Nuclear Power. Flat Vector Illustration. Nuclear power concept. Workers around cooling tower and energy symbols reflect affordable electricity generation. Sustainable power industry. Vector illustration.
Free with trial Bitcoin failing graph crypto currency. Coin B symbol finance economy banking system. Blockchain extra crash with lightning negative forecast for decline in value vector illustration. Decrease arrow chart vectors Bitcoin failing graph crypto currency. Coin B symbol finance economy banking system. Blockchain extra crash with
Free with trial A flat, cartoon-style line graph on a white grid background shows a green upward-pointing arrow representing growth and a red downward-pointing arrow indicating decline, with a red dollar sign placed atop the green arrow to symbolize financial gain, illustrating contrasting economic trends in a simplified, visually engaging manner ideal for business, finance, and investment-related content that. Decrease arrow chart illustrations Upward and downward financial trend with green and red arrows on grid graph. A flat, cartoon-style line graph on a white grid background shows a green upward-pointing arrow representing growth and a red downward-pointing arrow indicating decline, with a red dollar sign placed atop the green arrow to symbolize financial gain, illustrating contrasting economic trends in a simplified, visually engaging manner ideal for business, finance, and investment-related content that
Free with trial Three wooden blocks show upward trending growth with arrows. The blocks decrease in size, set against a wood surface, symbolizing progress. Decrease arrow chart illustrations Wooden blocks with upward arrows showing growth on wood surface. Three wooden blocks show upward trending growth with arrows. The blocks decrease in size, set against a wood surface, symbolizing progress
Free with trial A conceptual vector illustration depicting the duality of business performance. On a modern teal background, two reports are shown side-by-side. One features a rising red graph symbolizing growth, profit, and success, while the other displays a descending graph representing decline, loss, and failure. This flat design graphic is ideal for financial analysis, market trend comparisons, business presentations, and infographics illustrating opposite outcomes or strategic choices. The long shadow effect adds a contemporary feel to the design. Decrease arrow chart vectors Growth and Decline Business Charts Comparison. A conceptual vector illustration depicting the duality of business performance. On a modern teal background, two reports are shown side-by-side. One features a rising red graph symbolizing growth, profit, and success, while the other displays a descending graph representing decline, loss, and failure. This flat design graphic is ideal for financial analysis, market trend comparisons, business presentations, and infographics illustrating opposite outcomes or strategic choices. The long shadow effect adds a contemporary feel to the design.
Free with trial 3 Candles vector Stock Market Trading concept colored icon or logo element. Decrease arrow chart vectors 3 Candles vector Stock Market Trading colored icon or logo element
Free with trial Arrows pointing downwards on pink surface show negative trend. Downward direction shows loss. Arrows concept illustrates recession. Decline symbol points to depression crisis situation. Decrease arrow chart illustrations Arrows pointing downwards on pink surface show negative trend. Downward direction shows loss. Arrows concept illustrates
Free with trial Hand holding tablet with red downward trend graph, digital style on dark office background, concept of financial crisis and market collapse. Decrease arrow chart illustrations Businessman holding tablet with falling stock market graph and red arrows representing financial crisis and global economic. Hand holding tablet with red downward trend graph, digital style on dark office background, concept of financial crisis and market collapse
Free with trial Financial business concept going bankrupt flat vector design. design vector illustration. Decrease arrow chart vectors Flat design bankruptcy concept. financial business concept going bankrupt flat vector design.design vector illustration
Free with trial Illustration of economic growth is depicted by a green staircase ascending toward light, symbolizing progress and increased prosperity. Decrease arrow chart vectors Illustration of economic growth is depicted by a green staircase ascending toward light
Free with trial A woman analyzes stock market data using a magnifying glass, with a falling coin and downward trending charts indicating a potential loss. Decrease arrow chart vectors Woman analyzing stock market data with magnifying glass tool. a woman analyzes stock market data using a magnifying glass, with a falling coin and downward trending charts indicating a potential loss.
Free with trial Inflation Icon Flat Vector. Clean and minimal graphic design. Decrease arrow chart vectors Inflation Icon Flat Vector
Free with trial Financial arrows up and down icon on circle. Growth and decline graph sign symbol illustration. Decrease arrow chart vectors Financial arrows up and down icon on circle. Growth and decline graph sign symbol
Free with trial A line graph showing a declining stock market trend over time, with a downward sloping orange line and multiple blue and. Decrease arrow chart illustrations Stock Market Decline Graph. A line graph showing a declining stock market trend over time, with a downward sloping orange line and multiple blue and.
Free with trial Graph showing a line that is green and has a black background. The line is going up and to the right. Decrease arrow chart illustrations Graph showing a line that is green and has a black background