Free with trial A clean vector illustration of a bar chart graph featuring pink striped bars and a yellow highlighted section against a white background. The chart is flat design style, ideal for data visualization, business presentations, or infographics. The bars decrease in height from left to right, with the yellow section emphasizing the bottom area. Decrease graph vector illustration illustrations Striped bar chart graph with yellow highlight and pink bars on white background vector illustration. A clean vector illustration of a bar chart graph featuring pink striped bars and a yellow highlighted section against a white background. The chart is flat design style, ideal for data visualization, business presentations, or infographics. The bars decrease in height from left to right, with the yellow section emphasizing the bottom area
Free with trial Dopamine fasting concept. Graph and brain imagery depict the reduction of dopamine levels, symbolizing cognitive balance and happiness. Flat vector illustration. Decrease graph vector illustration vectors Dopamine fasting concept. Flat vector illustration. Dopamine fasting concept. Graph and brain imagery depict the reduction of dopamine levels, symbolizing cognitive balance and happiness. Flat vector illustration.
Free with trial Financial chart illustration. Declining graphic concept. Red arrow decrease Vector. Business diagram symbol. EPS 10. Decrease graph vector illustration vectors Financial chart illustration. Declining graphic concept. Red arrow decrease Vector. Business diagram symbol.
Free with trial Statistic graph progress, financial profit growth, increase, and decrease line icons set. Infographic charts with arrows, circles, and bars thin black outline symbols vector illustration. Decrease graph vector illustration vectors Statistic graph progress, financial profit growth, increase and decrease line icons set. Statistic graph progress, financial profit growth, increase, and decrease line icons set. Infographic charts with arrows, circles, and bars thin black outline symbols vector illustration.
Free with trial Vector illustration of a graph with a downward arrow, representing decline or negative growth. Decrease graph vector illustration vectors Professional Graph with Arrow Down Outline Icon Vector Illustration. Vector illustration of a graph with a downward arrow, representing decline or negative growth.
Free with trial Decline graph prohibited. No downturn allowed signs. Anti-recession symbols. Vector illustration. EPS 10. Stock image. Decrease graph vector illustration vectors Decline graph prohibited. No downturn allowed signs. Anti-recession symbols. Vector illustration. EPS 10.
Free with trial Money crash on chart graph with arrow down, fail financial business invest. Fall dollar. Vector flat illustration. Decrease graph vector illustration vectors Money crash on chart graph with arrow down, fail financial business invest. Fall dollar. Vector illustration
Free with trial Social media marketing graph showing decrease with thumbs up icons, isometric vector illustration. Decrease graph vector illustration vectors Graph showing decrease in social media marketing with thumbs up icons. Social media marketing graph showing decrease with thumbs up icons, isometric vector illustration
Free with trial Vector illustration of decreasing bar graph with arrow, financial concept. Decrease graph vector illustration vectors Vector illustration of decreasing bar graph with arrow, financial concept
Free with trial Percentage drop graph. Economic downturn symbol. Vector illustration. EPS 10. Stock image. Decrease graph vector illustration vectors Percentage drop graph. Economic downturn symbol. Vector illustration. EPS 10.
Free with trial Up and down graph chart icon. Growth increase and decrease sign. Graph or diagram with arrow going up and down. Vector illustration. Decrease graph vector illustration vectors Up and down graph chart icon. Growth increase and decrease sign. Graph or diagram with arrow going up and down. Vector
Free with trial Statistic graph progress, financial profit growth, increase and decrease line icons set. Infographic charts with arrow, circles and bars thin black and red outline symbols vector illustration. Decrease graph vector illustration vectors Statistic graph progress, financial profit growth, increase and decrease line icons set
Free with trial Set Graph, chart, diagram, Arrow and Financial growth decrease. White square button. Vector. Decrease graph vector illustration illustrations Set Graph, chart, diagram, Arrow and Financial growth decrease. White square button. Vector
Free with trial Declining chart icon. Downward trend symbol. Falling graph illustration. Simple vector design. EPS 10. Decrease graph vector illustration vectors Declining chart icon. Downward trend symbol. Falling graph illustration. Simple vector design.
Free with trial World inflation concept with graph chart on a world map vector illustration. United States tariffs. Decrease graph vector illustration vectors World inflation concept with graph chart on a world map vector illustration. United States tariffs.
Free with trial A timeline with a line graph showing the gradual decrease in debt over time with the avalanche od.. Vector illustration. Decrease graph vector illustration vectors A timeline with a line graph showing the gradual decrease in debt over time with the avalanche od.. Vector illustration.
Free with trial Vector illustration of a graph with a downward arrow, representing decline or negative growth. Decrease graph vector illustration vectors Professional Graph with Arrow Down Outline Icon Vector Illustration. Vector illustration of a graph with a downward arrow, representing decline or negative growth.
Free with trial Vector illustration of a graph with a downward arrow, representing decline or negative growth. Decrease graph vector illustration vectors Professional Graph with Arrow Down Outline Icon Vector Illustration. Vector illustration of a graph with a downward arrow, representing decline or negative growth.
Free with trial Vector illustration of a graph with a downward arrow, representing decline or negative growth. Decrease graph vector illustration vectors Professional Graph with Arrow Down Outline Icon Vector Illustration. Vector illustration of a graph with a downward arrow, representing decline or negative growth.
Free with trial Set Pie chart infographic, Graph, chart, diagram, Arrow, Financial growth decrease, and Target icon. Vector. Decrease graph vector illustration vectors Set Pie chart infographic, Graph, chart, diagram, Arrow, Financial growth decrease, and Target icon. Vector
Free with trial Set line Financial growth decrease, Document with graph chart, Cloud download and upload and Data analysis icon. Vector. Decrease graph vector illustration illustrations Set line Financial growth decrease, Document with graph chart, Cloud download and upload and Data analysis icon. Vector
Free with trial Set line Graph, chart, diagram, Pie infographic, Financial growth decrease and icon. Vector. Decrease graph vector illustration vectors Set line Graph, chart, diagram, Pie infographic, Financial growth decrease and icon. Vector
Free with trial This minimal illustration depicts a business stock exchange downturn. The vector concept uses a red arrow symbol to represent a market crash, financial loss, and a minimalist decrease in value. Decrease graph vector illustration vectors Minimal Vector Concept of a Business Stock Exchange Market Downturn and Financial Crash Symbol Illustration. This minimal illustration depicts a business stock exchange downturn. The vector concept uses a red arrow symbol to represent a market crash, financial loss, and a minimalist decrease in value.
Free with trial A playful, looping arrow pointing downwards, representing a decrease, download, or decline. This hand drawn vector illustration with a grunge texture works well for UI and data visualization. Decrease graph vector illustration vectors Looping Downward Arrow For Decrease Hand Drawn In A Vector Illustration Style. A playful, looping arrow pointing downwards, representing a decrease, download, or decline. This hand drawn vector illustration with a grunge texture works well for UI and data visualization
Free with trial A simple illustration of a declining blue bar graph against a black background. Represents loss or decrease. Decrease graph vector illustration vectors Declining bar graph demonstrating financial loss and recession illustration. A simple illustration of a declining blue bar graph against a black background. Represents loss or decrease.
Free with trial Arrow 3d chart graph pointer, vector illustration. Up and down forward arrow, motion and navigation symbol, financial growth concept. Web design elements crease of decrease sign. Decrease graph vector illustration vectors Arrow navigation pointer, chart graph. Arrow 3d chart graph pointer, vector illustration. Up and down forward arrow, motion and navigation symbol, financial growth concept. Web design elements crease of decrease sign
Free with trial Red bar graph with downward trend line and arrow. Four vertical bars decrease in height from left to right, illustrating a declining pattern. Bold, simple vector style on a white background, emphasizing financial or statistical downward movement. Decrease graph vector illustration illustrations Graph down or scale down vector art illustration. Red bar graph with downward trend line and arrow. Four vertical bars decrease in height from left to right, illustrating a declining pattern. Bold, simple vector style on a white background, emphasizing financial or statistical downward movement.
Free with trial Orange bar chart with downward arrow vector illustration. Financial loss, economic recession, market crash, business failure, negative growth, data analysis. Declining graph with falling trend. Decrease graph vector illustration vectors Decreasing bar chart with downward arrow showing financial loss and economic recession vector illustration. Orange bar chart with downward arrow vector. Orange bar chart with downward arrow vector illustration. Financial loss, economic recession, market crash, business failure, negative growth, data analysis. Declining graph with falling trend
Free with trial Blue bar chart with a black arrow bouncing backward vector illustration. Economic recession, financial loss, market crash, business failure, negative growth, setback. Data graph with falling pointer. Decrease graph vector illustration vectors Financial bar chart with a bouncing arrow pointing down economic recession and market loss vector illustration. Blue bar chart with a black arrow bouncing backward vector illustration. Economic recession, financial loss, market crash, business failure, negative growth, setback. Data graph with falling pointer
Free with trial A clear vector illustration of a line graph showing a downward trend. Represents financial decline, negative performance, market downturns, or decreasing metrics. Ideal for business reports, financial analysis, economic indicators, or risk assessment. It visually communicates a decrease or a challenging period, vector design Generative AI. Decrease graph vector illustration vectors Downtrend Line Graph Financial Market Decline, vector design Generative AI. A clear vector illustration of a line graph showing a downward trend. Represents financial decline, negative performance, market downturns, or decreasing metrics. Ideal for business reports, financial analysis, economic indicators, or risk assessment. It visually communicates a decrease or a challenging period, vector design Generative AI
Free with trial This vector illustration shows a set of black graph icons with rising and falling charts indicated by arrows showing trends in data with clear simple design and sharp edges calm. Generative AI. Decrease graph vector illustration vectors Black graph icons set rising and falling charts with arrows vector illustration simple design. This vector illustration shows a set of black graph icons with rising and falling charts indicated by arrows showing trends in data with clear simple design and sharp edges calm. Generative AI
Free with trial Financial crisis concept. Decreasing graph with falling columns. Vector illustration showing recession, bankruptcy, and economic decline. Decrease graph vector illustration vectors Financial crisis concept. Decreasing graph with falling columns. Vector illustration showing recession, bankruptcy
Free with trial A clear vector illustration of a declining line graph, symbolizing market downturn, economic challenges, and negative trends. Ideal for financial reports, business analysis, and risk assessment. Represents a decrease in performance and a need for strategic adjustments, vector design Generative AI. Decrease graph vector illustration vectors Declining Line Graph for Market Downturn and Economic Challenges, vector design Generative AI. A clear vector illustration of a declining line graph, symbolizing market downturn, economic challenges, and negative trends. Ideal for financial reports, business analysis, and risk assessment. Represents a decrease in performance and a need for strategic adjustments, vector design Generative AI
Free with trial A minimalist flat style vector illustration showing a downward sloping line graph in red. Represents decline, decrease, loss, or negative trends. Useful for financial reports, business presentations, analytics dashboards, or economic charts indicating reduction, vector design Generative AI. Decrease graph vector illustration vectors Flat style red line chart graph decline icon vector design Generative AI. A minimalist flat style vector illustration showing a downward sloping line graph in red. Represents decline, decrease, loss, or negative trends. Useful for financial reports, business presentations, analytics dashboards, or economic charts indicating reduction, vector design Generative AI
Free with trial A graph with a reduction report. A dagram showing the recession and bankruptcy. Business and finance concept. Vector illustration. Decrease graph vector illustration vectors Graph with a reduction report. A dagram showing the recession and bankruptcy. Business and finance concept. Vector illustration
Free with trial Business graph data in a bar chart showing increase and decrease with blue line illustration on plain background. Decrease graph vector illustration vectors Business graph data in a bar chart showing increase and decrease with blue line illustration on plain background
Free with trial Graph growth with arrow up and reduction with arrow down, line chart icon. Financial invest, fall, increase and decrease. Statistics and analytics. Vector flat illustration. Decrease graph vector illustration vectors Graph growth with arrow up and reduction with arrow down, line chart icon. Financial invest, fall, increase and decrease
Free with trial Graph growth with arrow up and reduction with arrow down, line chart icon. Financial invest, fall, increase and decrease. Statistics and analytics. Vector flat illustration. Decrease graph vector illustration vectors Graph growth with arrow up and reduction with arrow down, line chart icon. Financial invest, fall, increase and decrease
Free with trial Abstract Graph Decrease Icon Set, vector editable design, can be used for business or presentation design. Decrease graph vector illustration vectors Abstract Graph Decrease Icon Set
Free with trial 3D Isometric Flat Vector Illustration of Fertility Reduction In Europe, Decline Chart Showing Decrease in Number of People over Time. Decrease graph vector illustration vectors 3D Isometric Flat Vector Illustration of Fertility Reduction In Europe
Free with trial Finance data analytics, decrease graph line icon. Business research report analysis, finance performance analytics or company statistic outline vector icon column infographics and pointing down arrow. Decrease graph vector illustration illustrations Finance data analytics, decrease graph line icon
Free with trial A vector illustration depicting a red downward trending line graph with a coin falling below it. The word FAILURE is prominently displayed alongside the graph. The color palette is primarily red and maroon against a light gray background. The style is simple and minimalist, suitable for presentations or reports related to financial loss or business failure. The image conveys a sense of decline and. Decrease graph vector illustration illustrations Red Downward Trend Graph Coin Failure Vector Illustration. A vector illustration depicting a red downward trending line graph with a coin falling below it. The word FAILURE is prominently displayed alongside the graph. The color palette is primarily red and maroon against a light gray background. The style is simple and minimalist, suitable for presentations or reports related to financial loss or business failure. The image conveys a sense of decline and
Free with trial Graph chart going up and down sign arrows flat design vector illustration on white background. Decrease graph vector illustration vectors Graph chart going up and down sign arrows flat design vector illustration
Free with trial This vector illustration shows business icons representing time management, financial growth, investment, profit increase and decrease with simple human figures in black. Professional mood. Generative AI. Decrease graph vector illustration vectors Business icons time management financial growth investment profit increase decrease vector illustration. This vector illustration shows business icons representing time management, financial growth, investment, profit increase and decrease with simple human figures in black. Professional mood. Generative AI
Free with trial Businessman falling from the red graph chart arrow, bankruptcy concept. vector illustration. Decrease graph vector illustration vectors Businessman falling from the red graph chart arrow, bankruptcy concept. vector illustration.
Free with trial Colorful vector illustration in flat design of three melting bars, simulating a declining graph. Decrease graph vector illustration illustrations Flat design illustration of melting bars graph. Colorful vector illustration in flat design of three melting bars, simulating a declining graph
Free with trial Exponential Decay Curve Graph, icon in line design. Exponential, decay, curve, graph, decrease, decline, reduction on white background vector. Exponential Decay Curve Graph editable stroke icon. Decrease graph vector illustration vectors Exponential Decay Curve Graph, icon in line design. Exponential, decay, curve, graph, decrease, decline, reduction on
Free with trial Chart bars down, icon in line design. Chart, bars, down, decrease, drop, decline, graph on white background vector. Chart bars down editable stroke icon. Decrease graph vector illustration vectors Chart bars down, icon in line design. Chart, bars, down, decrease, drop, decline, graph on white background vector
Free with trial Vector 3D illustration of green arrow falling down. Decline graph. For diagrams and infographics. Business achievements. Isolated background. Render. Minimalism. Cursor. Decrease graph vector illustration vectors Vector 3D illustration of green arrow falling down.
Free with trial Recession concept. Falling market. The trading broker is horrified at the falling market. Financial graph down. Vector illustration isometric design. Decrease graph vector illustration illustrations Recession concept. Falling market. Vector illustration isometric design. Recession concept. Falling market. The trading broker is horrified at the falling market. Financial graph down. Vector illustration isometric design.
Free with trial Recession concept. Falling market. The trading broker is horrified at the falling market. Financial graph down. Vector illustration isometric design. Decrease graph vector illustration vectors Recession concept. Falling market. Vector illustration isometric design. Recession concept. Falling market. The trading broker is horrified at the falling market. Financial graph down. Vector illustration isometric design.
Free with trial Recession concept. Falling market. The trading broker is horrified at the falling market. Financial graph down. Vector illustration isometric design. Decrease graph vector illustration vectors Recession concept. Falling market. Vector illustration isometric design. Recession concept. Falling market. The trading broker is horrified at the falling market. Financial graph down. Vector illustration isometric design.
Free with trial Graph chart going up and down sign arrows flat design vector illustration on white background. Decrease graph vector illustration vectors Graph chart going up and down sign arrows flat design vector illustration
Free with trial Dopamine fasting concept. Graph and brain imagery depict the reduction of dopamine levels, symbolizing cognitive balance and happiness. Flat vector illustration. Decrease graph vector illustration vectors Dopamine fasting concept. Flat vector illustration. Dopamine fasting concept. Graph and brain imagery depict the reduction of dopamine levels, symbolizing cognitive balance and happiness. Flat vector illustration.
Free with trial Statistics icon set, bar diagram illustration, business graph logo icon vector. Decrease graph vector illustration vectors Statistics icon set, bar diagram illustration, business graph logo icon vector
Free with trial A worried woman stands on a paper boat in rough water, surrounded by downward arrows and a falling graph line on a light blue background. Concept of financial crisis. Vector illustration. Decrease graph vector illustration vectors Businesswoman on sinking paper boat concept. Vector illustration. A worried woman stands on a paper boat in rough water, surrounded by downward arrows and a falling graph line on a light blue background. Concept of financial crisis. Vector illustration
Free with trial A simple yet impactful vector illustration of an orange line graph showing a downward trend, representing a decrease or negative performance. This graphic is perfect for financial dashboards, stock market analysis, business presentations, or statistical reports. It clearly conveys declining metrics and critical data points, vector design Generative AI. Decrease graph vector illustration vectors Orange Decreasing Line Graph Vector. Financial Market Drop Graphic, vector design Generative AI. A simple yet impactful vector illustration of an orange line graph showing a downward trend, representing a decrease or negative performance. This graphic is perfect for financial dashboards, stock market analysis, business presentations, or statistical reports. It clearly conveys declining metrics and critical data points, vector design Generative AI
Free with trial A clear vector illustration of a red downward trending line graph, symbolizing a decrease, decline, or negative performance. This icon is essential for financial reports, business presentations, data visualization, or any context indicating a reduction. Its simple, sharp design effectively communicates a downward trend in various metrics, vector design Generative AI. Decrease graph vector illustration vectors Red Downward Trending Graph Line Icon, vector design Generative AI. A clear vector illustration of a red downward trending line graph, symbolizing a decrease, decline, or negative performance. This icon is essential for financial reports, business presentations, data visualization, or any context indicating a reduction. Its simple, sharp design effectively communicates a downward trend in various metrics, vector design Generative AI
Free with trial A vintage scooter positioned on a declining graph, representing a decrease in activity, challenging market trends, or reduced demand. This reflective illustration is useful for analytical reports, economic discussions, or problem identification. It conveys a sense of decline or performance issues, vector design Generative AI. Decrease graph vector illustration vectors Scooter on a downward graph, symbolizing decreased activity or challenges, vector design Generative AI. A vintage scooter positioned on a declining graph, representing a decrease in activity, challenging market trends, or reduced demand. This reflective illustration is useful for analytical reports, economic discussions, or problem identification. It conveys a sense of decline or performance issues, vector design Generative AI
Free with trial Set Pie chart infographic Graph chart diagram Financial growth decrease increase Factory Delivery tracking and Dollar symbol icon. Vector. Decrease graph vector illustration illustrations Set Pie chart infographic, Graph, chart, diagram, Financial growth decrease, increase, Factory, Delivery tracking and. Set Pie chart infographic Graph chart diagram Financial growth decrease increase Factory Delivery tracking and Dollar symbol icon. Vector.
Free with trial Market trend icon in comic style. Decline arrow with magnifier cartoon vector illustration on isolated background. Decrease splash effect business concept. Decrease graph vector illustration vectors Market trend icon in comic style. Decline arrow with magnifier cartoon vector illustration on isolated background. Decrease splash
Free with trial Crisis concept. Bankruptcy with falling down profit graph and money decrease. flat vector modern illustration. Decrease graph vector illustration vectors Crisis concept. Bankruptcy with falling down profit graph and money decrease.
Free with trial Crisis concept. Bankruptcy with falling down profit graph and money decrease. flat vector modern illustration. Decrease graph vector illustration vectors Crisis concept. Bankruptcy with falling down profit graph and money decrease.
Free with trial Crisis concept. Bankruptcy with falling down profit graph and money decrease. flat vector modern illustration. Decrease graph vector illustration vectors Crisis concept. Bankruptcy with falling down profit graph and money decrease.
Free with trial Crisis concept. Bankruptcy with falling down profit graph and money decrease. flat vector modern illustration. Decrease graph vector illustration vectors Crisis concept. Bankruptcy with falling down profit graph and money decrease.
Free with trial This vector illustration depicts a descending bar graph, representing decline and negative trends. It is suitable for financial reports, business analysis, and presentations. Decrease graph vector illustration vectors Illustration of a descending bar graph, , representing decline, decrease, and negative trends in business or finance. This vector illustration depicts a descending bar graph, representing decline and negative trends. It is suitable for financial reports, business analysis, and presentations
Free with trial Set line Factory Graph chart diagram Dollar symbol Arrow Pie infographic Financial growth increase decrease and icon. Vector. Decrease graph vector illustration vectors Set line Factory, Graph, chart, diagram, Dollar symbol, Arrow, Pie infographic, Financial growth increase, decrease and. Set line Factory Graph chart diagram Dollar symbol Arrow Pie infographic Financial growth increase decrease and icon. Vector.
Free with trial Set line Old hourglass with sand, Graph, chart, diagram, Financial growth decrease and Factory. White rectangle button. Vector. Decrease graph vector illustration vectors Set line Old hourglass with sand, Graph, chart, diagram, Financial growth decrease and Factory. White rectangle button
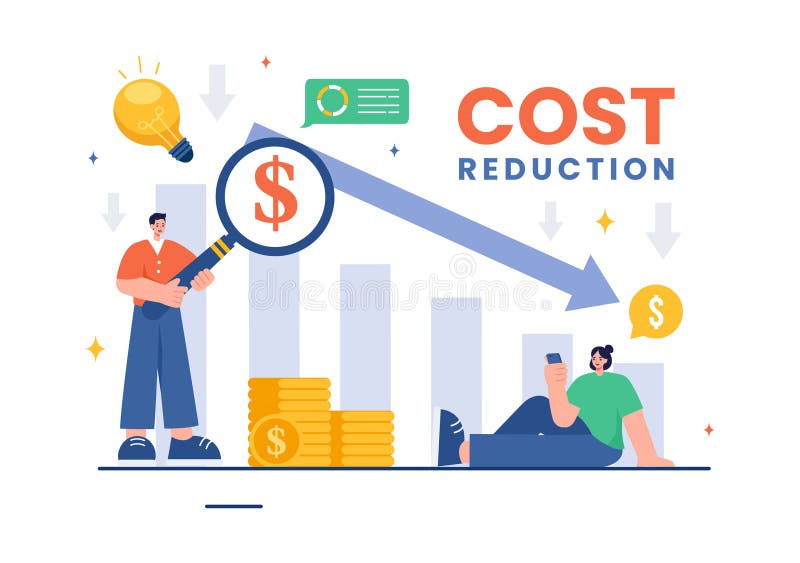
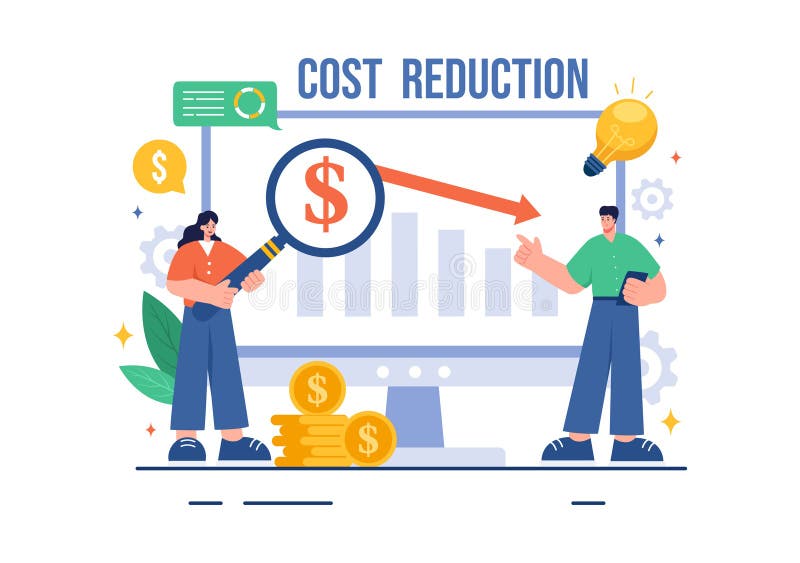
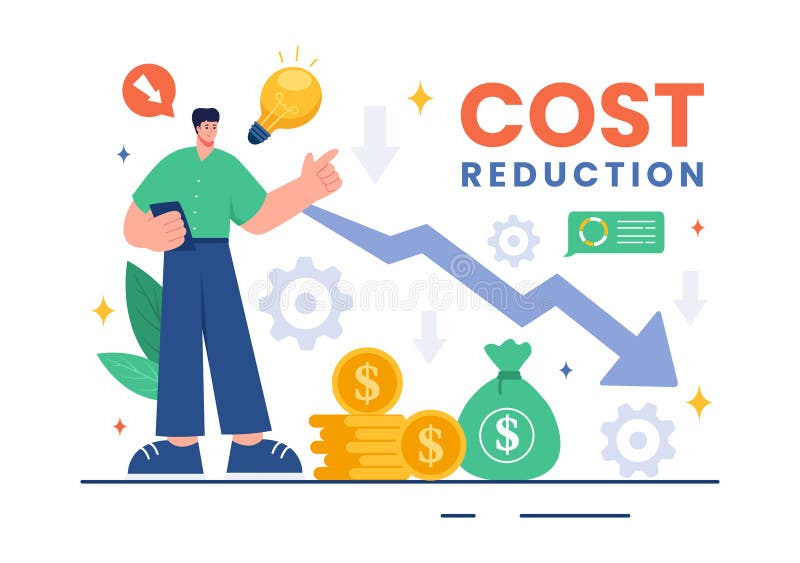
Free with trial Cost Reduction Vector Illustration depicting Decrease, Price Minimization, or Falling Profit Rates in Business, in a Flat Style Cartoon Background. Decrease graph vector illustration vectors Cost Reduction Vector Illustration depicting Decrease, Price Minimization, or Falling Profit Rates in Business, in a Flat Style
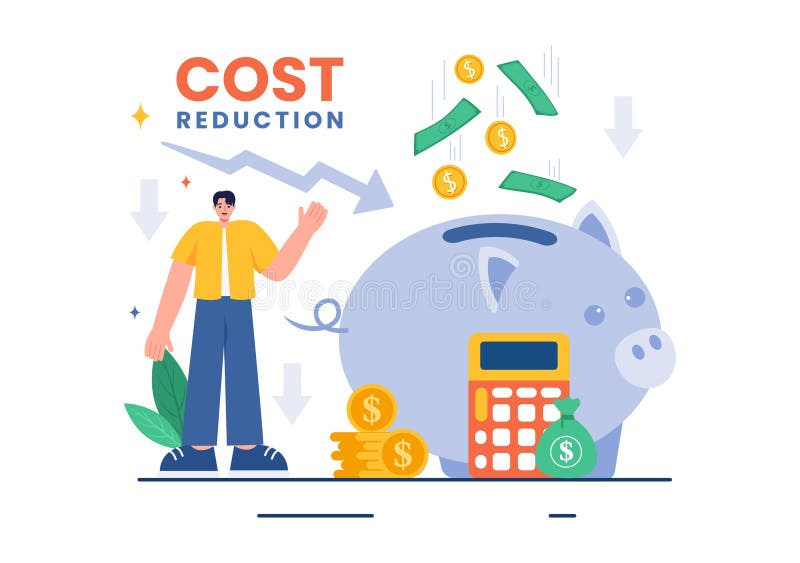
Free with trial Cost Reduction Vector Illustration depicting Decrease, Price Minimization, or Falling Profit Rates in Business, in a Flat Style Cartoon Background. Decrease graph vector illustration vectors Cost Reduction Vector Illustration depicting Decrease, Price Minimization, or Falling Profit Rates in Business, in a Flat Style
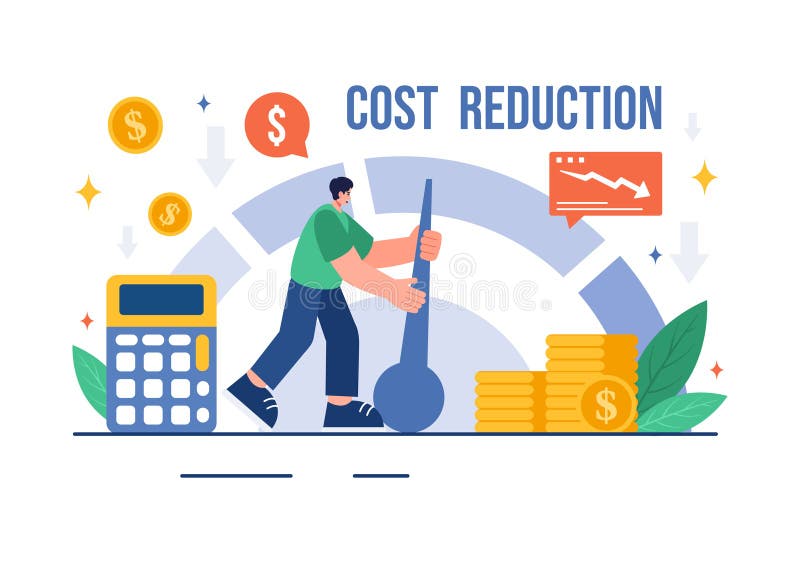
Free with trial Cost Reduction Vector Illustration depicting Decrease, Price Minimization, or Falling Profit Rates in Business, in a Flat Style Cartoon Background. Decrease graph vector illustration vectors Cost Reduction Vector Illustration depicting Decrease, Price Minimization, or Falling Profit Rates in Business, in a Flat Style
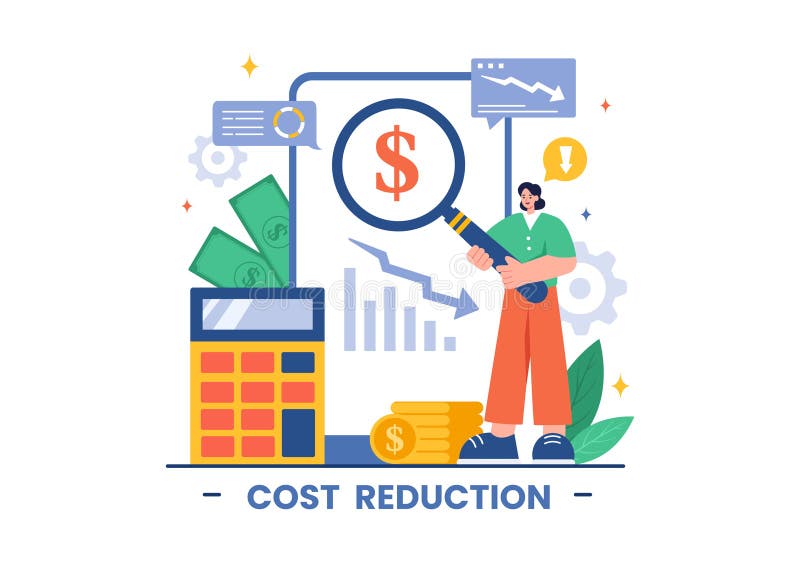
Free with trial Cost Reduction Vector Illustration depicting Decrease, Price Minimization, or Falling Profit Rates in Business, in a Flat Style Cartoon Background. Decrease graph vector illustration vectors Cost Reduction Vector Illustration depicting Decrease, Price Minimization, or Falling Profit Rates in Business, in a Flat Style
Free with trial Cost Reduction Vector Illustration depicting Decrease, Price Minimization, or Falling Profit Rates in Business, in a Flat Style Cartoon Background. Decrease graph vector illustration vectors Cost Reduction Vector Illustration depicting Decrease, Price Minimization, or Falling Profit Rates in Business, in a Flat Style
Free with trial Cost Reduction Vector Illustration depicting Decrease, Price Minimization, or Falling Profit Rates in Business, in a Flat Style Cartoon Background. Decrease graph vector illustration vectors Cost Reduction Vector Illustration depicting Decrease, Price Minimization, or Falling Profit Rates in Business, in a Flat Style
Free with trial Cost Reduction Vector Illustration depicting Decrease, Price Minimization, or Falling Profit Rates in Business, in a Flat Style Cartoon Background. Decrease graph vector illustration vectors Cost Reduction Vector Illustration depicting Decrease, Price Minimization, or Falling Profit Rates in Business, in a Flat Style
Free with trial Cost Reduction Vector Illustration depicting Decrease, Price Minimization, or Falling Profit Rates in Business, in a Flat Style Cartoon Background. Decrease graph vector illustration vectors Cost Reduction Vector Illustration depicting Decrease, Price Minimization, or Falling Profit Rates in Business, in a Flat Style
Free with trial Cost Reduction Vector Illustration depicting Decrease, Price Minimization, or Falling Profit Rates in Business, in a Flat Style Cartoon Background. Decrease graph vector illustration vectors Cost Reduction Vector Illustration depicting Decrease, Price Minimization, or Falling Profit Rates in Business, in a Flat Style
Free with trial Cost Reduction Vector Illustration depicting Decrease, Price Minimization, or Falling Profit Rates in Business, in a Flat Style Cartoon Background. Decrease graph vector illustration vectors Cost Reduction Vector Illustration depicting Decrease, Price Minimization, or Falling Profit Rates in Business, in a Flat Style
Free with trial Cost Reduction Vector Illustration depicting Decrease, Price Minimization, or Falling Profit Rates in Business, in a Flat Style Cartoon Background. Decrease graph vector illustration vectors Cost Reduction Vector Illustration depicting Decrease, Price Minimization, or Falling Profit Rates in Business, in a Flat Style
Free with trial Cost Reduction Vector Illustration depicting Decrease, Price Minimization, or Falling Profit Rates in Business, in a Flat Style Cartoon Background. Decrease graph vector illustration vectors Cost Reduction Vector Illustration depicting Decrease, Price Minimization, or Falling Profit Rates in Business, in a Flat Style