Free with trial Flat style image displaying a decreasing blue bar chart with a percentage icon, isolated on black. Decrease illustration vectors Blue bar chart showing decrease with percentage symbol icon. Flat style image displaying a decreasing blue bar chart with a percentage icon, isolated on black.
Free with trial Silver 3D symbols include a percentage sign and downward arrow, indicating a decrease. The clean white background accentuates the metallic appearance, suggesting themes of finance or economics. The symbols are arranged vertically, creating a straightforward visual message about reduction or decline. Decrease illustration illustrations Silver 3D symbols include a percentage sign and downward arrow, indicating a
Free with trial Concept of red arrow 8k digital technology against blurry background. Illustration for business decrease, loss, and failure with electronic circuit motherboard design. Decrease illustration illustrations Abstract red arrow 8k digital technology concept. Concept of red arrow 8k digital technology against blurry background. Illustration for business decrease, loss, and failure with electronic circuit motherboard design
Free with trial A simplified flat style icon displays a declining bar graph with arrow. Focuses on business and financial themes. Decrease illustration vectors Flat icon illustration showing bar chart trending downwards. A simplified flat style icon displays a declining bar graph with arrow. Focuses on business and financial themes.
Free with trial Flat vector illustration of a colorful bar graph showing a decreasing trend with an arrow on a black backdrop. Decrease illustration vectors Decreasing bar graph with downward arrow on black background. Flat vector illustration of a colorful bar graph showing a decreasing trend with an arrow on a black backdrop.
Free with trial A minimalist illustration of a muted speaker icon. The design features clean lines, rounded corners, and a blue to purple gradient. The background is black. Decrease illustration vectors Muted volume icon illustration in blue color gradient scheme. A minimalist illustration of a muted speaker icon. The design features clean lines, rounded corners, and a blue to purple gradient. The background is black.
Free with trial Up and down sign with green and red arrows vector illustration, sales bar chart symbol icon with arrow moving down and bar chart with arrow moving up, EPS 10. Decrease illustration vectors Up and down sign with green and red arrows vector illustration, sales bar chart symbol icon. Up and down sign with green and red arrows vector illustration, sales bar chart symbol icon with arrow moving down and bar chart with arrow moving up, EPS 10
Free with trial Financial realistic color set with money and budget symbols isolated vector illustration. Decrease illustration vectors Financial Color Set. Financial realistic color set with money and budget symbols isolated vector illustration
Free with trial Flat vector illustration of a user icon with downward arrows symbolizing download or data transfer process in turquoise and blue. Decrease illustration vectors User Icon with Downward Arrows Indicating Download or Transfer. Flat vector illustration of a user icon with downward arrows symbolizing download or data transfer process in turquoise and blue.
Free with trial Flat style illustration showcasing business financial data analysis via a magnifying glass and graph chart visualization, isolated on black. Decrease illustration vectors Analyzing Financial Data with Magnifying Glass and Graph Chart. Flat style illustration showcasing business financial data analysis via a magnifying glass and graph chart visualization, isolated on black.
Free with trial Man and woman try to catch flying coins escaping from a cracked piggy bank, symbolizing inflation, financial loss, and economic crisis, flat isolated vector illustration. Decrease illustration vectors People Losing Money From Broken Piggy Bank. Man and woman try to catch flying coins escaping from a cracked piggy bank, symbolizing inflation, financial loss, and economic crisis, flat isolated vector illustration
Free with trial Flat style illustration showing a downward trending financial chart with dollar coin and bars. Decrease illustration vectors Financial market decline showing loss with downward trend arrow. Flat style illustration showing a downward trending financial chart with dollar coin and bars.
Free with trial Weight Loss Line Icon, Fitness Health Waist Symbol Vector Illustration. Decrease illustration vectors Weight Loss Line Icon, Fitness Health Waist Symbol Vector Illustration
Free with trial Stylized vector icon depicting a stock market downturn with an arrow pointing down and coin illustration. Flat graphic style. Decrease illustration vectors Stock market decline icon showing financial graph downturn trend. Stylized vector icon depicting a stock market downturn with an arrow pointing down and coin illustration. Flat graphic style.
Free with trial Vector icon of bitcoin symbol on red arrow pointing down. Cryptocurrency crash concept with halftone texture. Isolated illustration for financial decline and market loss themes. Decrease illustration vectors Vector icon of bitcoin symbol on red arrow pointing down. Cryptocurrency crash concept with halftone texture. Isolated
Free with trial Bold red downward graph arrow 2D cartoon object. Trend market decline. Descending line chart. Business loss. Economic downturn isolated element flat vector clip art on white. Spot illustration. Decrease illustration vectors Bold red downward graph arrow 2D cartoon object
Free with trial A stylized heart design featuring concentric outlines in bright pink, alternating with white spaces. The heart shapes decrease in size towards the center, creating a layered effect. Set against a transparent background with a checkered pattern, typical for images with transparency. The lines are bold, clean, and evenly spaced, giving a modern and cheerful appearance. Decrease illustration vectors Pink hand-drawn heart illustration isolated on transparent background. A stylized heart design featuring concentric outlines in bright pink, alternating with white spaces. The heart shapes decrease in size towards the center, creating a layered effect. Set against a transparent background with a checkered pattern, typical for images with transparency. The lines are bold, clean, and evenly spaced, giving a modern and cheerful appearance.
Free with trial Five hand-drawn, concentric pink hearts on a transparent background. The hearts decrease in size towards the center, each nested within the next. The drawing is simplistic and symmetrical, with a consistent line thickness. The transparency of the background suggests versatility for use in various design contexts. Decrease illustration illustrations Red hand-drawn heart illustration isolated on transparent background. Five hand-drawn, concentric pink hearts on a transparent background. The hearts decrease in size towards the center, each nested within the next. The drawing is simplistic and symmetrical, with a consistent line thickness. The transparency of the background suggests versatility for use in various design contexts.
Free with trial Five concentric, hand-drawn hearts are depicted, each outlined in bright red on a transparent background. The hearts decrease in size from the outermost to the innermost, centered perfectly within one another. The outlines are smooth and bold, creating a visually appealing, symmetrical design that focuses on the theme of love and affection. The transparent background allows for versatile use in various digital or printed contexts. Decrease illustration illustrations Red hand-drawn heart illustration isolated on transparent background. Five concentric, hand-drawn hearts are depicted, each outlined in bright red on a transparent background. The hearts decrease in size from the outermost to the innermost, centered perfectly within one another. The outlines are smooth and bold, creating a visually appealing, symmetrical design that focuses on the theme of love and affection. The transparent background allows for versatile use in various digital or printed contexts.
Free with trial Large red arrow curves downward, glossy and 3D, on white background. Decrease illustration illustrations Red downward arrow, 3D illustration, curved and glossy, pointing down. Large red arrow curves downward, glossy and 3D, on white background
Free with trial Vector illustration featuring three stylized Christmas trees isolated on a white background. Each tree is composed of stacked conical shapes, resembling cones. The trees are displayed in three different colors: blue, yellow, and green. They are arranged in a horizontal line, each with a smooth, shiny texture, suggesting a modern, simplified design. The conical segments decrease in size as they ascend, creating a layered appearance typical of Christmas tree shapes. Decrease illustration vectors Vector set of realistic christmas tree isolated on white background. Vector illustration featuring three stylized Christmas trees isolated on a white background. Each tree is composed of stacked conical shapes, resembling cones. The trees are displayed in three different colors: blue, yellow, and green. They are arranged in a horizontal line, each with a smooth, shiny texture, suggesting a modern, simplified design. The conical segments decrease in size as they ascend, creating a layered appearance typical of Christmas tree shapes.
Free with trial 3D illustration of the black dissolving dollar - dollar crash. Decrease illustration illustrations Black Dissolving Dollar. 3d illustration. 3D illustration of the black dissolving dollar - dollar crash
Free with trial Work life imbalance red gradient concept icon. Overwhelming. Cause of voluntary employee turnover. Round shape line illustration. Abstract idea. Graphic design. Easy to use in promotional material,. Decrease illustration vectors Work life imbalance red gradient concept icon
Free with trial A clear, minimalist illustration featuring two distinct arrows on a clean white background. On the left, a blue arrow points downwards, symbolizing concepts like decrease, decline, or negative trends. On the right, a vibrant green arrow points upwards, representing increase, growth, improvement, or positive movement. Rendered in a modern flat design style, this versatile graphic is ideal for conveying directional changes, comparisons, data trends, or navigation in user interfaces, presentations, infographics, and educational content. Decrease illustration illustrations Green Up and Blue Down Arrows. A clear, minimalist illustration featuring two distinct arrows on a clean white background. On the left, a blue arrow points downwards, symbolizing concepts like decrease, decline, or negative trends. On the right, a vibrant green arrow points upwards, representing increase, growth, improvement, or positive movement. Rendered in a modern flat design style, this versatile graphic is ideal for conveying directional changes, comparisons, data trends, or navigation in user interfaces, presentations, infographics, and educational content.
Free with trial People observing star ratings with a large hand removing stars, representing negative feedback, dissatisfaction, and review system in business context isolated vector illustration. Decrease illustration vectors Customer Feedback Rating System Flat Vector Art. People observing star ratings with a large hand removing stars, representing negative feedback, dissatisfaction, and review system in business context isolated vector illustration
Free with trial CO2 emissions, exhaust and greenhouse gas reduction, global air pollution and footprint glyph icon set. Impact of industry on environment, climate solid symbols vector illustration. Decrease illustration vectors CO2 emissions, exhaust and greenhouse gas reduction, air pollution glyph icon set. CO2 emissions, exhaust and greenhouse gas reduction, global air pollution and footprint glyph icon set. Impact of industry on environment, climate solid symbols vector illustration
Free with trial 3D Illustration of two user icons with up and down arrows for growth and churn. Decrease illustration illustrations 3D Illustration of two user icons with up and down arrows for growth and churn
Free with trial Economic crisis recession financial downturn concept sad person sitting near falling graph stacks of documents world map background Vector illustration. Decrease illustration vectors Economic crisis recession financial downturn concept sad person sitting near falling graph stacks of documents world map
Free with trial CO2 Neutral. Mega set. Characters calculate emissions from factories and using green electricity. Net zero. Electricity consumption concept. Set of Vector illustration in flat cartoon style. Decrease illustration vectors CO2 Neutral. Mega set. Characters calculate emissions from factories and using green electricity. Net zero. Electricity
Free with trial Economic downturn, financial instability, business crisis, consumer spending, recovery, growth. Drooping plant with dotted line, dollar sign and shopping basket illustration. Economic downturn. Decrease illustration vectors Economic Decline and Recovery Concept with Drooping Plant, Dollar Sign, and Shopping Basket. Economic downturn, financial instability, business crisis, consumer spending, recovery, growth. Drooping plant with dotted line, dollar sign and shopping basket illustration. Economic downturn
Free with trial Yellow sad emoticon and green pants next to stylized line graph with nodes. Ideal for fashion industry, sales decrease, trends, dissatisfaction, analysis, loss, economics. Simple flat metaphor. Decrease illustration illustrations Sad face with pants and graph chart symbolizing loss or decline in trends or fashion demand. Yellow sad emoticon and green pants next to stylized line graph with nodes. Ideal for fashion industry, sales decrease, trends, dissatisfaction, analysis, loss, economics. Simple flat metaphor
Free with trial Abstract illustration of a financial graph with glowing lines on a dark background. The graph shows two distinct curves, one starting in cool blue tones and transitioning to warm orange hues, suggesting a shift in market trends or performance. The image conveys concepts of data analysis, growth, decline, and financial forecasting. Suitable for illustrating business reports, presentations, or articles related to finance, investment, and economics. Decrease illustration illustrations Abstract Financial Graph Illustration. Abstract illustration of a financial graph with glowing lines on a dark background. The graph shows two distinct curves, one starting in cool blue tones and transitioning to warm orange hues, suggesting a shift in market trends or performance. The image conveys concepts of data analysis, growth, decline, and financial forecasting. Suitable for illustrating business reports, presentations, or articles related to finance, investment, and economics.
Free with trial Single line art illustration of classic percent symbol isolated outline white background. Decrease illustration vectors Single line art illustration of classic percent symbol isolated outline
Free with trial Percent sign simple outline single line art illustration isolated design vector art. Decrease illustration vectors Percent sign simple outline single line art illustration isolated design
Free with trial Environmental awareness, sustainability, carbon tracking, ecological impact, climate change, emissions reduction. Magnifying glass with a CO2 footprint and downward arrow. Environmental awareness. Decrease illustration illustrations Carbon Footprint Monitoring and Reduction Concept with Magnifying Glass and CO2 Illustration. Environmental awareness, sustainability, carbon tracking, ecological impact, climate change, emissions reduction. Magnifying glass with a CO2 footprint and downward arrow. Environmental awareness
Free with trial Flat vector illustration of a businessman holding cash that is breaking apart, symbolizing financial loss, investment risk, economic instability, and money depreciation. Decrease illustration vectors Financial Loss Concept Illustration with Money Breaking and Investment Risk. Flat vector illustration of a businessman holding cash that is breaking apart, symbolizing financial loss, investment risk, economic instability, and money depreciation
Free with trial A simple and clean line graph icon illustration, perfect for illustrating financial data, growth charts, and statistical analysis. Ideal for use in presentations, reports, and websites. Decrease illustration vectors Minimalist Line Graph Icon Design for Financial Data Analysis Presentation. A simple and clean line graph icon illustration, perfect for illustrating financial data, growth charts, and statistical analysis. Ideal for use in presentations, reports, and websites.
Free with trial Simple outline illustration of percent sign continuous single line drawing white background. Decrease illustration vectors Simple outline illustration continuous single line drawing of percent sign. Simple outline illustration of percent sign continuous single line drawing white background
Free with trial Flat graphic showing a dollar coin with arrows illustrating market fluctuation and volatility, styled as flat cartoon icon. Decrease illustration vectors Investment Fluctuation Illustration Showing Increase and Decrease of Capital. Flat graphic showing a dollar coin with arrows illustrating market fluctuation and volatility, styled as flat cartoon icon.
Free with trial Percentage symbol simple single line art drawing outline illustration minimal vector art. Decrease illustration vectors Percentage symbol simple single line art drawing outline illustration minimal
Free with trial Bankruptcy and inflation business, man in depression. Vector of crisis finance bankruptcy, business economy inflation illustration. Decrease illustration vectors Bankruptcy and inflation business, man in depression
Free with trial Cartoon illustration of a declining green arrow over a pile of golden coins, representing falling gold prices or economic downturn. Investment value and economic decline stock trends. Decrease illustration vectors Gold Price Drop Falling Arrow and Coin Stack Vector Illustration. Cartoon illustration of a declining green arrow over a pile of golden coins, representing falling gold prices or economic downturn. Investment value and economic decline stock trends
Free with trial An illustration of Oil barrels on stacks of coins. Decrease of price of crude oil. Decrease illustration vectors Oil barrels on stacks of coins vector illustration. An illustration of Oil barrels on stacks of coins. Decrease of price of crude oil
Free with trial Up and Down sign with green and red arrows vector illustration. Concept of sales bar chart symbol icon with arrow moving down and sales bar chart with arrow moving up. Decrease illustration vectors Up and Down sign with green and red arrows vector illustration. Concept of sales bar chart symbol icon
Free with trial Business balance, opportunity and development concept. Young businessman cartoon character standing and balancing in bar charts vector illustration. Decrease illustration vectors Business balance, opportunity and development concept
Free with trial Isometric business analyst professional composition with conceptual financial analysis icons and people vector illustration. Decrease illustration vectors Business Analyst Woman Composition. Isometric business analyst professional composition with conceptual financial analysis icons and people vector illustration
Free with trial Consumer behavior, sustainability, e-commerce, recycling awareness, monetary trends, sales decrease. Blue arrow pointing down, recycling sign on a shopping bag and dollar coin. Consumer behavior. Decrease illustration vectors Arrow Pointing Downward with Shopping Bag and Dollar Symbol - E-Commerce and Sustainability Concepts. Consumer behavior, sustainability, e-commerce, recycling awareness, monetary trends, sales decrease. Blue arrow pointing down, recycling sign on a shopping bag and dollar coin. Consumer behavior
Free with trial Two speaker icons illustrate the volume control feature on a digital interface, with one icon indicating an increase and the other a decrease in sound levels. Decrease illustration vectors Adjusting volume settings with plus and minus speakers displayed on a digital interface. Two speaker icons illustrate the volume control feature on a digital interface, with one icon indicating an increase and the other a decrease in sound levels.
Free with trial Minimalist style percentage illustration continuous line drawing business graph vector art. Decrease illustration vectors Minimalist style percentage illustration continuous line drawing business graph
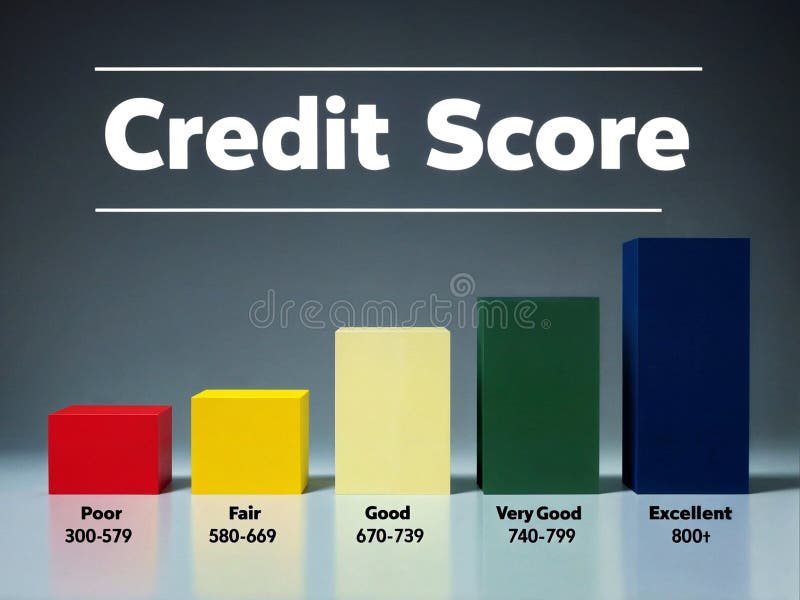
Free with trial 3d render illustration of increasing progress bar of indicating poor, fair, good, very good and excellent level of creditworthiness. Decrease illustration illustrations 3d illustration render progress bars indicating credit score level. 3d render illustration of increasing progress bar of indicating poor, fair, good, very good and excellent level of creditworthiness
Free with trial Personal finance, budgeting, cost reduction, online savings, economic strategies, financial planning. Piggy bank symbol with dollar sign, website layout and downward arrow. Personal finance. Decrease illustration vectors Financial Savings and Budgeting Concept with Piggy Bank and Website Graph Indicating Costs Decrease. Personal finance, budgeting, cost reduction, online savings. Personal finance, budgeting, cost reduction, online savings, economic strategies, financial planning. Piggy bank symbol with dollar sign, website layout and downward arrow. Personal finance
Free with trial Data combining line graph style illustration analysis visualization, ch series, point plot data combining line graph style. Decrease illustration illustrations Data combining line graph style
Free with trial A circular arrangement of colorful heart shapes creates a radial design against a white background. The hearts, in shades of green, blue, orange, red, and purple, decrease in size toward the center, forming concentric circles. This vector illustration is likely themed for Valentine's Day, emphasizing themes of love and romance through its vibrant and symmetrical heart pattern. Decrease illustration illustrations Colorful Hearts Circle Frame Valentine\'s Day Vector Card Background Romantic Love Design Stock Illustration. A circular arrangement of colorful heart shapes creates a radial design against a white background. The hearts, in shades of green, blue, orange, red, and purple, decrease in size toward the center, forming concentric circles. This vector illustration is likely themed for Valentine's Day, emphasizing themes of love and romance through its vibrant and symmetrical heart pattern.
Free with trial Decline disintegrating stock chart illustration bearish trend, selloff downturn, crash correction decline disintegrating stock chart. Decrease illustration illustrations Decline disintegrating stock chart
Free with trial European Union trade war tariffs war economic downturn red declining graph chart yellow EU stars blue grid background financial crisis Vector illustration. Decrease illustration illustrations European Union trade war tariffs war economic downturn red declining graph chart yellow EU stars blue grid background
Free with trial Red bar graph with downward trend line and arrow. Four vertical bars decrease in height from left to right, illustrating a declining pattern. Bold, simple vector style on a white background, emphasizing financial or statistical downward movement. Decrease illustration illustrations Graph down or scale down vector art illustration. Red bar graph with downward trend line and arrow. Four vertical bars decrease in height from left to right, illustrating a declining pattern. Bold, simple vector style on a white background, emphasizing financial or statistical downward movement.
Free with trial U. S. Inflation and labor market weakness illustration with sad workers and declining wages. Decrease illustration vectors U.S. Inflation and labor market weakness illustration
Free with trial A simple and clear illustration depicting a downward trend. The image features a bar graph with decreasing values, indicated by bars of different heights. A prominent red arrow points downwards, visually emphasizing the negative trend. This graphic is suitable for representing financial losses, declining sales, economic downturns, or any concept of decrease. The clean design and use of color make it easily understandable and versatile for various applications. Decrease illustration vectors Downward Trend Chart with Red Arrow. A simple and clear illustration depicting a downward trend. The image features a bar graph with decreasing values, indicated by bars of different heights. A prominent red arrow points downwards, visually emphasizing the negative trend. This graphic is suitable for representing financial losses, declining sales, economic downturns, or any concept of decrease. The clean design and use of color make it easily understandable and versatile for various applications.
Free with trial Financial decline concept. Illustration shows stacked coins indicating decreasing growth, paired with a sad face. Financial losses, economic downturn, personal investment, budgeting, business loss. Decrease illustration vectors Declining Financial Growth by Stacked Coins and Sad Face Symbol. Financial decline concept. Illustration shows stacked coins indicating decreasing growth, paired with a sad face. Financial losses, economic downturn, personal investment, budgeting, business loss
Free with trial Dollar currency icons set with arrows for financial growth, money loss, exchange and transactions. Vector illustration of money symbols. Decrease illustration vectors Dollar currency icons set with arrows for financial growth, money loss, exchange and transactions
Free with trial Illustration of a growing mobile application usage with a simple phone screen displaying a rising graph, a stylized touch hand, and a stream of download arrows. Vector flat icon design on a white background for a user adoption illustration --chaos 30 --ar 16:9 --v 7 Job ID: 938d3d73-bd25-4740-98fd-21a43555bec1. Decrease illustration illustrations Smartphone showing declining graph with arrows pointing down, concept of financial loss, data decrease. Illustration of a growing mobile application usage with a simple phone screen displaying a rising graph, a stylized touch hand, and a stream of download arrows. Vector flat icon design on a white background for a user adoption illustration --chaos 30 --ar 16:9 --v 7 Job ID: 938d3d73-bd25-4740-98fd-21a43555bec1
Free with trial Illustration of stock market losses. Bankrupt financial information concept with arrows pointing down. Stock market correction concept. Descending trading graph. Decrease illustration vectors Illustration of stock market losses. Bankrupt financial information concept with arrows pointing down. Stock market correction
Free with trial Candlestick chart displaying financial data trends with red and green bars on a white background. Each candlestick represents price movement over a specific time period, reflecting opening, closing, high, and low prices. Green candles indicate a price increase, while red ones signify a decrease. Vertical lines, or wicks, extend above and below the body of the candle, showing price extremes. This visualization is commonly used in financial markets to analyze stock prices and trends. Decrease illustration illustrations Candlestick chart displaying financial data trends with red and green bars on a
Free with trial Downturn fading sales graph illustration fall dip, shrinkage contraction, slide erosion downturn fading sales graph. Decrease illustration illustrations Downturn fading sales graph
Free with trial A graphic representation of a signal strength meter with decreasing bars and a negative symbol. This visualization suggests a drop in connectivity during evening activities. Decrease illustration vectors Signal strength indicator showing a decrease in connectivity status during late evening hours. A graphic representation of a signal strength meter with decreasing bars and a negative symbol. This visualization suggests a drop in connectivity during evening activities.
Free with trial Connected cube network in blockchain style, sales decrease arrow, and analytics report. Ideal for blockchain, cryptocurrency, sales, technology, analytics, business data-driven decision-making. Decrease illustration illustrations Blockchain Network with Sales Decline and Analytics Representation. Connected cube network in blockchain style, sales decrease arrow, and analytics report. Ideal for blockchain, cryptocurrency, sales, technology, analytics, business data-driven decision-making
Free with trial Chmetrics flowing loss graph illustration training accuracy, performance trend, analysis epoch chmetrics flowing loss graph. Decrease illustration illustrations Chmetrics flowing loss graph
Free with trial Real time carbon emission data monitoring and CO2 tracking outline concept. Smart city feature for air quality management to avoid carbon dioxide gas pollution vector illustration. Green urban scene. Decrease illustration vectors Real time carbon emission data monitoring and CO2 tracking outline concept
Free with trial A simple and effective line graph illustrating the concept of debt reduction. The chart, on a clean white background, shows a green line trending downwards, representing a successful decrease in liabilities over time. A final red arrow emphasizes a significant or accelerated drop, symbolizing a successful financial strategy, cost-cutting, or achieving financial freedom. This vector illustration is perfect for presentations, articles, and infographics on personal or business finance, money management, and economic stability. Decrease illustration vectors Debt Reduction Concept Graph Showing Downward Trend. A simple and effective line graph illustrating the concept of debt reduction. The chart, on a clean white background, shows a green line trending downwards, representing a successful decrease in liabilities over time. A final red arrow emphasizes a significant or accelerated drop, symbolizing a successful financial strategy, cost-cutting, or achieving financial freedom. This vector illustration is perfect for presentations, articles, and infographics on personal or business finance, money management, and economic stability.
Free with trial Gear mechanism with people icons falling beneath a large down arrow, illustrating decrease in metrics, performance decline, workflow reduction and lowered efficiency in business or system settings. Decrease illustration vectors Gear mechanism indicating reducing downward process. Gear mechanism with people icons falling beneath a large down arrow, illustrating decrease in metrics, performance decline, workflow reduction and lowered efficiency in business or system settings
Free with trial Concentric circles in a metallic gold finish create a striking pattern against a dark background. The circles decrease in size as they converge towards the center, giving a sense of depth and perspective. The gold material has a reflective quality, adding dimension and visual interest to the design. The overall effect is both geometric and elegant, suitable for decorative or artistic uses. Decrease illustration illustrations Concentric circles in a metallic gold finish create a striking pattern against a dark
Free with trial A conceptual vector illustration depicting the currency exchange rate between the US Dollar (USD) and the Euro (EUR). The green dollar sign is shown with an upward-pointing arrow and a rising trend line, symbolizing an increase in its value. Conversely, the red Euro sign is accompanied by a downward-pointing arrow and a falling trend line, indicating a decrease in its value. A red checkmark sits between them, emphasizing the shift. This graphic effectively visualizes market fluctuations, forex trading, economic trends, and international finance, suitable for financial news, reports, and presentations. Decrease illustration vectors USD EUR Currency Exchange Rate Trend and Fluctuation. A conceptual vector illustration depicting the currency exchange rate between the US Dollar (USD) and the Euro (EUR). The green dollar sign is shown with an upward-pointing arrow and a rising trend line, symbolizing an increase in its value. Conversely, the red Euro sign is accompanied by a downward-pointing arrow and a falling trend line, indicating a decrease in its value. A red checkmark sits between them, emphasizing the shift. This graphic effectively visualizes market fluctuations, forex trading, economic trends, and international finance, suitable for financial news, reports, and presentations.
Free with trial Decline scanning revenue chart illustration forecast data, performance metrics, visualization comparison decline scanning revenue chart. Decrease illustration illustrations Decline scanning revenue chart
Free with trial Scale with illustrations of cash and home stocks. The concept of inflation. Stock Illustration. Home price is decrease. Decrease illustration vectors Scale with illustrations of cash and home stocks. The concept of inflation. Stock Illustration
Free with trial Growth pulsating revenue chart illustration trends analysis, forecast metrics, insights performance growth pulsating revenue chart. Decrease illustration illustrations Growth pulsating revenue chart
Free with trial Magnify zooming terminal window illustration enlarge scale, view display, font text magnify zooming terminal window. Decrease illustration illustrations Magnify zooming terminal window
Free with trial Visualization fading line chart illustration dec statistics, metrics performance, report comparison visualization fading line chart. Decrease illustration illustrations Visualization fading line chart
Free with trial Black Friday banner. Halftone collage torn paper sale poster, woman hand ripped retro output page discount up to 50 off limited autumn offer promo background vector illustration original artwork. Decrease illustration vectors Black Friday banner. Halftone collage torn paper sale poster, woman hand ripped retro output page discount up to 50 off limited
Free with trial Graph going Up and Down sign with green and red arrows vector. Flat design vector illustration concept of sales bar chart symbol icon with arrow moving down and sales bar chart with arrow moving up. Decrease illustration illustrations Graph going Up and Down sign with green and red arrows vector. Flat design vector illustration concept of sales bar chart symbol. Graph going Up and Down sign with green and red arrows vector. Flat design vector illustration concept of sales bar chart symbol icon with arrow moving down and sales bar chart with arrow moving up.