Free with trial Gear mechanism showing a large downward arrow surrounded by smaller blue figures, illustrating a concept of decline, decrease, or negative trend within a system or process. Decrease illustration vectors Economic downfall concept with downward arrow in gear. Gear mechanism showing a large downward arrow surrounded by smaller blue figures, illustrating a concept of decline, decrease, or negative trend within a system or process
Free with trial Pink Searching for food in trash can on streets outdoors icon isolated on pink background. Homelessness and poverty concept. Minimalism concept. 3D render illustration. Decrease illustration illustrations Pink Searching for food in trash can on streets outdoors icon isolated on pink background. Homelessness and poverty
Free with trial This 3D rendering features a hexagon-shaped icon set against a stark black background, containing a central golden-colored metallic tower composed of multiple symmetrical rows of drawers that decrease in size from the top to the bottom, creating a sleek and organized structure with a reflective finish that evokes concepts of futuristic technology, data storage, security, and sophisticated digital. Decrease illustration illustrations A 3D rendered hexagon icon containing a golden tower with multiple rows of drawers arranged symmetrically on a black background. This 3D rendering features a hexagon-shaped icon set against a stark black background, containing a central golden-colored metallic tower composed of multiple symmetrical rows of drawers that decrease in size from the top to the bottom, creating a sleek and organized structure with a reflective finish that evokes concepts of futuristic technology, data storage, security, and sophisticated digital
Free with trial Visualization melting line chart illustration trend graph, temperature plot, axis series visualization melting line chart. Decrease illustration illustrations Visualization melting line chart
Free with trial An isolated minimalist flat style illustration of a red circle with a horizontal line inside representing a minus or negative symbol. Perfect for use in web design, user interface elements, or educational materials. Decrease illustration vectors Simple Flat Circle Minus Sign Button Shape Icon Graphic. An isolated minimalist flat style illustration of a red circle with a horizontal line inside representing a minus or negative symbol. Perfect for use in web design, user interface elements, or educational materials.
Free with trial This abstract financial graph visually represents a significant economic downturn or market decline. A prominent, bold red arrow sharply points downwards across a blue grid background, symbolizing loss, recession, or a negative trend. A lighter blue fluctuating line also shows a general downward trajectory, indicating market volatility or a secondary metric. This impactful illustration is ideal for conveying concepts of financial crisis, business failure, falling stock prices, or any situation involving a sharp decrease and poor performance. Decrease illustration vectors Economic Downturn Graph with Red Arrow Showing Decline. This abstract financial graph visually represents a significant economic downturn or market decline. A prominent, bold red arrow sharply points downwards across a blue grid background, symbolizing loss, recession, or a negative trend. A lighter blue fluctuating line also shows a general downward trajectory, indicating market volatility or a secondary metric. This impactful illustration is ideal for conveying concepts of financial crisis, business failure, falling stock prices, or any situation involving a sharp decrease and poor performance.
Free with trial Visualization flowing loss graph illustration data plot, chmetrics training, accuracy performance visualization flowing loss graph. Decrease illustration illustrations Visualization flowing loss graph
Free with trial Vector illustration of a downward arrow symbolizing economic decline, recession, and financial downturn. Decrease illustration vectors Vector illustration of a downward arrow symbolizing economic decline, recession
Free with trial Isometric business analyst professional composition with conceptual financial analysis icons and people vector illustration. Decrease illustration vectors Business Growth Arrows Composition. Isometric business analyst professional composition with conceptual financial analysis icons and people vector illustration
Free with trial A versatile vector illustration of a green volume control icon, indicating both increase and decrease sound. This graphic is perfect for user interfaces, audio mixers, media players, or interactive applications. Its dynamic design provides clear visual feedback for sound adjustment, vector design Generative AI. Decrease illustration vectors Green Volume Up Down Sound Icon, vector design Generative AI. A versatile vector illustration of a green volume control icon, indicating both increase and decrease sound. This graphic is perfect for user interfaces, audio mixers, media players, or interactive applications. Its dynamic design provides clear visual feedback for sound adjustment, vector design Generative AI
Free with trial Line Graph Chart Line And Solid Icon Set. Data Analysis, Trend Visualization, And Business Growth Symbol Collection. Statistical Representation And Performance Tracking. Isolated Vector Illustration. Decrease illustration vectors Line Graph Chart Line And Solid Icon Set. Data Analysis, Trend Visualization, And Business Growth Symbol Collection
Free with trial Bits of planet earth are seen being cut out and falling like confetti away in a 3-d illustration about depleted natural resources. Decrease illustration illustrations Falling like confetti away in a 3-d illustration about depleted natural resources
Free with trial Bearish disintegrating stock chart illustration trend selloff, downturn crash, correction recession bearish disintegrating stock chart. Decrease illustration illustrations Bearish disintegrating stock chart
Free with trial Simple outline icon of hand offering money and downward arrow. Represents decrease, loss, recession, and financial challenge. Decrease illustration vectors Outline Simple Hand Offering Money Down Arrow Icon Symbol. Simple outline icon of hand offering money and downward arrow. Represents decrease, loss, recession, and financial challenge.
Free with trial A simple hand-drawn illustration of a bar chart or graph. The chart is rendered in black lines on a white background, with the lower portions of the bars filled with diagonal hatching. This image can be used to represent data, statistics, growth, progress, or analysis in a visually appealing and informal way. Suitable for presentations, reports, or website graphics. Decrease illustration illustrations Hand-Drawn Bar Chart Illustration. A simple hand-drawn illustration of a bar chart or graph. The chart is rendered in black lines on a white background, with the lower portions of the bars filled with diagonal hatching. This image can be used to represent data, statistics, growth, progress, or analysis in a visually appealing and informal way. Suitable for presentations, reports, or website graphics.
Free with trial An illustration featuring two contrasting arrows against a plain white background. The red arrow shows a wavy upward trend, symbolizing growth, increase, or positive performance with fluctuation. The black arrow shows a wavy downward trend, symbolizing decline, decrease, or negative performance with fluctuation. This visual concept is often used to represent financial market volatility, business. Decrease illustration vectors Dynamic business trends illustrated by contrasting red upward and black downward arrows Vector. An illustration featuring two contrasting arrows against a plain white background. The red arrow shows a wavy upward trend, symbolizing growth, increase, or positive performance with fluctuation. The black arrow shows a wavy downward trend, symbolizing decline, decrease, or negative performance with fluctuation. This visual concept is often used to represent financial market volatility, business
Free with trial Reduced carbon footprint vector icon. Hand drawn doodle illustration of a CO2 cloud shaped like a sole with a downward arrow. Environmental responsibility through decreasing emissions and sustainable ecological practices. Decrease illustration vectors Reduced carbon footprint vector icon. Hand drawn doodle illustration of a CO2 cloud shaped like a sole. Reduced carbon footprint vector icon. Hand drawn doodle illustration of a CO2 cloud shaped like a sole with a downward arrow. Environmental responsibility through decreasing emissions and sustainable ecological practices.
Free with trial Visualization flat style streaming sales graph illustration trend revenue, chperformance metrics, dashboard report visualization flat style streaming sales graph. Decrease illustration illustrations Visualization flat style streaming sales graph
Free with trial Modern black and white vector icons depicting financial trends like rising, falling, and stable graphs, dollar signs, and investment arrows for business presentations and reports. Decrease illustration vectors Financial trend icons vector illustration showing profit loss growth and investment flat design. Modern black and white vector icons depicting financial trends like rising, falling, and stable graphs, dollar signs, and investment arrows for business presentations and reports.
Free with trial A simple and bold icon illustration of a bar graph. This can be used to represent data, statistics, growth, or trends. The icon is designed in a clean and minimalist style, making it versatile for various applications. Decrease illustration vectors Simple Bold Bar Graph Sign Shape Icon for Data Presentation. A simple and bold icon illustration of a bar graph. This can be used to represent data, statistics, growth, or trends. The icon is designed in a clean and minimalist style, making it versatile for various applications.
Free with trial Set line Employee dismissal, Money bag, Pie chart infographic and Dollar rate decrease icon. Vector. Decrease illustration illustrations Set line Employee dismissal, Money bag, Pie chart infographic and Dollar rate decrease icon. Vector
Free with trial A 3D illustration of a red arrow pointing downward on a graph, indicating a decline or negative trend in business, finance, or economy. The image represents a decrease or loss in value, and can be used to symbolize a crisis, recession, or failure. Decrease illustration illustrations A red arrow pointing downward on a graph indicating a decline. A 3D illustration of a red arrow pointing downward on a graph, indicating a decline or negative trend in business, finance, or economy. The image represents a decrease or loss in value, and can be used to symbolize a crisis, recession, or failure.
Free with trial Percentage growth and decline icons. Percent arrow up and down flat style symbols. Vector illustration. Decrease illustration vectors Percentage growth and decline icons. Percent arrow up and down flat style symbols. Vector illustration
Free with trial A clean vector illustration featuring a set of plus and minus icons in various styles, perfect for digital interfaces and graphic design needs, offering scalability and clarity. Decrease illustration vectors Plus and Minus Icons Set Vector Illustration, Simple Symbols for Addition and Subtraction, Flat Design. A clean vector illustration featuring a set of plus and minus icons in various styles, perfect for digital interfaces and graphic design needs, offering scalability and clarity
Free with trial A vivid red downward pointing arrow on a plain white background, symbolizing decline or decrease. Decrease illustration illustrations Illustration of a red downward pointing arrow. A vivid red downward pointing arrow on a plain white background, symbolizing decline or decrease
Free with trial Blue Global economic crisis icon isolated on blue background. World finance crisis. Minimalism concept. 3D render illustration. Decrease illustration illustrations Blue Global economic crisis icon isolated on blue background. World finance crisis. Minimalism concept. 3D render
Free with trial Illustration close up of woman show red gingivitis, oral problem. Decrease illustration illustrations Illustration close up of woman show gingivitis, oral problem
Free with trial A detailed 3D rendering of a metallic silver mechanical gear with a spiral arrangement of teeth, where the largest teeth are positioned at the bottom and gradually decrease in size toward the top, set against a dark blue background that enhances the industrial aesthetic and highlights the intricate grooves and reflective surfaces of the metal component. Decrease illustration illustrations A 3D rendered mechanical gear with spiral teeth pattern in silver metal against a dark blue contrasting background. A detailed 3D rendering of a metallic silver mechanical gear with a spiral arrangement of teeth, where the largest teeth are positioned at the bottom and gradually decrease in size toward the top, set against a dark blue background that enhances the industrial aesthetic and highlights the intricate grooves and reflective surfaces of the metal component
Free with trial A black and white minimalist line art illustration of a circular spiral design. The design consists of a series of curved lines arranged in concentric layers, creating a spiral pattern that rotates clockwise. The lines are thick and bold, forming a series of overlapping loops that decrease in size towards the center. The spiral has a hollow center creating a perfect circle. The entire design is rendered in solid black against a white background. The lines have a consistent thickness and maintain smooth curves throughout the spiral pattern. The illustration has a clean, geometric quality with sharp edges and precise line work. Decrease illustration vectors Circular spiral pattern in bold black lines with hollow center. A black and white minimalist line art illustration of a circular spiral design. The design consists of a series of curved lines arranged in concentric layers, creating a spiral pattern that rotates clockwise. The lines are thick and bold, forming a series of overlapping loops that decrease in size towards the center. The spiral has a hollow center creating a perfect circle. The entire design is rendered in solid black against a white background. The lines have a consistent thickness and maintain smooth curves throughout the spiral pattern. The illustration has a clean, geometric quality with sharp edges and precise line work.
Free with trial Three stacks of gold coins, varying in height, are arranged side by side. Red downward arrows are above the smallest stack on the left, indicating decline, while green upward arrows are above the tallest stack in the center, suggesting growth. The stack on the right is of medium height. The illustration uses a watercolor style to represent financial concepts of increase and decrease. Decrease illustration vectors Financial Growth and Decline Coin Stacks with Up and Down Arrows. Three stacks of gold coins, varying in height, are arranged side by side. Red downward arrows are above the smallest stack on the left, indicating decline, while green upward arrows are above the tallest stack in the center, suggesting growth. The stack on the right is of medium height. The illustration uses a watercolor style to represent financial concepts of increase and decrease.
Free with trial Carbon neutral concept vector illustration featuring 3D white clouds, CO2 text and downward arrows on a blue background. Representing greenhouse gas emission reduction and eco friendly environment. Decrease illustration vectors Carbon neutral concept vector illustration featuring 3D white clouds, CO2 text and downward arrows on a blue background. Representing greenhouse gas emission
Free with trial A vibrant, hand-drawn doodle illustration centered around a large percentage sign. This creative sketch features various financial and business icons, including bar graphs, pie charts, stacks of coins, dollar signs, and arrows indicating growth and decline. The colorful, cartoonish style makes it perfect for illustrating concepts like interest rates, economic trends, business analytics, and financial reports. Ideal for use in presentations, infographics, websites, and educational materials, this vector art is isolated on a white background for versatile application. Decrease illustration illustrations Finance and Economy Doodle Illustration. A vibrant, hand-drawn doodle illustration centered around a large percentage sign. This creative sketch features various financial and business icons, including bar graphs, pie charts, stacks of coins, dollar signs, and arrows indicating growth and decline. The colorful, cartoonish style makes it perfect for illustrating concepts like interest rates, economic trends, business analytics, and financial reports. Ideal for use in presentations, infographics, websites, and educational materials, this vector art is isolated on a white background for versatile application.
Free with trial A stylized, flat design illustration of a bar chart depicting a downward trend. The bars are colored red, yellow, and blue, arranged in decreasing height from left to right. A prominent red arrow points downwards across the chart, emphasizing the decline. The graphic is set against a clean white background, making it ideal for presentations, reports, and financial concepts related to loss, decrease, or negative performance. Decrease illustration illustrations Declining Bar Chart with Downward Arrow. A stylized, flat design illustration of a bar chart depicting a downward trend. The bars are colored red, yellow, and blue, arranged in decreasing height from left to right. A prominent red arrow points downwards across the chart, emphasizing the decline. The graphic is set against a clean white background, making it ideal for presentations, reports, and financial concepts related to loss, decrease, or negative performance.
Free with trial Purple Global economic crisis icon isolated on purple background. World finance crisis. Minimalism concept. 3D render illustration. Decrease illustration illustrations Purple Global economic crisis icon isolated on purple background. World finance crisis. Minimalism concept. 3D render
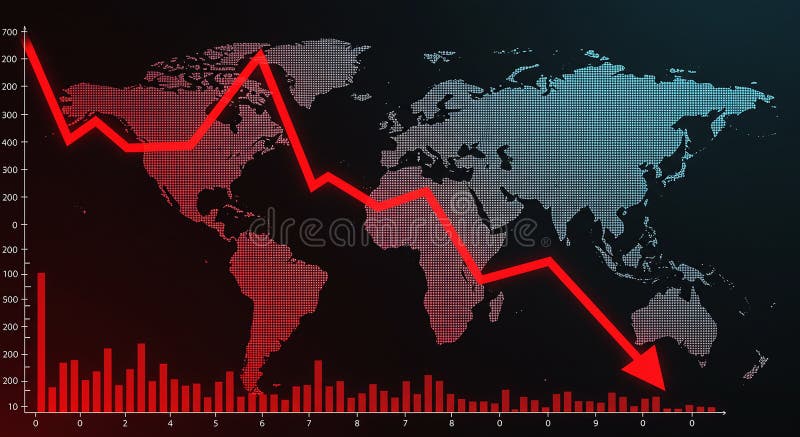
Free with trial World map with a red declining line graph overlay, illustrating a decrease or economic downturn. The graph features sharp declines across various data points, reflecting a downward trend. Red bar chart at the bottom represents additional numerical data against a black background. The map uses a dotted pattern for continents, highlighting regions globally. The image conveys financial analysis, market trends, or economic statistics. Decrease illustration illustrations World map with a red declining line graph overlay
Free with trial Flat illustration of technical analysis with a magnifying glass on a yellow background. Stock market correction concept. Bankrupt financial information. Descending trading graph. Decrease illustration vectors Flat illustration of technical analysis with a magnifying glass on a yellow background. Stock market correction concept. Bankrupt
Free with trial Data metallic style declining sales graph illustration report forecast, revenue market, performance downturn data metallic style declining sales graph. Decrease illustration illustrations Data metallic style declining sales graph
Free with trial The bright orange tubes in the shape of hundredths are shrinking. The path of bright honeycomb pipes into a black background. Bright shaped isolated vector illustration. Repeated twisted tubes form a line. Decrease illustration vectors Bright orange tubes in the shape of hundredths are shrinking. The path of bright honeycomb pipes into a black background
Free with trial Businesswoman drags a ripped money bag and losing money and coins for bankruptcy, financial crisis and recession concept illustration. Decrease illustration vectors Businesswoman Drags Ripped Money Bag and Losing Money and Coins for Bankruptcy, Financial Crisis Recession Concept Illustration. Businesswoman drags a ripped money bag and losing money and coins for bankruptcy, financial crisis and recession concept illustration
Free with trial A man wad malnutrition, thin weak poverty hunger, illustration cartoon on white background. Decrease illustration illustrations Man wad malnutrition, thin weak poverty hunger, illustration cartoon on white background
Free with trial This image depicts a stack of coins with a downward trending arrow, symbolizing a decrease in cost-effectiveness. Decrease illustration illustrations Illustration of decreasing cost-effectiveness with stacked coins. This image depicts a stack of coins with a downward trending arrow, symbolizing a decrease in cost-effectiveness
Free with trial A functional vector illustration of a left pointing triangle with a minus sign, typically used for rewind or volume decrease in media players. This icon is ideal for audio or video editing software, music apps, or digital interfaces requiring media control, vector design Generative AI. Decrease illustration vectors Rewind volume control, audio media player, vector design Generative AI. A functional vector illustration of a left pointing triangle with a minus sign, typically used for rewind or volume decrease in media players. This icon is ideal for audio or video editing software, music apps, or digital interfaces requiring media control, vector design Generative AI
Free with trial Set of Burning Money Set Collection, Burning Money Dollar Bill in Flame Illustration - Cash Fire Destruction, Financial Loss Concept, Wealth Waste or Protest, Isolated on White Background. Decrease illustration vectors Set of Burning Money Set Collection, Burning Money Dollar Bill in Flame Illustration - Cash Fire Destruction, Financial Loss
Free with trial Repeated circles on the reduction are arranged along like a tube. The path of the orange rings into the black background. Bright ring isolated vector illustration. Repeated rings form a line. Decrease illustration vectors Repeated circles on the reduction are arranged along like a tube. The path of the orange rings into the black background
Free with trial A conceptual image depicting low dopamine levels. Wooden letter blocks spell DOPAMINE, accompanied by a sad face and a downward arrow, illustrating a decrease in this crucial neurotransmitter. (AI-Generated Content). Decrease illustration illustrations Dopamine word blocks showing low levels and sad mood health concept. A conceptual image depicting low dopamine levels. Wooden letter blocks spell DOPAMINE, accompanied by a sad face and a downward arrow, illustrating a decrease in this crucial neurotransmitter. (AI-Generated Content)
Free with trial Financial crisis, business bankruptcy, money loss, and economy collapse concepts. Vector of crisis financial, bankruptcy and recession illustration. Decrease illustration vectors Financial crisis, business bankruptcy, money loss, and economy collapse concepts
Free with trial A minimalist illustration of a downward pointing zigzag arrow, conveying decline, direction, and a sense of motion. Great for illustrating a negative trend or movement. Decrease illustration vectors Simple Bold Zigzag Decline Arrow Direction Sign Symbol Icon Element. A minimalist illustration of a downward pointing zigzag arrow, conveying decline, direction, and a sense of motion. Great for illustrating a negative trend or movement.
Free with trial An isolated vector illustration featuring two prominent, stylized arrows on a clean white background. One arrow, colored in shades of red and pink, points diagonally upwards and to the right, symbolizing growth, increase, or positive trends. The other arrow, rendered in blue and cyan tones, points diagonally downwards and to the left, representing decline, decrease, or negative movement. Both arrows have a modern, slightly textured or sketchy appearance, making them ideal for infographics, business presentations, financial reports, or conceptual designs illustrating contrasting directions, market changes, or comparative data. Decrease illustration illustrations Growth and Decline Arrows with Sketchy Style. An isolated vector illustration featuring two prominent, stylized arrows on a clean white background. One arrow, colored in shades of red and pink, points diagonally upwards and to the right, symbolizing growth, increase, or positive trends. The other arrow, rendered in blue and cyan tones, points diagonally downwards and to the left, representing decline, decrease, or negative movement. Both arrows have a modern, slightly textured or sketchy appearance, making them ideal for infographics, business presentations, financial reports, or conceptual designs illustrating contrasting directions, market changes, or comparative data.
Free with trial This image features an abstract illustration of a bar graph against a dark gray background. The graph consists of three vertical bars of varying heights, each with horizontal rectangles inside. The bars are shades of white and gray, creating a minimalist and modern design. This image can be used to represent data, growth, statistics, or business performance in a visually appealing manner. Decrease illustration vectors Abstract Bar Graph Illustration. This image features an abstract illustration of a bar graph against a dark gray background. The graph consists of three vertical bars of varying heights, each with horizontal rectangles inside. The bars are shades of white and gray, creating a minimalist and modern design. This image can be used to represent data, growth, statistics, or business performance in a visually appealing manner.
Free with trial A set of simple and clean line art icons representing various financial and business concepts, including growth, decrease, profit, and loss. These icons are suitable for use in presentations, websites, and mobile applications. Decrease illustration vectors Simple Line Art Financial Chart Symbol Icon Set for Business Concept. A set of simple and clean line art icons representing various financial and business concepts, including growth, decrease, profit, and loss. These icons are suitable for use in presentations, websites, and mobile applications.
Free with trial Temperature monitoring. Large thermometer with downward arrow signifying decrease, accompanied by figure analyzing data. Temperature monitoring for weather, environment, health, sustainability. Decrease illustration vectors Temperature Measurement and Data Analysis Concept with Thermometer and Downward Arrow. Temperature monitoring. Large thermometer with downward arrow signifying decrease, accompanied by figure analyzing data. Temperature monitoring for weather, environment, health, sustainability
Free with trial Aesthetic pastel style diminishing line graph illustration soft gradient, design minimal, subtle smooth aesthetic pastel style diminishing line graph. Decrease illustration illustrations Aesthetic pastel style diminishing line graph
Free with trial An illustration of a simple line graph showing a decline or decrease, accompanied by an exclamation mark inside a triangle, indicating a warning, danger or risk. Suitable for topics like financial loss, market crash, or economic downturn. Decrease illustration vectors Simple Line Decline Graph with Exclamation Mark Attention Icon Design. An illustration of a simple line graph showing a decline or decrease, accompanied by an exclamation mark inside a triangle, indicating a warning, danger or risk. Suitable for topics like financial loss, market crash, or economic downturn.
Free with trial This image depicts a visual representation of financial or business growth and decline using a series of ascending and descending three-dimensional bar charts, where the left side shows smaller bars gradually increasing in height, transitioning through a central flat bar, and shifting to taller bars on the right side that progressively decrease, all set against a plain white background to. Decrease illustration illustrations Growth and progress concept with ascending and descending bar charts illustrating business success and financial improvement over. This image depicts a visual representation of financial or business growth and decline using a series of ascending and descending three-dimensional bar charts, where the left side shows smaller bars gradually increasing in height, transitioning through a central flat bar, and shifting to taller bars on the right side that progressively decrease, all set against a plain white background to
Free with trial 3d illustration of red decreasing graph on stand, financial presentation representing negative results or economic downturn. Decrease illustration vectors 3d illustration of red decreasing graph on stand, financial presentation representing negative results
Free with trial Set Pie chart infographic, Dollar rate decrease, Shutdown of factory and Glass money jar with coin icon. Vector. Decrease illustration illustrations Set Pie chart infographic, Dollar rate decrease, Shutdown of factory and Glass money jar with coin icon. Vector
Free with trial A minimalist and clean line art illustration of a graph depicting a downward trend, symbolizing economic decline, failure, or a recession in business. Decrease illustration vectors Simple Outline Falling Graph Line Chart Economic Recession Business Icon. A minimalist and clean line art illustration of a graph depicting a downward trend, symbolizing economic decline, failure, or a recession in business.
Free with trial A clear vector illustration of a line graph showing a downward trend. Represents financial decline, negative performance, market downturns, or decreasing metrics. Ideal for business reports, financial analysis, economic indicators, or risk assessment. It visually communicates a decrease or a challenging period, vector design Generative AI. Decrease illustration vectors Downtrend Line Graph Financial Market Decline, vector design Generative AI. A clear vector illustration of a line graph showing a downward trend. Represents financial decline, negative performance, market downturns, or decreasing metrics. Ideal for business reports, financial analysis, economic indicators, or risk assessment. It visually communicates a decrease or a challenging period, vector design Generative AI
Free with trial Year data charts illustration color coded, categories month, total representation year data charts. Decrease illustration illustrations Year data charts
Free with trial Satisfaction meter offset shadow line icon. Customer experience, commerce. Measurement indicator. Sad, happy. Bold outline symbol with solid red fill. Modern flat illustration. Editable stroke. Decrease illustration vectors Satisfaction meter offset shadow line icon
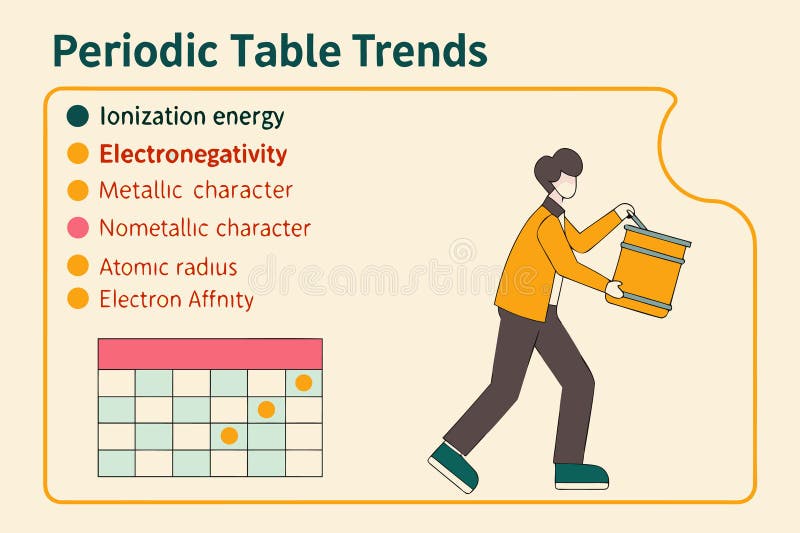
Free with trial Vector illustration depicting periodic table trends variety. Decrease illustration vectors Vector illustration depicting periodic table trends
Free with trial Stock market. The rise and fall of securities. Successful trading. Market trend up green and red down arrows, financial graphs. Business investment growth and loss arrow. Graph going up and down symbol vector illustration. Decrease illustration vectors Stock market. The rise and fall of securities. Successful trading. Market trend up green and red down arrows, financial graphs.
Free with trial Stock market. The rise and fall of securities. Successful trading. Market trend up green and red down arrows, financial graphs. Business investment growth and loss arrow. Graph going up and down symbol vector illustration. Decrease illustration vectors Stock market. The rise and fall of securities. Successful trading. Market trend up green and red down arrows, financial graphs.
Free with trial Stock market. The rise and fall of securities. Successful trading. Market trend up green and red down arrows, financial graphs. Business investment growth and loss arrow. Graph going up and down symbol vector illustration. Decrease illustration vectors Stock market. The rise and fall of securities. Successful trading. Market trend up green and red down arrows, financial graphs.
Free with trial Stock market. The rise and fall of securities. Successful trading. Market trend up green and red down arrows, financial graphs. Business investment growth and loss arrow. Graph going up and down symbol vector illustration. Decrease illustration vectors Stock market. The rise and fall of securities. Successful trading. Market trend up green and red down arrows, financial graphs.
Free with trial Stock market. The rise and fall of securities. Successful trading. Market trend up green and red down arrows, financial graphs. Business investment growth and loss arrow. Graph going up and down symbol vector illustration. Decrease illustration vectors Stock market. The rise and fall of securities. Successful trading. Market trend up green and red down arrows, financial graphs.
Free with trial Stock market. The rise and fall of securities. Successful trading. Market trend up green and red down arrows, financial graphs. Business investment growth and loss arrow. Graph going up and down symbol vector illustration. Decrease illustration vectors Stock market. The rise and fall of securities. Successful trading. Market trend up green and red down arrows, financial graphs.
Free with trial Abstract geometric design featuring a tunnel-like pattern of concentric squares, alternating in vivid yellow and magenta. Squares decrease in size towards the center, creating a visual illusion of depth and motion. Each square maintains sharp, clean lines, enhancing the sense of perspective. The repetitive pattern emphasizes symmetry and uniformity throughout the composition, engaging the viewer's perception in an endless visual loop. Decrease illustration illustrations Abstract geometric design featuring a tunnel-like pattern of concentric squares
Free with trial Cost optimization concept. Man with huge pencil near calculator and graphs, diagrams and charts. Financial literacy and management of expenses. Price reduction. Flat vector illustration. Decrease illustration vectors Cost optimization concept. Man with huge pencil near calculator and graphs, diagrams and charts. Financial literacy and management
Free with trial This vector illustration shows a set of money bags coins cash and arrows representing finance and business concepts in a simple black style calm professional. Generative AI. Decrease illustration vectors Money bag coin stack cash arrow finance business currency icon set vector illustration. This vector illustration shows a set of money bags coins cash and arrows representing finance and business concepts in a simple black style calm professional. Generative AI
Free with trial Neutral face symbol with downward arrow signifying decrease or decline, positioned above a cloud icon. Ideal for concepts thumbs up emotion, productivity, transition, feedback, mental state, change. Decrease illustration vectors Neutral expression face with downward arrow and cloud representing mood or emotional shift. Neutral face symbol with downward arrow signifying decrease or decline, positioned above a cloud icon. Ideal for concepts thumbs up emotion, productivity, transition, feedback, mental state, change
Free with trial Falling stitched paper hearts confetti on white background. Eminent vector illustration. Decrease illustration vectors Falling stitched paper hearts confetti on white background. Eminent vector illustration
Free with trial Set line Casino chip with dollar Coin money win Automated teller machine and chips slot clover Financial growth decrease and Stacks paper cash icon. Vector. Decrease illustration illustrations Set line Casino chip with dollar, Coin money, win, Automated teller machine and, chips, slot clover, Financial growth. Set line Casino chip with dollar Coin money win Automated teller machine and chips slot clover Financial growth decrease and Stacks paper cash icon. Vector.
Free with trial Illustration of a business activities. Decrease illustration vectors Illustration of a business activities
Free with trial Illustration of a business activities. Decrease illustration vectors Illustration of a business activities
Free with trial Illustration of a business activities. Decrease illustration vectors Illustration of a business activities
Free with trial Illustration of a business activities. Decrease illustration vectors Illustration of a business activities
Free with trial Illustration of a business activities. Decrease illustration vectors Illustration of a business activities
Free with trial Illustration of a business activities. Decrease illustration vectors Illustration of a business activities
Free with trial Illustration of a business activities. Decrease illustration vectors Illustration of a business activities