Free with trial A bold red 3D curved arrow pointing downwards. This symbolizes a decrease in profits, economic recession, stock market crash, and negative financial trends in a business context. Decrease vectors Red 3D Curved Arrow Pointing Down Representing Market Crash and Financial Loss. A bold red 3D curved arrow pointing downwards. This symbolizes a decrease in profits, economic recession, stock market crash, and negative financial trends in a business context.
Free with trial Analysis spiraling line graph illustration curve plot, statistics diagram, increase decrease analysis spiraling line graph. Decrease illustrations Analysis spiraling line graph
Free with trial Cartoon-style illustration of a caterpillar with a segmented body in shades of green and mint. The caterpillar features two small antennae, large round eyes, and a simple, expressive face. Its segments decrease in size towards the tail, and it is shown against a plain white background. The design is playful and stylized, appealing for children or whimsical themes. Decrease illustrations Cartoon-style illustration of a caterpillar with a segmented body in shades of gree
Free with trial Tiredness line icon of anemia symptom and physical disease, vector hematology. Tired or exhausted man with low energy battery outline sign of anaemia blood disorder, hemoglobin lack, oxygen decrease. Decrease illustrations Tiredness icon of anemia symptom, physical disease. Tiredness line icon of anemia symptom and physical disease, vector hematology. Tired or exhausted man with low energy battery outline sign of anaemia blood disorder, hemoglobin lack, oxygen decrease
Free with trial Consumer behavior, sustainability, e-commerce, recycling awareness, monetary trends, sales decrease. Blue arrow pointing down, recycling sign on a shopping bag and dollar coin. Consumer behavior. Decrease vectors Arrow Pointing Downward with Shopping Bag and Dollar Symbol - E-Commerce and Sustainability Concepts. Consumer behavior, sustainability, e-commerce, recycling awareness, monetary trends, sales decrease. Blue arrow pointing down, recycling sign on a shopping bag and dollar coin. Consumer behavior
Free with trial Two speaker icons illustrate the volume control feature on a digital interface, with one icon indicating an increase and the other a decrease in sound levels. Decrease vectors Adjusting volume settings with plus and minus speakers displayed on a digital interface. Two speaker icons illustrate the volume control feature on a digital interface, with one icon indicating an increase and the other a decrease in sound levels.
Free with trial Economic crisis icon of price low down or stock market depreciation, vector line symbol. Global economy and business downturn with financial crisis and prices decrease or percent down low. Decrease illustrations Economic crisis icon, price low down, stock market. Economic crisis icon of price low down or stock market depreciation, vector line symbol. Global economy and business downturn with financial crisis and prices decrease or percent down low
Free with trial A visual representation of an energy efficiency rating system is displayed on a white background. It consists of seven horizontal arrows, each labeled with a letter from A (green) at the top to G (red) at the bottom. The arrows decrease in size as they go down the scale, with intermediate colors like yellow and orange representing intermediate ratings. Decrease illustrations Energy Efficiency Rating Chart with Colored Arrows from A to G graph. A visual representation of an energy efficiency rating system is displayed on a white background. It consists of seven horizontal arrows, each labeled with a letter from A (green) at the top to G (red) at the bottom. The arrows decrease in size as they go down the scale, with intermediate colors like yellow and orange representing intermediate ratings
Free with trial Personal finance, budgeting, cost reduction, online savings, economic strategies, financial planning. Piggy bank symbol with dollar sign, website layout and downward arrow. Personal finance. Decrease vectors Financial Savings and Budgeting Concept with Piggy Bank and Website Graph Indicating Costs Decrease. Personal finance, budgeting, cost reduction, online savings. Personal finance, budgeting, cost reduction, online savings, economic strategies, financial planning. Piggy bank symbol with dollar sign, website layout and downward arrow. Personal finance
Free with trial Price and discount, cost reduction, profit growth financial strategy line icon set. Increase and decrease, optimization of price, competition thin black and red outline symbols vector illustration. Decrease vectors Price and discount, cost reduction, profit growth financial strategy line icon set
Free with trial A 3D rendered image shows a large, red percentage symbol accompanied by a downward-pointing red arrow. This graphic represents a decrease in percentage, often used to illustrate concepts like price drops, discounts, interest rate reductions, or economic downturns. The simple, clean design with a neutral background makes it suitable for various business and financial contexts. Decrease illustrations Red Percentage Drop. A 3D rendered image shows a large, red percentage symbol accompanied by a downward-pointing red arrow. This graphic represents a decrease in percentage, often used to illustrate concepts like price drops, discounts, interest rate reductions, or economic downturns. The simple, clean design with a neutral background makes it suitable for various business and financial contexts.
Free with trial A bright red, three-dimensional arrow is depicted pointing directly downwards. The arrow has a glossy, reflective surface and is presented in isolation against a stark white background. This visual element commonly represents a downward trend, decrease, or negative movement. Decrease illustrations Shiny Red 3D Arrow Pointing Downwards on a White Background direction. A bright red, three-dimensional arrow is depicted pointing directly downwards. The arrow has a glossy, reflective surface and is presented in isolation against a stark white background. This visual element commonly represents a downward trend, decrease, or negative movement
Free with trial Silver 3D symbols include a percentage sign and downward arrow, indicating a decrease. The clean white background accentuates the metallic appearance, suggesting themes of finance or economics. The symbols are arranged vertically, creating a straightforward visual message about reduction or decline. Decrease illustrations Silver 3D symbols include a percentage sign and downward arrow, indicating a
Free with trial A visual representation of a downward trend, where colorful stacks of translucent tokens decrease in height. Decrease illustrations Financial Decline Chart with Colored Tokens. A visual representation of a downward trend, where colorful stacks of translucent tokens decrease in height
Free with trial The image features a minimalist design of a white spiral set against a plain white background. The spiral is composed of concentric circles that gradually decrease in size, creating a sense of depth and movement. The design is simple yet striking, with clean lines and a monochromatic color scheme. Decrease illustrations Minimalist white spiral design. The image features a minimalist design of a white spiral set against a plain white background. The spiral is composed of concentric circles that gradually decrease in size, creating a sense of depth and movement. The design is simple yet striking, with clean lines and a monochromatic color scheme
Free with trial An illustrative bar graph on a dark purple background depicts a clear downward trend using yellow bars and a prominent descending arrow. The text "Debt Reduction" is displayed below the chart. This visual metaphor effectively represents the successful management and decrease of financial obligations, highlighting progress in financial health. It is ideal for use in financial planning, economic reports, personal finance articles, business presentations, or any content related to improving financial stability and reducing liabilities. The clean, flat design makes it versatile for various digital and print media. Decrease vectors Debt Reduction Bar Graph with Downward Trend. An illustrative bar graph on a dark purple background depicts a clear downward trend using yellow bars and a prominent descending arrow. The text "Debt Reduction" is displayed below the chart. This visual metaphor effectively represents the successful management and decrease of financial obligations, highlighting progress in financial health. It is ideal for use in financial planning, economic reports, personal finance articles, business presentations, or any content related to improving financial stability and reducing liabilities. The clean, flat design makes it versatile for various digital and print media.
Free with trial Cloud with CO2 text and downward arrows. symbol for carbon dioxide emission reduction and climate change initiative. Decrease vectors CO2 reduction icon representing carbon emission decrease and environmental effort. Cloud with CO2 text and downward arrows. symbol for carbon dioxide emission reduction and climate change initiative
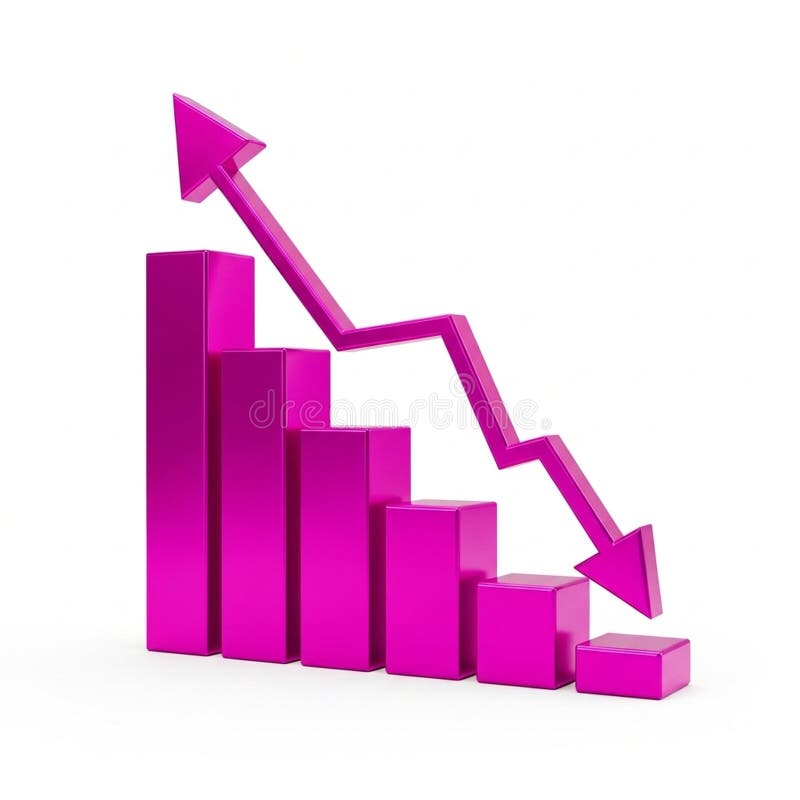
Free with trial A 3D bar chart rendered in a vibrant pink color illustrates a significant downward trend. The bars decrease in height from left to right, culminating in a very short bar. A bold pink arrow, also in 3D, starts high on the left and sharply descends to the right, mirroring the decline shown by the bars. The entire graphic is isolated on a clean white background. Decrease illustrations Pink 3D Bar Chart Showing a Downward Trend with an Arrow graph decline. A 3D bar chart rendered in a vibrant pink color illustrates a significant downward trend. The bars decrease in height from left to right, culminating in a very short bar. A bold pink arrow, also in 3D, starts high on the left and sharply descends to the right, mirroring the decline shown by the bars. The entire graphic is isolated on a clean white background
Free with trial Set of circular dollar currency icons with up and down arrows representing profit, loss, exchange and rate changes flat and glyph styles in black, red and green for business and finance use. Decrease vectors Money Currency Icons With Up And Down Arrows Showing Increase And Decrease Financial Trends. Set of circular dollar currency icons with up and down arrows representing profit, loss, exchange and rate changes flat and glyph styles in black, red and green for business and finance use.
Free with trial A 3D financial chart depicting a stock market downturn. The chart features blue and pink bar graphs with numerical values like 45,971 and 37,020. A red downward-curving line with arrows illustrates the declining trend. The background is dark, emphasizing the vibrant colors of the bars and line. Small numbers indicate data points along the bottom, highlighting the decrease in value over time. The visual representation effectively conveys a negative financial trend. Decrease illustrations Declining Stock Market Performance Financial Charts Showing Downturn Trend. A 3D financial chart depicting a stock market downturn. The chart features blue and pink bar graphs with numerical values like 45,971 and 37,020. A red downward-curving line with arrows illustrates the declining trend. The background is dark, emphasizing the vibrant colors of the bars and line. Small numbers indicate data points along the bottom, highlighting the decrease in value over time. The visual representation effectively conveys a negative financial trend.
Free with trial Technological geometric vector illustration showing blue polygonal arrow aimed downwards. Modern digital art piece depicting financial decrease or direction using crystal triangulation technique. Decrease vectors Abstract low poly blue arrow pointing down on dark background representing decline. Technological geometric vector illustration showing blue polygonal arrow aimed downwards. Modern digital art piece depicting financial decrease or direction using crystal triangulation technique
Free with trial Economic crisis icon, analysis of global market economy downturn and bankruptcy, vector line symbol. Magnifier and arrow down icon of stock exchange and economical index decrease of financial crisis. Decrease vectors Economic crisis icon, analysis of market downturn. Economic crisis icon, analysis of global market economy downturn and bankruptcy, vector line symbol. Magnifier and arrow down icon of stock exchange and economical index decrease of financial crisis
Free with trial Data melting line graph illustration trend analysis, visualization ice, decrease plot data melting line graph. Decrease illustrations Data melting line graph
Free with trial Diagonal arrow pointing down left symbol representing downward trend, reduction movement and directional navigation indicator used in data visualization and interface tools. Decrease vectors Arrow Diagonal Down Left Direction Symbol For Decrease Trend Navigation Color Icon. Diagonal arrow pointing down left symbol representing downward trend, reduction movement and directional navigation indicator used in data visualization and interface tools
Free with trial A series of six celestial bodies align in a straight line against a dark cosmic backdrop. The largest and brightest object on the left represents a star with a radiant glow, while five smaller, spherical bodies decrease in size and brightness as they extend toward the right. The arrangement suggests an artistic depiction of planets orbiting a central star, emphasizing simplicity and contrast through the use of light and dark elements. ai generative. Decrease illustrations A Cosmic Spectacle of Celestial Bodies Aligned in Orbit Around a Bright Star. A series of six celestial bodies align in a straight line against a dark cosmic backdrop. The largest and brightest object on the left represents a star with a radiant glow, while five smaller, spherical bodies decrease in size and brightness as they extend toward the right. The arrangement suggests an artistic depiction of planets orbiting a central star, emphasizing simplicity and contrast through the use of light and dark elements. ai generative
Free with trial A black and white icon depicts a laptop with a downward-trending graph on the screen. The graph features a zigzagging line sloping downward, ending with an arrow. The design implies a decrease, decline, or loss in data or performance, commonly used in financial or business contexts. Simple and minimalistic, it effectively communicates the concept of negative change in a digital context. Decrease vectors Laptop with a downward-trending graph
Free with trial A vibrant green 3D arrow is depicted pointing downwards, with a layered or stepped design. The arrow has a smooth, glossy finish and casts a subtle shadow on the white background. This visual element represents concepts of decrease, decline, or downward movement. Decrease illustrations Green 3D arrow pointing downwards with layered effect direction movement. A vibrant green 3D arrow is depicted pointing downwards, with a layered or stepped design. The arrow has a smooth, glossy finish and casts a subtle shadow on the white background. This visual element represents concepts of decrease, decline, or downward movement
Free with trial This image depicts a 3D stock market chart with green and red candlesticks. The chart shows fluctuations in stock prices over a period of time. Green candlesticks indicate an increase in stock prices, while red candlesticks indicate a decrease. The chart is set on a grid background, providing a clear visualization of the price movements. Decrease illustrations Stock market chart with green and red candles
Free with trial Red bar graph with downward trend line and arrow. Four vertical bars decrease in height from left to right, illustrating a declining pattern. Bold, simple vector style on a white background, emphasizing financial or statistical downward movement. Decrease illustrations Graph down or scale down vector art illustration. Red bar graph with downward trend line and arrow. Four vertical bars decrease in height from left to right, illustrating a declining pattern. Bold, simple vector style on a white background, emphasizing financial or statistical downward movement.
Free with trial This image features a sequence of cubes of varying sizes arranged in a diagonal line against a transparent background. The largest cube is positioned on the left, and the cubes gradually decrease in size towards the right. The image is clear and SEO-friendly. Decrease illustrations Sequence of cubes isolated on white background. This image features a sequence of cubes of varying sizes arranged in a diagonal line against a transparent background. The largest cube is positioned on the left, and the cubes gradually decrease in size towards the right. The image is clear and SEO-friendly
Free with trial A monochrome halftone dot pattern transitions from solid black on the edges to a bright white center. The dots are evenly spaced and decrease in density as they move towards the illuminated middle, creating a smooth gradient effect. Decrease illustrations Halftone Dot Pattern Gradient from Black to White with Bright Center dots. A monochrome halftone dot pattern transitions from solid black on the edges to a bright white center. The dots are evenly spaced and decrease in density as they move towards the illuminated middle, creating a smooth gradient effect
Free with trial A digital illustration depicts a futuristic helmet with a curved silhouette, constructed from multiple transparent glass layers that decrease in size from the top to the bottom, revealing intricate internal details against a dark purple backdrop filled with scattered white star-like dots, where a setting sun casts a warm orange glow along the horizon, creating a dark and mysterious atmosphere. Decrease illustrations Futuristic transparent glass helmet with layered design against a starry purple night sky at sunset. A digital illustration depicts a futuristic helmet with a curved silhouette, constructed from multiple transparent glass layers that decrease in size from the top to the bottom, revealing intricate internal details against a dark purple backdrop filled with scattered white star-like dots, where a setting sun casts a warm orange glow along the horizon, creating a dark and mysterious atmosphere
Free with trial A simple and clear illustration depicting a downward trend. The image features a bar graph with decreasing values, indicated by bars of different heights. A prominent red arrow points downwards, visually emphasizing the negative trend. This graphic is suitable for representing financial losses, declining sales, economic downturns, or any concept of decrease. The clean design and use of color make it easily understandable and versatile for various applications. Decrease vectors Downward Trend Chart with Red Arrow. A simple and clear illustration depicting a downward trend. The image features a bar graph with decreasing values, indicated by bars of different heights. A prominent red arrow points downwards, visually emphasizing the negative trend. This graphic is suitable for representing financial losses, declining sales, economic downturns, or any concept of decrease. The clean design and use of color make it easily understandable and versatile for various applications.
Free with trial A bright red arrow points diagonally downwards against a clean white background. The arrow is rendered with a slight 3D effect, casting a soft shadow beneath it, suggesting depth and movement. This universally recognized symbol represents decline, decrease, or a negative trend, making it ideal for financial, business, or data-related concepts. Decrease illustrations Red Downward Arrow Symbol. A bright red arrow points diagonally downwards against a clean white background. The arrow is rendered with a slight 3D effect, casting a soft shadow beneath it, suggesting depth and movement. This universally recognized symbol represents decline, decrease, or a negative trend, making it ideal for financial, business, or data-related concepts.
Free with trial Red arrow indicating percent decrease sales reduction important finance concept. Decrease illustrations Percentage reduction symbol arrow pointing down. Red arrow indicating percent decrease sales reduction important finance concept
Free with trial Concept of red arrow 8k digital technology against blurry background. Illustration for business decrease, loss, and failure with electronic circuit motherboard design. Decrease illustrations Abstract red arrow 8k digital technology concept. Concept of red arrow 8k digital technology against blurry background. Illustration for business decrease, loss, and failure with electronic circuit motherboard design
Free with trial A diverse collection of downward-pointing arrow icons, presented in various styles including solid, outline, geometric, and minimalist designs. These black and white vector graphics are isolated on a clean white background, offering versatility for numerous design projects. Ideal for indicating download, scroll, navigation, or decrease actions in websites, mobile applications, presentations, and infographics. This set provides essential UI UX elements for designers and developers. Decrease vectors Diverse Down Arrow Icons Set for UI and Web Design. A diverse collection of downward-pointing arrow icons, presented in various styles including solid, outline, geometric, and minimalist designs. These black and white vector graphics are isolated on a clean white background, offering versatility for numerous design projects. Ideal for indicating download, scroll, navigation, or decrease actions in websites, mobile applications, presentations, and infographics. This set provides essential UI UX elements for designers and developers.
Free with trial Illustration of a growing mobile application usage with a simple phone screen displaying a rising graph, a stylized touch hand, and a stream of download arrows. Vector flat icon design on a white background for a user adoption illustration --chaos 30 --ar 16:9 --v 7 Job ID: 938d3d73-bd25-4740-98fd-21a43555bec1. Decrease illustrations Smartphone showing declining graph with arrows pointing down, concept of financial loss, data decrease. Illustration of a growing mobile application usage with a simple phone screen displaying a rising graph, a stylized touch hand, and a stream of download arrows. Vector flat icon design on a white background for a user adoption illustration --chaos 30 --ar 16:9 --v 7 Job ID: 938d3d73-bd25-4740-98fd-21a43555bec1
Free with trial A stack of gold coins and bars sit on top of a chart with a downward trend. The chart shows a decrease in value, while the gold coins and bars remain valuable. Decrease illustrations A stack of gold coins and bars sit on top of a chart with a downward trend
Free with trial Candlestick chart displaying financial data trends with red and green bars on a white background. Each candlestick represents price movement over a specific time period, reflecting opening, closing, high, and low prices. Green candles indicate a price increase, while red ones signify a decrease. Vertical lines, or wicks, extend above and below the body of the candle, showing price extremes. This visualization is commonly used in financial markets to analyze stock prices and trends. Decrease illustrations Candlestick chart displaying financial data trends with red and green bars on a
Free with trial Revenue flowing sales graph illustration growth metrics, visualization forecast, increase decrease revenue flowing sales graph. Decrease illustrations Revenue flowing sales graph
Free with trial Analysis growing loss graph illustration data visualization, metrics performance, decrease increase analysis growing loss graph. Decrease illustrations Analysis growing loss graph
Free with trial A bold, glossy green arrow is depicted pointing directly downwards. The arrow has a smooth, reflective surface and is presented in a studio shot against a clean white background, making it isolated. Its clear directional cue makes it suitable for representing concepts of decline, decrease, or downward movement. Decrease illustrations A large, glossy green arrow pointing downwards on a white background direction. A bold, glossy green arrow is depicted pointing directly downwards. The arrow has a smooth, reflective surface and is presented in a studio shot against a clean white background, making it isolated. Its clear directional cue makes it suitable for representing concepts of decline, decrease, or downward movement
Free with trial Concentric neon rings in various colors, including blue, green, pink, orange, and purple, are set against a dark background. Each ring glows brightly, creating a vibrant, hypnotic pattern that appears to pulse with energy. The rings decrease in size as they approach the center, enhancing a tunnel-like effect. The image exudes a futuristic and dynamic aesthetic, often associated with digital or virtual environments. Decrease illustrations Concentric neon rings in various colors, including blue, green, pink, orange, and
Free with trial A graphic representation of a signal strength meter with decreasing bars and a negative symbol. This visualization suggests a drop in connectivity during evening activities. Decrease vectors Signal strength indicator showing a decrease in connectivity status during late evening hours. A graphic representation of a signal strength meter with decreasing bars and a negative symbol. This visualization suggests a drop in connectivity during evening activities.
Free with trial Gold coins with arrows and graphs pointing up or down. Financial growth. Market decline. Crisis and recession. Statistics chart. Finance success. Increase or decrease cash infographic. Vector concept. Decrease vectors Gold coins with arrows and graphs pointing up or down. Financial growth. Market decline. Crisis and recession. Statistics chart
Free with trial A flat design icon of a wifi signal is depicted against a stark white background. The icon consists of three curved blue arcs radiating outwards from a central blue circle. The arcs decrease in thickness and length as they move away from the center, creating a visual representation of a wireless signal. Decrease vectors Blue wifi signal icon on white background wireless. A flat design icon of a wifi signal is depicted against a stark white background. The icon consists of three curved blue arcs radiating outwards from a central blue circle. The arcs decrease in thickness and length as they move away from the center, creating a visual representation of a wireless signal
Free with trial Connected cube network in blockchain style, sales decrease arrow, and analytics report. Ideal for blockchain, cryptocurrency, sales, technology, analytics, business data-driven decision-making. Decrease illustrations Blockchain Network with Sales Decline and Analytics Representation. Connected cube network in blockchain style, sales decrease arrow, and analytics report. Ideal for blockchain, cryptocurrency, sales, technology, analytics, business data-driven decision-making
Free with trial This image visually represents the concept of debt reduction. Stacks of gold coins are shown in a downward trajectory, symbolizing financial decline or the diminishing of debt. A prominent red arrow, pointing downwards, reinforces this idea of decrease and loss. The clean, dark background and sharp focus on the coins and arrow create a professional and impactful visual for financial planning, economic trends, or debt management themes. Decrease vectors Debt Reduction Concept: Falling Coins and Red Arrow. This image visually represents the concept of debt reduction. Stacks of gold coins are shown in a downward trajectory, symbolizing financial decline or the diminishing of debt. A prominent red arrow, pointing downwards, reinforces this idea of decrease and loss. The clean, dark background and sharp focus on the coins and arrow create a professional and impactful visual for financial planning, economic trends, or debt management themes.
Free with trial A sharp, faceted blue crystal arrow is depicted pointing diagonally downwards on a clean white background. The arrow exhibits reflective surfaces and sharp edges, giving it a modern and sleek appearance. This graphic element symbolizes decline, decrease, or a downward trend. Decrease illustrations Blue Crystal Arrow Pointing Downward on a White Background direction decline. A sharp, faceted blue crystal arrow is depicted pointing diagonally downwards on a clean white background. The arrow exhibits reflective surfaces and sharp edges, giving it a modern and sleek appearance. This graphic element symbolizes decline, decrease, or a downward trend
Free with trial A sharp, blue glass arrow is depicted pointing directly downwards against a stark white background. The arrow is rendered in 3D, showcasing its glossy, reflective surface and faceted edges. The bright blue color and the downward direction suggest concepts of decrease, loss, or a negative trend. The object is isolated, highlighting its form and material. Decrease illustrations 3D Rendered Blue Glass Arrow Pointing Downward on White Background direction. A sharp, blue glass arrow is depicted pointing directly downwards against a stark white background. The arrow is rendered in 3D, showcasing its glossy, reflective surface and faceted edges. The bright blue color and the downward direction suggest concepts of decrease, loss, or a negative trend. The object is isolated, highlighting its form and material
Free with trial A gradient halftone pattern transitioning from black to white. The image features evenly spaced horizontal lines composed of small, elliptical dots. The dots gradually decrease in size and density from the left side of the image to the right, creating a smooth gradient effect. This design is commonly used in graphic design and printing to create shading and tonal effects using limited color palettes. Decrease vectors Halftone graphic vector. A gradient halftone pattern transitioning from black to white. The image features evenly spaced horizontal lines composed of small, elliptical dots. The dots gradually decrease in size and density from the left side of the image to the right, creating a smooth gradient effect. This design is commonly used in graphic design and printing to create shading and tonal effects using limited color palettes.
Free with trial Flat graphic of a dollar coin with a red downward arrow illustrating falling prices, reduced value, financial loss and market decline, ideal for business, finance, economy and investment concepts. Decrease vectors Dollar Coin With Red Down Arrow Symbolizing Falling Price, Decrease In Value And Financial Loss. Flat graphic of a dollar coin with a red downward arrow illustrating falling prices, reduced value, financial loss and market decline, ideal for business, finance, economy and investment concepts.
Free with trial Man cuts gold dollar coin with knife. Income reduction. Economic crisis. Financial recession. Money inflation. Cash piece. Currency capital divide. Finance crisis. Expense decrease. Vector concept. Decrease vectors Man cuts gold dollar coin with knife. Income reduction. Economic crisis. Financial recession. Money inflation. Currency capital. Man cuts gold dollar coin with knife. Income reduction. Economic crisis. Financial recession. Money inflation. Cash piece. Currency capital divide. Finance crisis. Expense decrease. Vector concept
Free with trial A simple and effective line graph illustrating the concept of debt reduction. The chart, on a clean white background, shows a green line trending downwards, representing a successful decrease in liabilities over time. A final red arrow emphasizes a significant or accelerated drop, symbolizing a successful financial strategy, cost-cutting, or achieving financial freedom. This vector illustration is perfect for presentations, articles, and infographics on personal or business finance, money management, and economic stability. Decrease vectors Debt Reduction Concept Graph Showing Downward Trend. A simple and effective line graph illustrating the concept of debt reduction. The chart, on a clean white background, shows a green line trending downwards, representing a successful decrease in liabilities over time. A final red arrow emphasizes a significant or accelerated drop, symbolizing a successful financial strategy, cost-cutting, or achieving financial freedom. This vector illustration is perfect for presentations, articles, and infographics on personal or business finance, money management, and economic stability.
Free with trial The image depicts a series of green bars representing data points, with a prominent red downward arrow indicating a decline in performance or values over time. The bars decrease in height from left to right, emphasizing a downward trend. Decrease illustrations Decline in performance indicated by downward trend. The image depicts a series of green bars representing data points, with a prominent red downward arrow indicating a decline in performance or values over time. The bars decrease in height from left to right, emphasizing a downward trend
Free with trial A 3D render of a red thermometer with a white scale and a blue square icon featuring a white downward-pointing arrow. The thermometer shows a low temperature reading, and the down arrow suggests a decrease or lowering. Both elements are isolated on a clean white background, suitable for digital interfaces and conceptual graphics. Decrease illustrations Red Thermometer and Blue Down Arrow Icon on White Background temperature cold. A 3D render of a red thermometer with a white scale and a blue square icon featuring a white downward-pointing arrow. The thermometer shows a low temperature reading, and the down arrow suggests a decrease or lowering. Both elements are isolated on a clean white background, suitable for digital interfaces and conceptual graphics
Free with trial Gear mechanism with people icons falling beneath a large down arrow, illustrating decrease in metrics, performance decline, workflow reduction and lowered efficiency in business or system settings. Decrease vectors Gear mechanism indicating reducing downward process. Gear mechanism with people icons falling beneath a large down arrow, illustrating decrease in metrics, performance decline, workflow reduction and lowered efficiency in business or system settings
Free with trial Concentric circles in a metallic gold finish create a striking pattern against a dark background. The circles decrease in size as they converge towards the center, giving a sense of depth and perspective. The gold material has a reflective quality, adding dimension and visual interest to the design. The overall effect is both geometric and elegant, suitable for decorative or artistic uses. Decrease illustrations Concentric circles in a metallic gold finish create a striking pattern against a dark
Free with trial A bold green arrow pointing downwards, symbolizing direction, download, or a decrease, presented as a clean and distinct graphic element on a white background. Decrease illustrations Green downward arrow symbol. A bold green arrow pointing downwards, symbolizing direction, download, or a decrease, presented as a clean and distinct graphic element on a white background
Free with trial A conceptual vector illustration depicting the currency exchange rate between the US Dollar (USD) and the Euro (EUR). The green dollar sign is shown with an upward-pointing arrow and a rising trend line, symbolizing an increase in its value. Conversely, the red Euro sign is accompanied by a downward-pointing arrow and a falling trend line, indicating a decrease in its value. A red checkmark sits between them, emphasizing the shift. This graphic effectively visualizes market fluctuations, forex trading, economic trends, and international finance, suitable for financial news, reports, and presentations. Decrease vectors USD EUR Currency Exchange Rate Trend and Fluctuation. A conceptual vector illustration depicting the currency exchange rate between the US Dollar (USD) and the Euro (EUR). The green dollar sign is shown with an upward-pointing arrow and a rising trend line, symbolizing an increase in its value. Conversely, the red Euro sign is accompanied by a downward-pointing arrow and a falling trend line, indicating a decrease in its value. A red checkmark sits between them, emphasizing the shift. This graphic effectively visualizes market fluctuations, forex trading, economic trends, and international finance, suitable for financial news, reports, and presentations.
Free with trial Temperature melting line graph illustration data trend, analysis visualization, ice decrease temperature melting line graph. Decrease illustrations Temperature melting line graph
Free with trial Analysis stretching line graph illustration chvisualization axis, points curve, increase decrease analysis stretching line graph. Decrease illustrations Analysis stretching line graph
Free with trial Design red down arrow illustration symbol direction, pointer navigation, indicator decrease design red down arrow. Decrease illustrations Design red down arrow
Free with trial A series of black triangle shapes gradually increasing and then decreasing in size, arranged horizontally on a white background. Decrease illustrations Gradual increase and decrease of triangle shapes in a horizontal line on white background. A series of black triangle shapes gradually increasing and then decreasing in size, arranged horizontally on a white background
Free with trial A striking red 3D arrow is constructed from a series of connected cubes that gradually decrease in size as they form the arrow's shaft. The arrow points downwards and to the right, suggesting a trend or decline. The entire object is rendered in sharp detail against a clean white background. Decrease illustrations Red 3D Arrow Composed of Cubes Progressing Downward on White Background blocks. A striking red 3D arrow is constructed from a series of connected cubes that gradually decrease in size as they form the arrow's shaft. The arrow points downwards and to the right, suggesting a trend or decline. The entire object is rendered in sharp detail against a clean white background
Free with trial This image displays a stock market chart that shows the daily price fluctuations of a particular stock over a period from January 1 to February 1. The chart includes green and red candlesticks representing price movements, with green indicating an increase and red indicating a decrease. The y-axis represents the stock price ranging from 5000 to 12000, while the x-axis shows the timeline. The chart. Decrease illustrations Stock market chart showing daily price fluctuations. This image displays a stock market chart that shows the daily price fluctuations of a particular stock over a period from January 1 to February 1. The chart includes green and red candlesticks representing price movements, with green indicating an increase and red indicating a decrease. The y-axis represents the stock price ranging from 5000 to 12000, while the x-axis shows the timeline. The chart