Free with trial A circular pattern of gray dots that gradually decrease in size and density from the center outwards, set against a clean white background. Decrease illustrations Halftone Dot Pattern Circle on White Background dots. A circular pattern of gray dots that gradually decrease in size and density from the center outwards, set against a clean white background
Free with trial Three red arrows, each featuring a white percentage sign, are depicted pointing downwards against a neutral grey background. The arrows are arranged in a staggered formation, suggesting a trend or movement. This visual metaphor strongly represents concepts such as financial loss, economic downturn, price reduction, or a decrease in value. The stark contrast between the red arrows and the white. Decrease illustrations Red arrows pointing down with percentage signs symbolizing financial decline. Three red arrows, each featuring a white percentage sign, are depicted pointing downwards against a neutral grey background. The arrows are arranged in a staggered formation, suggesting a trend or movement. This visual metaphor strongly represents concepts such as financial loss, economic downturn, price reduction, or a decrease in value. The stark contrast between the red arrows and the white
Free with trial The image features three identical green arrows pointing downward. Each arrow has a white percentage symbol at its tip. The arrows are placed side by side, creating a uniform and repetitive visual pattern against a plain white background. The simplicity of the design emphasizes the downward direction and the percentage symbols, possibly indicating a decrease or reduction. Decrease illustrations Three green downward pointing arrows with percentage symbols. The image features three identical green arrows pointing downward. Each arrow has a white percentage symbol at its tip. The arrows are placed side by side, creating a uniform and repetitive visual pattern against a plain white background. The simplicity of the design emphasizes the downward direction and the percentage symbols, possibly indicating a decrease or reduction
Free with trial A 3D rendering of a bar chart featuring three colorful columns: blue, orange, and green, increasing in height from left to right. Two prominent red downward arrows are positioned above the tallest green bar, clearly indicating a decline, decrease, or negative trend. The minimalist design on a clean white background makes it ideal for illustrating business performance, financial reports, economic downturns, sales drops, or any data visualization requiring a clear representation of a negative change or warning. Perfect for presentations, infographics, and analytical content. Decrease vectors 3D Bar Chart with Red Downward Arrows Showing Decline. A 3D rendering of a bar chart featuring three colorful columns: blue, orange, and green, increasing in height from left to right. Two prominent red downward arrows are positioned above the tallest green bar, clearly indicating a decline, decrease, or negative trend. The minimalist design on a clean white background makes it ideal for illustrating business performance, financial reports, economic downturns, sales drops, or any data visualization requiring a clear representation of a negative change or warning. Perfect for presentations, infographics, and analytical content.
Free with trial Trend disintegrating line graph illustration dec decrease, fall analysis, visualization statistics trend disintegrating line graph. Decrease illustrations Trend disintegrating line graph
Free with trial A 3D bar chart rendered in a vibrant pink color illustrates a downward trend. The bars decrease in height from left to right, representing a decline in data or performance. A thick pink arrow with a sharp point follows the descending path of the bars, reinforcing the concept of a decrease. The chart is presented in isolation against a clean white background, making the visual elements stand out. Decrease illustrations Pink Bar Chart with a Downward Trending Arrow Symbolizing Decline graph magenta. A 3D bar chart rendered in a vibrant pink color illustrates a downward trend. The bars decrease in height from left to right, representing a decline in data or performance. A thick pink arrow with a sharp point follows the descending path of the bars, reinforcing the concept of a decrease. The chart is presented in isolation against a clean white background, making the visual elements stand out
Free with trial Gear mechanism showing a large downward arrow surrounded by smaller blue figures, illustrating a concept of decline, decrease, or negative trend within a system or process. Decrease vectors Economic downfall concept with downward arrow in gear. Gear mechanism showing a large downward arrow surrounded by smaller blue figures, illustrating a concept of decline, decrease, or negative trend within a system or process
Free with trial Concentric circles of warm yellow light create a tunnel-like effect, drawing the eye toward the center. The rings decrease in size as they approach the middle, giving a sense of depth and infinity. The glowing circles against the dark background create a strong contrast, emphasizing the illusion of a light tunnel. The pattern is symmetrical and harmonious, offering a mesmerizing visual experience. Decrease illustrations Concentric circles of warm yellow light create a tunnel-like effect, drawing the eye
Free with trial A 3D rendered image displays a blue thermometer with a white stripe, indicating a low temperature, positioned next to an orange square icon featuring a white downward-pointing arrow. Both elements are isolated on a white background, suggesting a digital interface or a set of icons representing temperature decrease or a warning. Decrease illustrations Blue Thermometer Icon and Orange Arrow Down Icon on White Background temperature cold. A 3D rendered image displays a blue thermometer with a white stripe, indicating a low temperature, positioned next to an orange square icon featuring a white downward-pointing arrow. Both elements are isolated on a white background, suggesting a digital interface or a set of icons representing temperature decrease or a warning
Free with trial The image depicts a red arrow pointing downward, symbolizing a decline or decrease. The arrow is rendered in a 3D style, emphasizing the direction of movement. The background is plain white, which highlights the arrow and its downward trajectory. Decrease illustrations Red arrow pointing downward
Free with trial This abstract financial graph visually represents a significant economic downturn or market decline. A prominent, bold red arrow sharply points downwards across a blue grid background, symbolizing loss, recession, or a negative trend. A lighter blue fluctuating line also shows a general downward trajectory, indicating market volatility or a secondary metric. This impactful illustration is ideal for conveying concepts of financial crisis, business failure, falling stock prices, or any situation involving a sharp decrease and poor performance. Decrease vectors Economic Downturn Graph with Red Arrow Showing Decline. This abstract financial graph visually represents a significant economic downturn or market decline. A prominent, bold red arrow sharply points downwards across a blue grid background, symbolizing loss, recession, or a negative trend. A lighter blue fluctuating line also shows a general downward trajectory, indicating market volatility or a secondary metric. This impactful illustration is ideal for conveying concepts of financial crisis, business failure, falling stock prices, or any situation involving a sharp decrease and poor performance.
Free with trial This image features a collection of volume control icons, including mute, unmute, volume increase, volume decrease, and various volume levels. The icons are isolated on a transparent background, making it suitable for use in various digital and print media. The image is SEO-friendly and optimized for web use. Decrease illustrations Volume control icons set isolated on white background. This image features a collection of volume control icons, including mute, unmute, volume increase, volume decrease, and various volume levels. The icons are isolated on a transparent background, making it suitable for use in various digital and print media. The image is SEO-friendly and optimized for web use
Free with trial A bright red 3d arrow pointing downwards, symbolizing a decrease or decline, often used in financial contexts. Decrease vectors Red downward arrow indicates economic decline. A bright red 3d arrow pointing downwards, symbolizing a decrease or decline, often used in financial contexts.
Free with trial Torn leather wallet from which gold coins fall out. Losing money. Breach in finances. Economy crisis and inflation. Currency lost. Deposit decrease. Investment failure. Financial scam. Vector concept. Decrease vectors Torn leather wallet from which gold coins fall out. Losing money. Breach in finances. Economy crisis and inflation. Currency lost
Free with trial This image features a bar graph with a downward trend, indicated by a red arrow. The bars are colored in various shades of blue and decrease in height from left to right. The image has a transparent background, making it suitable for various design applications. Keywords: bar graph, downward trend, blue bars, red arrow, white background, transparent background. Decrease illustrations Decreasing bar graph icon isolated on white background. This image features a bar graph with a downward trend, indicated by a red arrow. The bars are colored in various shades of blue and decrease in height from left to right. The image has a transparent background, making it suitable for various design applications. Keywords: bar graph, downward trend, blue bars, red arrow, white background, transparent background
Free with trial A versatile vector illustration of a green volume control icon, indicating both increase and decrease sound. This graphic is perfect for user interfaces, audio mixers, media players, or interactive applications. Its dynamic design provides clear visual feedback for sound adjustment, vector design Generative AI. Decrease vectors Green Volume Up Down Sound Icon, vector design Generative AI. A versatile vector illustration of a green volume control icon, indicating both increase and decrease sound. This graphic is perfect for user interfaces, audio mixers, media players, or interactive applications. Its dynamic design provides clear visual feedback for sound adjustment, vector design Generative AI
Free with trial A vivid red zigzag arrow pointing downward against a plain gray backdrop, symbolizing a decline or decrease. Decrease illustrations Red zigzag arrow pointing downwards on gray background. A vivid red zigzag arrow pointing downward against a plain gray backdrop, symbolizing a decline or decrease
Free with trial A bold, three-dimensional red arrow depicted in a downward curve, signifying a negative trend, decline, or decrease, isolated against a clean white background for clear visual emphasis. Decrease illustrations Red arrow curving downwards isolated on white background. A bold, three-dimensional red arrow depicted in a downward curve, signifying a negative trend, decline, or decrease, isolated against a clean white background for clear visual emphasis
Free with trial A three-dimensional bar graph composed of translucent blue bars illustrates a significant downward trend. The bars decrease in height from left to right, and a large, transparent blue arrow points downwards, reinforcing the concept of decline. The graph is set against a gradient blue background, creating a sense of depth and focus on the data visualization. Decrease illustrations A3D Rendered Blue Bar Graph Showing a Downward Trend with a Falling Arrow chart data. A three-dimensional bar graph composed of translucent blue bars illustrates a significant downward trend. The bars decrease in height from left to right, and a large, transparent blue arrow points downwards, reinforcing the concept of decline. The graph is set against a gradient blue background, creating a sense of depth and focus on the data visualization
Free with trial Simple outline icon of hand offering money and downward arrow. Represents decrease, loss, recession, and financial challenge. Decrease vectors Outline Simple Hand Offering Money Down Arrow Icon Symbol. Simple outline icon of hand offering money and downward arrow. Represents decrease, loss, recession, and financial challenge.
Free with trial Four smooth, black stones of varying sizes are arranged in a vertical line on a white surface. The stones are polished with a uniformly glossy texture and rounded contours. They decrease in size from the foreground to the background, creating a sense of depth and perspective. This arrangement is often used for meditation or relaxation purposes, symbolizing balance and tranquility. Decrease illustrations They decrease in size from the foreground to the background
Free with trial Conceptual line art depicting a decrease in gold prices. Decrease illustrations Gold Price Drop Magnifying Glass Showing Decreasing Value. Conceptual line art depicting a decrease in gold prices.
Free with trial An illustration featuring two contrasting arrows against a plain white background. The red arrow shows a wavy upward trend, symbolizing growth, increase, or positive performance with fluctuation. The black arrow shows a wavy downward trend, symbolizing decline, decrease, or negative performance with fluctuation. This visual concept is often used to represent financial market volatility, business. Decrease vectors Dynamic business trends illustrated by contrasting red upward and black downward arrows Vector. An illustration featuring two contrasting arrows against a plain white background. The red arrow shows a wavy upward trend, symbolizing growth, increase, or positive performance with fluctuation. The black arrow shows a wavy downward trend, symbolizing decline, decrease, or negative performance with fluctuation. This visual concept is often used to represent financial market volatility, business
Free with trial The image depicts a graph with a prominent downward trend. The graph features a thick black line sloping downwards from left to right, indicating a decline. Alongside this line, there are several vertical bars representing data points. The bars vary in height, with some being taller and others shorter, suggesting fluctuations in the data. The overall visual representation suggests a decrease in. Decrease vectors Graph displaying downward trend with multiple data points. The image depicts a graph with a prominent downward trend. The graph features a thick black line sloping downwards from left to right, indicating a decline. Alongside this line, there are several vertical bars representing data points. The bars vary in height, with some being taller and others shorter, suggesting fluctuations in the data. The overall visual representation suggests a decrease in
Free with trial Set line Employee dismissal, Money bag, Pie chart infographic and Dollar rate decrease icon. Vector. Decrease illustrations Set line Employee dismissal, Money bag, Pie chart infographic and Dollar rate decrease icon. Vector
Free with trial This image showcases a diverse collection of downward-pointing arrows, presented in a clean, graphic style against a white background. The arrows are arranged in three rows and six columns, featuring both solid black and outline designs. Variations include standard arrow shapes, rounded tops, and arrows enclosed in boxes or with unique arrowhead designs. This versatile set is ideal for representing concepts like download, decrease, decline, navigation, or direction in digital interfaces, presentations, and infographics. Decrease vectors Collection of Downward Arrows in Various Styles. This image showcases a diverse collection of downward-pointing arrows, presented in a clean, graphic style against a white background. The arrows are arranged in three rows and six columns, featuring both solid black and outline designs. Variations include standard arrow shapes, rounded tops, and arrows enclosed in boxes or with unique arrowhead designs. This versatile set is ideal for representing concepts like download, decrease, decline, navigation, or direction in digital interfaces, presentations, and infographics.
Free with trial A 3D illustration of a red arrow pointing downward on a graph, indicating a decline or negative trend in business, finance, or economy. The image represents a decrease or loss in value, and can be used to symbolize a crisis, recession, or failure. Decrease illustrations A red arrow pointing downward on a graph indicating a decline. A 3D illustration of a red arrow pointing downward on a graph, indicating a decline or negative trend in business, finance, or economy. The image represents a decrease or loss in value, and can be used to symbolize a crisis, recession, or failure.
Free with trial Water level icon. Water depth icon vector. Water level up, down icon sign vector. Water level increase, decrease icon sign vector. Decrease vectors Water level icon. Water depth icon vector. Water level up, down icon sign vector. Water level increase, decrease icon sign vector
Free with trial Trend melting line graph illustration analysis visualization, ice decrease, plot statistics trend melting line graph. Decrease illustrations Trend melting line graph
Free with trial Set of alpha transparent business and finance icons drawn in white chalk, illustrating net asset value rising and falling alongside a market chart and Indian currency notation. Decrease vectors Sketch of mutual fund NAV increase and decrease icons with Indian rupee symbol alpha transparent. Set of alpha transparent business and finance icons drawn in white chalk, illustrating net asset value rising and falling alongside a market chart and Indian currency notation.
Free with trial Two bold, three-dimensional red arrows are positioned vertically side-by-side against a clean white background. The left arrow points upwards, signifying increase, progress, or ascent. The right arrow points downwards, representing decrease, decline, or descent. Their contrasting directions and vibrant color make them a strong visual metaphor for opposing forces, change, or directional choices. Decrease illustrations Red Up and Down Arrows Symbolizing Direction and Contrast on White Background image photo. Two bold, three-dimensional red arrows are positioned vertically side-by-side against a clean white background. The left arrow points upwards, signifying increase, progress, or ascent. The right arrow points downwards, representing decrease, decline, or descent. Their contrasting directions and vibrant color make them a strong visual metaphor for opposing forces, change, or directional choices
Free with trial A hand-drawn bar chart shows a downward trend with a line graph indicating a significant decrease in value over time. Decrease vectors Downturn graph illustrating declining trends and financial loss. A hand-drawn bar chart shows a downward trend with a line graph indicating a significant decrease in value over time
Free with trial A vivid red downward pointing arrow on a plain white background, symbolizing decline or decrease. Decrease illustrations Illustration of a red downward pointing arrow. A vivid red downward pointing arrow on a plain white background, symbolizing decline or decrease
Free with trial A simple yet impactful vector icon of a downward-pointing arrow, symbolizing a negative trend, decline, or decrease. This design is ideal for financial reports, economic indicators, market analysis, or any data visualization requiring a clear representation of reduction or downturns, vector design Generative AI. Decrease vectors Downward Trend Arrow, Market Decline, vector design Generative AI. A simple yet impactful vector icon of a downward-pointing arrow, symbolizing a negative trend, decline, or decrease. This design is ideal for financial reports, economic indicators, market analysis, or any data visualization requiring a clear representation of reduction or downturns, vector design Generative AI
Free with trial Neon light installation featuring a series of heart-shaped outlines in gradient colors ranging from pink to blue. These outlines decrease in size, creating a tunnel-like, hypnotic effect that draws the eye towards the center, where a solid blue heart is positioned. The smooth lines and glowing edges enhance the optical illusion of depth and movement, creating a visually engaging and immersive experience. Decrease illustrations Abstract Glowing Heart. Neon light installation featuring a series of heart-shaped outlines in gradient colors ranging from pink to blue. These outlines decrease in size, creating a tunnel-like, hypnotic effect that draws the eye towards the center, where a solid blue heart is positioned. The smooth lines and glowing edges enhance the optical illusion of depth and movement, creating a visually engaging and immersive experience.
Free with trial A detailed 3D rendering of a metallic silver mechanical gear with a spiral arrangement of teeth, where the largest teeth are positioned at the bottom and gradually decrease in size toward the top, set against a dark blue background that enhances the industrial aesthetic and highlights the intricate grooves and reflective surfaces of the metal component. Decrease illustrations A 3D rendered mechanical gear with spiral teeth pattern in silver metal against a dark blue contrasting background. A detailed 3D rendering of a metallic silver mechanical gear with a spiral arrangement of teeth, where the largest teeth are positioned at the bottom and gradually decrease in size toward the top, set against a dark blue background that enhances the industrial aesthetic and highlights the intricate grooves and reflective surfaces of the metal component
Free with trial Three stacks of gold coins, varying in height, are arranged side by side. Red downward arrows are above the smallest stack on the left, indicating decline, while green upward arrows are above the tallest stack in the center, suggesting growth. The stack on the right is of medium height. The illustration uses a watercolor style to represent financial concepts of increase and decrease. Decrease vectors Financial Growth and Decline Coin Stacks with Up and Down Arrows. Three stacks of gold coins, varying in height, are arranged side by side. Red downward arrows are above the smallest stack on the left, indicating decline, while green upward arrows are above the tallest stack in the center, suggesting growth. The stack on the right is of medium height. The illustration uses a watercolor style to represent financial concepts of increase and decrease.
Free with trial Clean showing 3d icon of a pound sterling symbol with a downward arrow indicating decrease. Decrease illustrations 3D Icon of a Pound Sterling Symbol with a Downward Arrow Indicating Decrease
Free with trial Businessman with decreasing dollar sign representing salary reduction, income loss, and financial decline. Suitable for payroll, HR, and economic downturn concepts. Decrease vectors Salary reduction concept with businessman and falling dollar symbol showing income decrease and pay cut. Businessman with decreasing dollar sign representing. Businessman with decreasing dollar sign representing salary reduction, income loss, and financial decline. Suitable for payroll, HR, and economic downturn concepts
Free with trial A stylized, flat design illustration of a bar chart depicting a downward trend. The bars are colored red, yellow, and blue, arranged in decreasing height from left to right. A prominent red arrow points downwards across the chart, emphasizing the decline. The graphic is set against a clean white background, making it ideal for presentations, reports, and financial concepts related to loss, decrease, or negative performance. Decrease illustrations Declining Bar Chart with Downward Arrow. A stylized, flat design illustration of a bar chart depicting a downward trend. The bars are colored red, yellow, and blue, arranged in decreasing height from left to right. A prominent red arrow points downwards across the chart, emphasizing the decline. The graphic is set against a clean white background, making it ideal for presentations, reports, and financial concepts related to loss, decrease, or negative performance.
Free with trial A pair of three-dimensional arrows, rendered in shades of gray, are presented against a white background. One arrow points upwards, signifying growth or progress, while the other points downwards, indicating decline or a decrease. The arrows are constructed from layered chevron shapes, creating a textured and modern appearance. Decrease illustrations 3D rendering of an upward and downward pointing chevron arrow pair on a white background. A pair of three-dimensional arrows, rendered in shades of gray, are presented against a white background. One arrow points upwards, signifying growth or progress, while the other points downwards, indicating decline or a decrease. The arrows are constructed from layered chevron shapes, creating a textured and modern appearance
Free with trial A clean, minimalist graphic featuring two black circles side-by-side against a white background. The left circle contains a prominent white plus symbol, representing addition, increase, or positive aspects. The right circle displays a white minus symbol, signifying subtraction, decrease, or negative aspects. This versatile image is ideal for illustrating concepts of choice, comparison, opposites, data manipulation, or user interface elements. Decrease illustrations Plus and Minus Symbols in Black Circles. A clean, minimalist graphic featuring two black circles side-by-side against a white background. The left circle contains a prominent white plus symbol, representing addition, increase, or positive aspects. The right circle displays a white minus symbol, signifying subtraction, decrease, or negative aspects. This versatile image is ideal for illustrating concepts of choice, comparison, opposites, data manipulation, or user interface elements.
Free with trial Frosted glass Money on hand icon isolated on white background. Palm holds cash with down. Cash salary decrease. Minimalism concept. 3D render illustration. Decrease illustrations Frosted glass Money on hand icon isolated on white background. Palm holds cash with down. Cash salary decrease
Free with trial A series of concentrically arranged square frames forms a tunnel-like visual. Each frame is made of different materials: the outermost appears as dark stone or textured metal, followed by bronze, and innermost shiny chrome. The frames decrease in size toward a central white light. The dark background enhances the metallic sheen, creating a futuristic or industrial aesthetic, reminiscent of a conceptual art piece or a depiction of a tunnel with varied textures. Decrease illustrations A series of concentrically arranged square frames forms a tunnel-like visual. Each
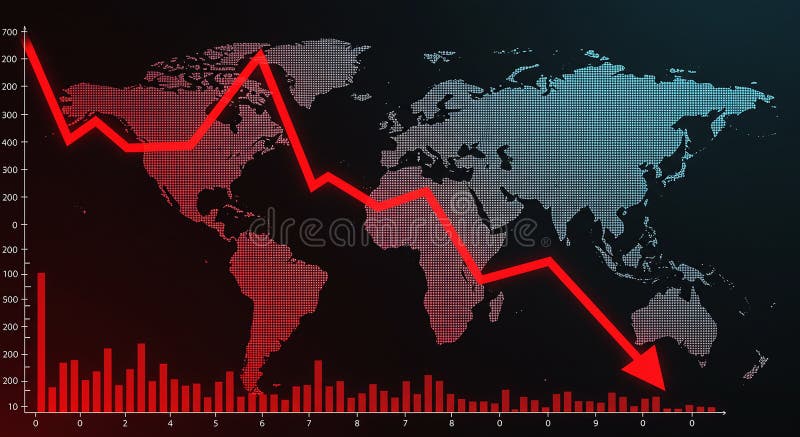
Free with trial World map with a red declining line graph overlay, illustrating a decrease or economic downturn. The graph features sharp declines across various data points, reflecting a downward trend. Red bar chart at the bottom represents additional numerical data against a black background. The map uses a dotted pattern for continents, highlighting regions globally. The image conveys financial analysis, market trends, or economic statistics. Decrease illustrations World map with a red declining line graph overlay
Free with trial This image features two circular icons isolated on a white background. The left icon is green with an upward arrow and a dollar sign, symbolizing an increase. The right icon is red with a downward arrow and a dollar sign, indicating a decrease. The image is simple and visually clear, making it suitable for financial or economic contexts. Decrease illustrations Green up arrow and red down arrow icons isolated on white background. This image features two circular icons isolated on a white background. The left icon is green with an upward arrow and a dollar sign, symbolizing an increase. The right icon is red with a downward arrow and a dollar sign, indicating a decrease. The image is simple and visually clear, making it suitable for financial or economic contexts
Free with trial A vibrant, pixelated pink arrow points downwards, set against a dark, textured background with subtle horizontal grey lines. This retro 8-bit style graphic symbolizes decrease, decline, download, or a negative trend. Ideal for illustrating financial data, market downturns, digital alerts, gaming interfaces, or any concept requiring a clear downward direction indicator. Its bold color and distinct pixel art aesthetic make it a versatile design element for technology, business, or creative projects. Decrease illustrations Pixel Art Down Arrow on Dark Background. A vibrant, pixelated pink arrow points downwards, set against a dark, textured background with subtle horizontal grey lines. This retro 8-bit style graphic symbolizes decrease, decline, download, or a negative trend. Ideal for illustrating financial data, market downturns, digital alerts, gaming interfaces, or any concept requiring a clear downward direction indicator. Its bold color and distinct pixel art aesthetic make it a versatile design element for technology, business, or creative projects.
Free with trial The image features a green up arrow and a red down arrow, each with a percentage symbol inside. The arrows are isolated on a white background with a transparent backdrop. The green up arrow signifies an increase, while the red down arrow signifies a decrease. Decrease illustrations Green up arrow and red down arrow icons isolated on white background. The image features a green up arrow and a red down arrow, each with a percentage symbol inside. The arrows are isolated on a white background with a transparent backdrop. The green up arrow signifies an increase, while the red down arrow signifies a decrease
Free with trial Carbon reduction concept with hand holding virtual CO2 decrease icon showing climate action sustainable technology of emission control and environmental responsibility. Decrease illustrations Carbon reduction concept with hand holding virtual CO2 decrease icon showing climate action sustainable technology of emission
Free with trial A businessman presenting a concept of cost increase versus quality decrease with the help of visual arrows This is a good representation of business strategy financial challenges economic downturn and the need for effective resource management It shows a common corporate problem and a call for efficient solutions Focus is on the hand and arrows. Decrease illustrations Business Strategy Showing Increased Cost and Decreased Quality Represented by Hand and Arrows. A businessman presenting a concept of cost increase versus quality decrease with the help of visual arrows This is a good representation of business strategy financial challenges economic downturn and the need for effective resource management It shows a common corporate problem and a call for efficient solutions Focus is on the hand and arrows
Free with trial Negative Above Positive Balance. A striking white decrease symbol sits atop a plus mark on black, reflecting opposing forces, growth, and contrast. Decrease vectors Negative Above Positive Balance. A striking
Free with trial A bold red zigzag arrow points downward, illustrating decline or decrease effectively. Decrease vectors Red zigzag arrow pointing downward on white background. A bold red zigzag arrow points downward, illustrating decline or decrease effectively.
Free with trial A minimalist black outline icon representing volume decrease, featuring a speaker symbol next to a minus sign, isolated on a white background for web and app UI. Decrease vectors Volume down icon simple black line art for user interface design. A minimalist black outline icon representing volume decrease, featuring a speaker symbol next to a minus sign, isolated on a white background for web and app UI
Free with trial A striking 3D rendering illustrates a significant decline in consumer spending or retail sales. The image features a large green shopping bag followed by three progressively smaller white shopping bags, visually representing a reduction. A prominent red arrow, shaped like a downward trend graph, effectively symbolizes a market downturn, economic recession, or decrease in purchasing power. Set against a clean white background, this conceptual image is ideal for financial reports, business presentations, and articles discussing economic challenges, retail struggles, or market analysis. Decrease illustrations Retail Sales Decline and Economic Downturn. A striking 3D rendering illustrates a significant decline in consumer spending or retail sales. The image features a large green shopping bag followed by three progressively smaller white shopping bags, visually representing a reduction. A prominent red arrow, shaped like a downward trend graph, effectively symbolizes a market downturn, economic recession, or decrease in purchasing power. Set against a clean white background, this conceptual image is ideal for financial reports, business presentations, and articles discussing economic challenges, retail struggles, or market analysis.
Free with trial A series of golden, metallic bars are arranged in a descending order, forming a bar chart that clearly illustrates a downward trend. The bars decrease in height from left to right, with the leftmost bar being the tallest and the rightmost bar being the shortest and widest. The reflective golden surface of the bars catches the light, highlighting their three-dimensional form. The chart is presented. Decrease illustrations Golden Bar Chart Showing A Downward Trend On A White Background graph financial. A series of golden, metallic bars are arranged in a descending order, forming a bar chart that clearly illustrates a downward trend. The bars decrease in height from left to right, with the leftmost bar being the tallest and the rightmost bar being the shortest and widest. The reflective golden surface of the bars catches the light, highlighting their three-dimensional form. The chart is presented
Free with trial Decrease showing abstract composition of white 3d geometric shapes representing percentage and plus symbols. Decrease illustrations Abstract Composition of White 3D Geometric Shapes Representing Percentage and Plus Symbols
Free with trial The image shows a red candlestick chart against a white background. the chart displays price movements over time, with each candlestick representing a specific period. the red color indicates a price decrease during that period. two horizontal black lines are drawn across the chart, potentially indicating support or resistance levels. the chart shows an overall upward trend, with periods of both gains and losses. the candlesticks vary in size, reflecting the magnitude of price fluctuations. the background is plain white, providing a clean and uncluttered view of the chart. Decrease illustrations Red candlestick chart on white background. the image shows a red candlestick chart against a white background. the chart displays price movements over time, with each candlestick representing a specific period. the red color indicates a price decrease during that period. two horizontal black lines are drawn across the chart, potentially indicating support or resistance levels. the chart shows an overall upward trend, with periods of both gains and losses. the candlesticks vary in size, reflecting the magnitude of price fluctuations. the background is plain white, providing a clean and uncluttered view of the chart.
Free with trial A hand adjusting wooden blocks with cost letters and a graph showing a decrease in expenses, symbolizing effective financial management and planning. Decrease illustrations Controlling expenses and managing costs with strategic planning. A hand adjusting wooden blocks with cost letters and a graph showing a decrease in expenses, symbolizing effective financial management and planning
Free with trial This image depicts a stack of coins with a downward trending arrow, symbolizing a decrease in cost-effectiveness. Decrease illustrations Illustration of decreasing cost-effectiveness with stacked coins. This image depicts a stack of coins with a downward trending arrow, symbolizing a decrease in cost-effectiveness
Free with trial A thick black arrow pointing downwards at an angle, indicating a decline on a white background. Decrease illustrations Downward trending arrow indicating a sharp decline fall decrease. A thick black arrow pointing downwards at an angle, indicating a decline on a white background
Free with trial A 3D rendered image features two glossy, red arrows in a dynamic, circular arrangement. One arrow points upwards, signifying growth or increase, while the other points downwards, representing decline or decrease. The arrows are highly reflective and are presented against a clean white background, emphasizing their form and the concept of opposing directions or change. Decrease illustrations Glossy Red Arrows Pointing Up and Down in a Circular Motion on a White Background image photo. A 3D rendered image features two glossy, red arrows in a dynamic, circular arrangement. One arrow points upwards, signifying growth or increase, while the other points downwards, representing decline or decrease. The arrows are highly reflective and are presented against a clean white background, emphasizing their form and the concept of opposing directions or change
Free with trial A functional vector illustration of a left pointing triangle with a minus sign, typically used for rewind or volume decrease in media players. This icon is ideal for audio or video editing software, music apps, or digital interfaces requiring media control, vector design Generative AI. Decrease vectors Rewind volume control, audio media player, vector design Generative AI. A functional vector illustration of a left pointing triangle with a minus sign, typically used for rewind or volume decrease in media players. This icon is ideal for audio or video editing software, music apps, or digital interfaces requiring media control, vector design Generative AI
Free with trial A 3D render illustrating a concept of financial decline and economic recession. The image features a red bar chart with progressively shorter bars, indicating a downward trend. A bold, red arrow follows this negative trajectory, pointing sharply downwards. Set against a clean, neutral gray background, this graphic powerfully symbolizes concepts like business failure, stock market crash, investment loss, sales decrease, and economic crisis. It's a perfect visual for presentations, reports, and articles discussing financial downturns, poor performance, and negative growth. Decrease illustrations Financial Decline Graph with Red Arrow Down. A 3D render illustrating a concept of financial decline and economic recession. The image features a red bar chart with progressively shorter bars, indicating a downward trend. A bold, red arrow follows this negative trajectory, pointing sharply downwards. Set against a clean, neutral gray background, this graphic powerfully symbolizes concepts like business failure, stock market crash, investment loss, sales decrease, and economic crisis. It's a perfect visual for presentations, reports, and articles discussing financial downturns, poor performance, and negative growth.
Free with trial A conceptual image depicting low dopamine levels. Wooden letter blocks spell DOPAMINE, accompanied by a sad face and a downward arrow, illustrating a decrease in this crucial neurotransmitter. (AI-Generated Content). Decrease illustrations Dopamine word blocks showing low levels and sad mood health concept. A conceptual image depicting low dopamine levels. Wooden letter blocks spell DOPAMINE, accompanied by a sad face and a downward arrow, illustrating a decrease in this crucial neurotransmitter. (AI-Generated Content)
Free with trial This image features two circular arrows on a white background. The left circle has a green upward arrow with a dollar sign at the bottom, indicating an increase or profit. The right circle has a red downward arrow with a dollar sign at the bottom, indicating a decrease or loss. The image is simple and uses contrasting colors to clearly convey its message. Decrease illustrations Up and down arrows with dollar signs isolated on white background. This image features two circular arrows on a white background. The left circle has a green upward arrow with a dollar sign at the bottom, indicating an increase or profit. The right circle has a red downward arrow with a dollar sign at the bottom, indicating a decrease or loss. The image is simple and uses contrasting colors to clearly convey its message
Free with trial A black downward arrow with a cracked surface, symbolizing decline on a white background. Decrease illustrations Downward Arrow Icon Showing Decline With Cracked Surface decrease. A black downward arrow with a cracked surface, symbolizing decline on a white background
Free with trial Black fair value icon with downward arrow pointing to two horizontal lines. Clear details and vibrant colors e. Decrease illustrations Fair Value Downward Arrow Icon Indicating Decrease In Value image photo. Black fair value icon with downward arrow pointing to two horizontal lines. Clear details and vibrant colors e