Free with trial Hand drawn bar chart sketch with ascending and descending data patterns. Progress decrease vectors Hand drawn bar chart sketch with ascending and descending data patterns, AI Generative. Hand drawn bar chart sketch with ascending and descending data patterns.
Free with trial Square Format Infographic Poster Bold Typography Charts 1 Upscaled 4X clean composition. Featuring square, format, infographic. Neutral, commercial-friendly, with room for copy. Progress decrease illustrations Square Format Infographic Poster Bold Typography Charts 1 Upscaled 4X clean composition
Free with trial A stylized 3D business growth chart depicted against a light blue background. The chart features a blue mountain-like shape representing a peak, with two intersecting lines. One line, marked with pink nodes, shows fluctuations, while another line with green nodes indicates a general upward trend. This visual metaphor conveys concepts of business performance, market trends, and financial analysis. Progress decrease illustrations 3D Stylized Business Growth Chart with Red and Green Nodes on Blue Background graph data. A stylized 3D business growth chart depicted against a light blue background. The chart features a blue mountain-like shape representing a peak, with two intersecting lines. One line, marked with pink nodes, shows fluctuations, while another line with green nodes indicates a general upward trend. This visual metaphor conveys concepts of business performance, market trends, and financial analysis
Free with trial Hand drawn bar graph showing a downward trend with an arrow indicating decline. Progress decrease vectors Hand drawn bar graph showing a downward trend with an arrow indicating decline
Free with trial An illustration of a stylized, downward-pointing arrow zig-zagging across a pale yellow surface. The arrow conveys a sense of decline, loss, or reduction. Simplistic design is suitable for presentations, infographics, or website design needing a visual representation of negative trends. Progress decrease illustrations Downward arrow illustration showing market trend zigzag decline and recession. An illustration of a stylized, downward-pointing arrow zig-zagging across a pale yellow surface. The arrow conveys a sense of decline, loss, or reduction. Simplistic design is suitable for presentations, infographics, or website design needing a visual representation of negative trends
Free with trial Money movement icon. Dollar coin arrows. Financial flow Vector. Market trend symbol. EPS 10. Progress decrease vectors Money movement icon. Dollar coin arrows. Financial flow Vector. Market trend symbol.
Free with trial Modern abstract blue bars illustrating business statistics, trends, and analytics. Progress decrease vectors Digital data analysis bars in blue hues, conceptualizing statistics and trends. Modern abstract blue bars illustrating business statistics, trends, and analytics.
Free with trial Graph going Up and Down sign with green and red arrows vector set. Flat design vector set of a concept of sales bar chart symbol icon with arrow moving down and sales bar chart with arrow moving up. Progress decrease vectors Graph going Up and Down sign with green and red arrows vector set. Vector set of a concept of sales bar chart symbol icon. Graph going Up and Down sign with green and red arrows vector set. Flat design vector set of a concept of sales bar chart symbol icon with arrow moving down and sales bar chart with arrow moving up.
Free with trial Yellow glossy arrow pointing right. Isolated on white background. Direction guide. Close-up. Progress decrease illustrations Yellow glossy arrow pointing right. Isolated on white background. Direction guide
Free with trial A textured golden fifty-seven percent symbol rests on a peach background ideal for illustrating sales, discounts, or financial data. Progress decrease illustrations Golden Fifty-seven Percent Symbol on Peach Background for Sales and Promotions. A textured golden fifty-seven percent symbol rests on a peach background ideal for illustrating sales, discounts, or financial data
Free with trial Business graph data analysis on wooden desk with pencils, bananas and notebooks. Progress decrease illustrations Business graph data analysis on wooden desk with pencils, bananas and notebooks
Free with trial Up and Down sign with green and red arrows set vector illustration. Set of a Concept of sales bar chart symbol icon with arrow moving down and sales bar chart with arrow moving up. Progress decrease vectors Up and Down sign with green and red arrows set vector illustration. Set of a Concept of sales bar chart symbol icon with arrows. Up and Down sign with green and red arrows set vector illustration. Set of a Concept of sales bar chart symbol icon with arrow moving down and sales bar chart with arrow moving up.
Free with trial Graph going Up and Down with red arrows vector. Blue chart bar vector illustration concept of sales bar chart symbol icon with arrow moving down and sales bar chart with arrow moving up. Progress decrease vectors Graph going Up and Down with red arrows vector. Blue chart bar vector illustration concept of sales bar chart symbol icon
Free with trial A 3D rendering of a vibrant red arrow pointing upwards and a bright green arrow pointing downwards, representing market fluctuations, economic changes, and data trends. Progress decrease illustrations Red up arrow and green down arrow symbolizing financial market trends growth decline. A 3D rendering of a vibrant red arrow pointing upwards and a bright green arrow pointing downwards, representing market fluctuations, economic changes, and data trends
Free with trial Trend chart icon set. Growth and decline symbol. Up and down arrow with bar graph illustration. Progress decrease vectors Trend chart icon set. Growth and decline symbol. Up and down arrow with bar graph
Free with trial Battery Charge Cycle Vector Graphic Decreasing Energy Level with Arrow Indicator. Progress decrease vectors Battery Charge Cycle Vector Graphic Decreasing Energy Level with Arrow Indicator
Free with trial Top Position and Promotion Icon Line Style Design Simple Finance and Business Vector Symbol Perfect Illustration. Progress decrease vectors Top Position and Promotion Icon Line Style Design Simple Vector Perfect Illustration. Top Position and Promotion Icon Line Style Design Simple Finance and Business Vector Symbol Perfect Illustration
Free with trial Visualize financial decline with this striking depiction of a report showing falling tax revenue and a clear downward trend, perfect for economic analysis and business strategy content. Progress decrease vectors Business financial report shows declining tax revenue with downward trend arrow. Visualize financial decline with this striking depiction of a report showing falling tax revenue and a clear downward trend, perfect for economic analysis and business strategy content
Free with trial Various customer people giving 5 stars review for quality service. Effort and drive as a person pushes a big gauge toward green. Business superhero looking on top mountain peak using telescope. Progress decrease vectors Customer loyalty. Reduce risk level. Business vision concept to see journey to success. Various customer people giving 5 stars review for quality service. Effort and drive as a person pushes a big gauge toward green. Business superhero looking on top mountain peak using telescope
Free with trial Graph going Up and Down with green and red arrows vector. Blue chart bar vector illustration concept of sales bar chart symbol icon with arrow moving down and sales bar chart with arrow moving up. Progress decrease vectors Graph going Up and Down with green and red arrows vector. Blue chart bar vector illustration concept of sales bar chart symbol. Graph going Up and Down with green and red arrows vector. Blue chart bar vector illustration concept of sales bar chart symbol icon with arrow moving down and sales bar chart with arrow moving up.
Free with trial Colorful bar chart on a blue background illustrating data trends ,Generative ai. Progress decrease illustrations Vibrant bar chart on blue background, visualizing data trends and insights colorful. Colorful bar chart on a blue background illustrating data trends ,Generative ai
Free with trial Downward arrow with decreasing bar graph alongside neutral, happy, and sad emotion faces. Ideal for emotional feedback, metrics, performance, business evaluation, impact loss failure. A simple flat. Progress decrease vectors Decline in Performance Represented by Downward Arrow, Graph Bars, and Varying Emotional Expressions. Downward arrow with decreasing bar graph alongside neutral, happy, and sad emotion faces. Ideal for emotional feedback, metrics, performance, business evaluation, impact loss failure. A simple flat
Free with trial A minimalist 3D bar chart rendered in white against a bright white background. The chart displays four bars of decreasing height, visually representing a sharp downward trend. A prominent white arrow, also pointing downwards, overlays the bars, emphasizing the decline. The composition is clean and abstract, suitable for representing financial or economic downturns. Progress decrease illustrations White 3D Bar Chart Showing a Sharp Downward Trend with Arrow on White Background graph. A minimalist 3D bar chart rendered in white against a bright white background. The chart displays four bars of decreasing height, visually representing a sharp downward trend. A prominent white arrow, also pointing downwards, overlays the bars, emphasizing the decline. The composition is clean and abstract, suitable for representing financial or economic downturns
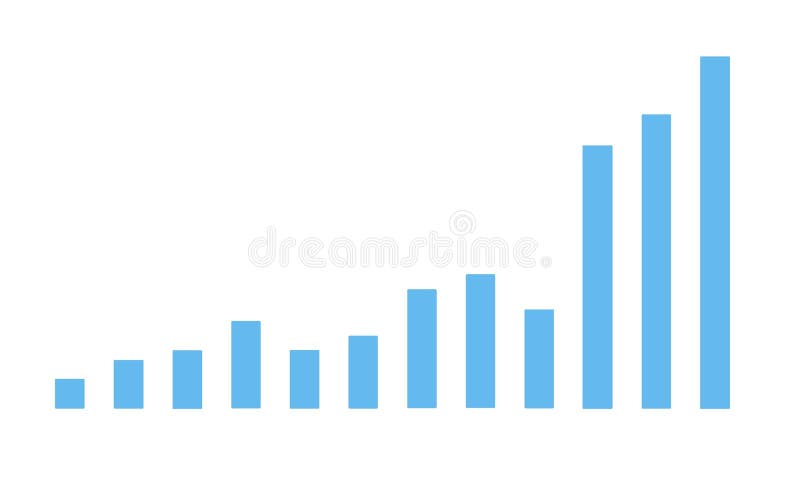
Free with trial A minimalist bar chart is displayed on a white background. Three vertical bars of increasing height are depicted with thick black outlines. The interior of each bar features a subtle grey gradient fill, creating a sense of depth. Progress decrease illustrations Simple Black Outline Bar Chart with Gradient Fill on White Background graph bars. A minimalist bar chart is displayed on a white background. Three vertical bars of increasing height are depicted with thick black outlines. The interior of each bar features a subtle grey gradient fill, creating a sense of depth
Free with trial Cost and quality control, business strategy and project management concept. Businessman use computer laptop with quality control growth graph and cost reduction, control budget cost and improvement. Progress decrease illustrations Cost and quality control, business strategy and project management concept. Businessman use computer laptop with quality control
Free with trial Person displays wooden block featuring a chart, emphasizing data visualization ,Generative ai. Progress decrease illustrations Wooden block chart display, data visualization for business analysis and strategic planning. Person displays wooden block featuring a chart, emphasizing data visualization ,Generative ai
Free with trial A pair of striking red arrows, one indicating upward movement and the other downward, presented in a clean 3D render on a white background, symbolizing change and direction. Progress decrease illustrations Two red arrows, one pointing up and one pointing down, isolated on white background. A pair of striking red arrows, one indicating upward movement and the other downward, presented in a clean 3D render on a white background, symbolizing change and direction
Free with trial A man in a blue suit holds a glowing blue bar graph showing increasing quality and decreasing cost with arrows and text. Progress decrease illustrations Businessman holding glowing bar graph showing cost reduction and quality increase. A man in a blue suit holds a glowing blue bar graph showing increasing quality and decreasing cost with arrows and text
Free with trial An image with a signpost pointing in two different directions in German. One direction points to upturn, the other points to crisis. Progress decrease illustrations Signposts the direct way to Boom versus Crisis. An image with a signpost pointing in two different directions in German. One direction points to upturn, the other points to crisis
Free with trial Trend chart icon in circular outline. Growth and decline symbol. Up and down arrow with bar graph illustration. Progress decrease vectors Trend chart icon in circular outline. Growth and decline symbol. Up and down arrow with bar graph
Free with trial Downward trending graph with red and black bars on a whiteboard mounted on an easel. Progress decrease illustrations Whiteboard displaying a downward trending graph with red and black bars chart data. Downward trending graph with red and black bars on a whiteboard mounted on an easel
Free with trial Steep downward trending red line graph with an arrow on a whiteboard mounted on an easel. Progress decrease illustrations Whiteboard showing a steep downward trending red line graph on an easel chart data. Steep downward trending red line graph with an arrow on a whiteboard mounted on an easel
Free with trial Doodle style illustration of a decreasing bar graph with a downward arrow, economy icon. Progress decrease vectors Doodle style illustration of a decreasing bar graph with a downward arrow, economy icon
Free with trial Close-up of a modern computer screen displaying stock market data and financial charts. Progress decrease illustrations Analyzing live stock market data on a computer screen, offering insights into trends. Close-up of a modern computer screen displaying stock market data and financial charts.
Free with trial Purple graph with bar chart visually representing data analysis and growth ,Generative ai. Progress decrease illustrations Purple graph with bar chart, visual representation of data analysis, growth, and business trends. Purple graph with bar chart visually representing data analysis and growth ,Generative ai
Free with trial Colorful bar chart on a blue background showing data analysis and statistical growth. Generative AI. Progress decrease illustrations Colorful bar chart on a blue background showing data analysis and statistical growth
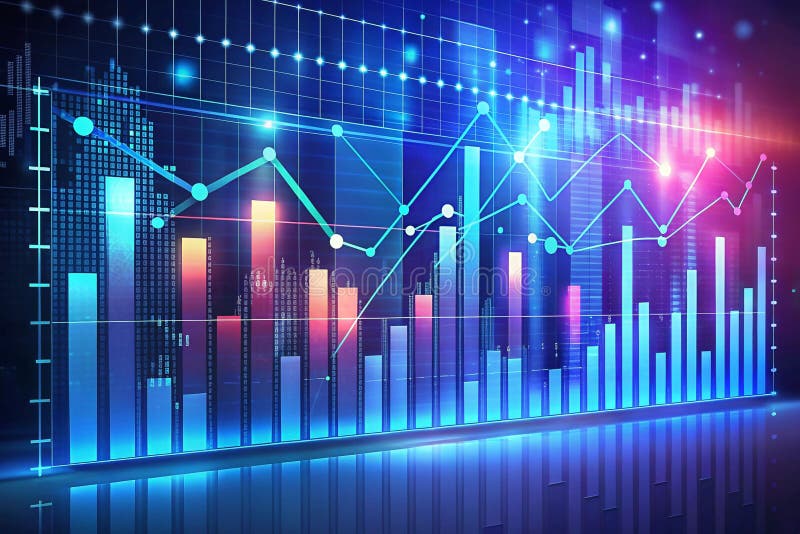
Free with trial A digital illustration depicting a financial chart with blue and red bars and lines. Neon glows accentuate the data points. The style is abstract and modern. Progress decrease illustrations Abstract Blue Red Financial Data Chart Graph Digital Illustration Neon Glow business. A digital illustration depicting a financial chart with blue and red bars and lines. Neon glows accentuate the data points. The style is abstract and modern
Free with trial Cylinder objects pattern. Stacked bar elements. Data visualization Vector. Storage capacity illustration. EPS 10. Progress decrease vectors Cylinder objects pattern. Stacked bar elements. Data visualization Vector. Storage capacity illustration.
Free with trial Simple Blue Analytics Diagram Bar Chart Showing Variable Data Trends on White Background � Simple Abstract Business and Analytics Infographic Illustration. Progress decrease illustrations Simple Blue Analytics Diagram Bar Chart Showing Variable Data Trends on White Background
Free with trial Two glossy, bright yellow arrows are positioned vertically on a light gray background. One arrow points upwards, and the other points downwards, symbolizing direction, change, or contrast. The 3D render is clean and minimalist. Progress decrease illustrations Two Glossy Yellow Arrows Pointing Up and Down on a Light Gray Background image photo. Two glossy, bright yellow arrows are positioned vertically on a light gray background. One arrow points upwards, and the other points downwards, symbolizing direction, change, or contrast. The 3D render is clean and minimalist
Free with trial White clouds symbolize CO2 capture & reduction. Arrows show decreasing emissions, recycling, & upward trend toward cleaner energy. A hopeful, minimalist design. Progress decrease illustrations Carbon Dioxide Reduction: Minimalist Cloud Visual Depicting a Clean Energy Transition. White clouds symbolize CO2 capture & reduction. Arrows show decreasing emissions, recycling, & upward trend toward cleaner energy. A hopeful, minimalist design
Free with trial A 3D bar chart displays four bars in descending order of height: green, purple, blue, and pink, set against a white background. Clear details and vibrant colors enhance visual appeal. Progress decrease illustrations 3D Bar Chart With Green Purple Blue And Pink Bars In Descending Order graph decrease. A 3D bar chart displays four bars in descending order of height: green. A 3D bar chart displays four bars in descending order of height: green, purple, blue, and pink, set against a white background. Clear details and vibrant colors enhance visual appeal
Free with trial Happy and sad businessman from rising and falling chart. Business success and failure infographic. Man sitting at computer table. Office manager. Startup project growth. Stock exchange. Vector concept. Progress decrease vectors Happy and sad businessman from rising and falling chart. Business success and failure infographic. Man sitting at computer table
Free with trial Rising thick red arrow filling grid lines in design studio, with blue pink charts, dotted bars. Financial, analytics, data, visualization, digital, technology, infographic. Progress decrease illustrations Rising thick red arrow filling grid lines in design studio, with blue pink charts, dotted bars
Free with trial 3D Pie chart icon. Circle divided into parts statistical diagram vector illustration. 3D render. Progress decrease vectors 3D Pie chart icon circle divided into parts statistical diagram vector illustration. 3D render.
Free with trial Abstract colorful bar charts display statistical data and financial trend analysis. Progress decrease vectors Colorful abstract bar charts representing data analysis and statistical visualization. Abstract colorful bar charts display statistical data and financial trend analysis.
Free with trial Financial chart arrow up and down icon illustration. Growth and decline graph symbol on black circle. Progress decrease vectors Financial chart arrow up and down icon. Growth and decline graph symbol on black circle
Free with trial A circular icon with a thick gold border contains a golden DNA helix symbol on a black background. To the right of the DNA helix, two jagged arrows point downwards, indicating a downward trend or decline. The overall design is sleek and symbolic, suggesting concepts related to genetic research, health trends, or scientific data analysis. Progress decrease illustrations Golden DNA Helix Icon with Downward Trend Arrows on Black Circle with Gold Border genetics. A circular icon with a thick gold border contains a golden DNA helix symbol on a black background. To the right of the DNA helix, two jagged arrows point downwards, indicating a downward trend or decline. The overall design is sleek and symbolic, suggesting concepts related to genetic research, health trends, or scientific data analysis
Free with trial A 3D pie chart with three colored segments (pink, blue, and teal) is shown against a solid purple background. A yellow circle with a white upward arrow is positioned to the left of the chart, and a pink circle with a white downward arrow is to the right. Progress decrease illustrations 3D Pie Chart With Up and Down Arrows Indicating Growth and Decline on a Purple Background. A 3D pie chart with three colored segments (pink, blue, and teal) is shown against a solid purple background. A yellow circle with a white upward arrow is positioned to the left of the chart, and a pink circle with a white downward arrow is to the right
Free with trial Bar chart graph. Colorful falling arrow. Financial data analysis. Vector business symbol. EPS 10. Progress decrease vectors Bar chart graph. Colorful falling arrow. Financial data analysis. Vector business symbol.
Free with trial Red stock market investment decline chart. Downward arrow. Negative growth concept, business development, declining profits. Analytical financial chart. Trend. Changes in exchange rates, interest rates. Progress decrease vectors Red stock market investment decline chart. Downward arrow. Negative growth concept, business development, declining profits.
Free with trial Red bar chart displays performance metrics on a table ,Generative ai. Progress decrease illustrations Red bar chart illustrating performance metrics on a table, data analysis and visualization. Red bar chart displays performance metrics on a table ,Generative ai
Free with trial Hand interacting with a red downward trend line against a blue bar graph background image. Generative AI. Progress decrease illustrations Hand interacting with a red downward trend line against a blue bar graph background image
Free with trial A 3D illustration of a blue line graph on a light blue background. The graph features a wavy blue line connecting several data points represented by small pink and green spheres. The overall shape suggests fluctuating data or trends, with some points indicating upward movement. Progress decrease illustrations 3D Blue Line Graph with Pink and Green Data Points on Light Blue Background chart statistics. A 3D illustration of a blue line graph on a light blue background. The graph features a wavy blue line connecting several data points represented by small pink and green spheres. The overall shape suggests fluctuating data or trends, with some points indicating upward movement
Free with trial A 3D rendered bar chart with yellow, pink, and teal bars stands against a light purple background. A purple magnifying glass with a yellow handle is positioned over the chart, suggesting analysis. A thin line with pink dots connects the tops of the bars, indicating a trend. Progress decrease illustrations 3D Bar Chart with Magnifying Glass and Trend Line on Purple Background graph statistics. A 3D rendered bar chart with yellow, pink, and teal bars stands against a light purple background. A purple magnifying glass with a yellow handle is positioned over the chart, suggesting analysis. A thin line with pink dots connects the tops of the bars, indicating a trend
Free with trial GDP decline indicated by arrow on digital global map highlight economic indicator across a geographical area. Progress decrease illustrations GDP decline indicated by arrow on digital global map highlight economic indicator across a geographical area
Free with trial A person in a suit points at a digital screen displaying charts that illustrate improvements in quality and reductions in cost. Progress decrease illustrations Person pointing at digital screen showing quality and cost improvement business strategy. A person in a suit points at a digital screen displaying charts that illustrate improvements in quality and reductions in cost
Free with trial This vibrant image showcases a collection of colorful 3D charts and graphs, including bar graphs, pie charts, and a line graph, all illustrating positive growth. A calculator and pencil are included, emphasizing the analytical and planning aspects of business success. Perfect for illustrating finan. Progress decrease illustrations Colorful 3D Financial Charts and Graphs with Calculator for Business Growth Presentation. This vibrant image showcases a collection of colorful 3D charts and graphs, including bar graphs, pie charts, and a line graph, all illustrating positive growth. A calculator and pencil are included, emphasizing the analytical and planning aspects of business success. Perfect for illustrating finan
Free with trial Growth decline graphs, market trends. Business performance symbols. Vector illustration. EPS 10. Stock image. Progress decrease vectors Growth decline graphs, market trends. Business performance symbols. Vector illustration. EPS 10.
Free with trial Red down arrow symbol. Two green up arrows. Directional comparison illustration. Vector design. EPS 10. Progress decrease vectors Red down arrow symbol. Two green up arrows. Directional comparison illustration. Vector design.
Free with trial Human Interaction and Movement Line Icon Set. Social Dynamics, Communication, Group Behavior Outline Symbol Collection. Growth and Movement Concept. Editable Stroke. Isolated Vector Illustration. Progress decrease vectors Human Interaction and Movement Line Icon Set. Social Dynamics, Communication, Group Behavior Outline Symbol Collection
Free with trial Abstract Black White Up Down Arrows Growth Chart Business Infographic Design. Generative AI. Progress decrease illustrations Abstract Black White Up Down Arrows Growth Chart Business Infographic Design
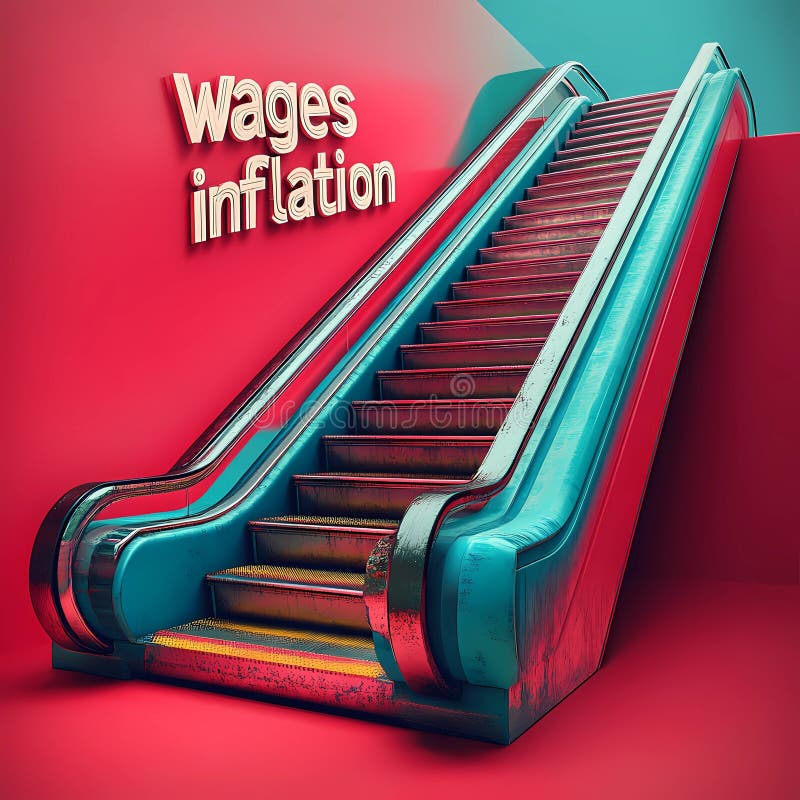
Free with trial Staircase with vibrant colors illustrates the concept of wages and inflation, emphasizing their relationship. Progress decrease illustrations Visual representation highlighting wages in relation to inflation on a stylized staircase. Staircase with vibrant colors illustrates the concept of wages and inflation, emphasizing their relationship.
Free with trial A striking graph depicts two lines: one gracefully declining, the other soaring upwards, set against a vivid gradient background that creates a compelling atmosphere. Progress decrease illustrations Dynamic Gradients Showcase Contrasting Growth and Decline Trends in a Captivating Landscape. A striking graph depicts two lines: one gracefully declining, the other soaring upwards, set against a vivid gradient background that creates a compelling atmosphere
Free with trial A 3D rendered graphic depicts a bar chart with three vertical bars of varying heights: two blue bars flanking a taller yellow bar. At the top of the yellow bar, a central yellow sphere is connected by white rods to two smaller blue spheres, resembling a molecular structure or a network. The entire graphic is isolated on a white background, suggesting concepts of data analysis, growth, and. Progress decrease illustrations 3D Rendered Bar Chart with Connecting Spheres Representing Data Analysis graph statistics. A 3D rendered graphic depicts a bar chart with three vertical bars of varying heights: two blue bars flanking a taller yellow bar. At the top of the yellow bar, a central yellow sphere is connected by white rods to two smaller blue spheres, resembling a molecular structure or a network. The entire graphic is isolated on a white background, suggesting concepts of data analysis, growth, and
Free with trial A 3D bar chart displays a downward trend. The bars are alternating green and pink, decreasing in height from left to right. A bright yellow arrow points downwards, crossing over the bars and emphasizing the decline. The background is a solid, light blue. Progress decrease illustrations Downward Trending Bar Chart with Yellow Arrow Indicating Decline on Light Blue Background. A 3D bar chart displays a downward trend. The bars are alternating green and pink, decreasing in height from left to right. A bright yellow arrow points downwards, crossing over the bars and emphasizing the decline. The background is a solid, light blue
Free with trial Crumbling bar chart made of clay or stone with broken tops and debris, symbolizing decline or instability in growth or progress. Progress decrease illustrations A broken bar chart made of clay or stone with a broken top and debris is a symbol of decline or instability. crumbling bar chart made of clay or stone with broken tops and debris, symbolizing decline or instability in growth or progress.
Free with trial A single red arrow with a curved path indicating a downward trend, isolated on a clean white background. Progress decrease illustrations A simple red curved arrow pointing downwards and to the right isolated on white background. A single red arrow with a curved path indicating a downward trend, isolated on a clean white background
Free with trial Abstract digital illustration featuring blue and red bar charts and line graphs on a dark blue background. Orange and light blue points highlight data trends. The style is clean and modern. Progress decrease illustrations Abstract Financial Data Visualization Blue Red Charts Graphs Lines Points finance business. Abstract digital illustration featuring blue and red bar charts and line graphs on a dark blue background. Orange and light blue points highlight data trends. The style is clean and modern
Free with trial Trend chart icon in black circle. Growth and decline symbol. Up and down arrow with bar graph illustration. Progress decrease vectors Trend chart icon in black circle. Growth and decline symbol. Up and down arrow with bar graph
Free with trial A single, glossy green arrow pointing directly downwards is depicted against a plain white background. The arrow has rounded edges and a smooth, reflective surface, giving it a modern and clean appearance. This icon commonly represents actions such as downloading, going down, or indicating a negative trend. Progress decrease illustrations Glossy Green Downward Arrow Icon on White Background image photo. A single, glossy green arrow pointing directly downwards is depicted against a plain white background. The arrow has rounded edges and a smooth, reflective surface, giving it a modern and clean appearance. This icon commonly represents actions such as downloading, going down, or indicating a negative trend
Free with trial A financial chart displaying market analysis and business growth with increasing and decreasing trends. Progress decrease illustrations Financial chart showing growth and market analysis data isolated on transparent background. A financial chart displaying market analysis and business growth with increasing and decreasing trends.
Free with trial 3D Colorful Charts Magnifier Analysis, Data Visualization, Market Research ,chart,magnifying glass , This photo was created using generative AI. Progress decrease illustrations 3D Colorful Charts Magnifier Analysis, Data Visualization, Market Research ,chart,magnifying glass
Free with trial The word "SLOW" inside a green circle indicates reduced speed, caution, or delay. The image represents traffic safety and a need for reduced pace. Progress decrease vectors Vector art of the word slow inside a green circle, indicating reduced speed, caution, or delay. The word "SLOW" inside a green circle indicates reduced speed, caution, or delay. The image represents traffic safety and a need for reduced pace
Free with trial Futuristic financial data visualization with graphs and charts showing growth and market trends. Progress decrease illustrations Futuristic financial data visualization with graphs and charts showing growth and market trends
Free with trial Composite trend artwork sketch image collage of business arrow down bankruptcy loss money coins young guy walk down recession reduction. Progress decrease illustrations Composite trend artwork sketch image collage of business arrow down bankruptcy loss money coins young guy walk down
Free with trial Graph going Up and Down sign with blue arrows vector. Flat design vector illustration concept of sales bar chart symbol icon with arrow moving down and sales bar chart with arrow moving up. Progress decrease vectors Graph going Up and Down sign with blue arrows vector. Flat design vector illustration concept of sales bar chart symbol icon. Graph going Up and Down sign with blue arrows vector. Flat design vector illustration concept of sales bar chart symbol icon with arrow moving down and sales bar chart with arrow moving up.
Free with trial A colorful bar graph depicting an upward trend with a minor dip, presented as a document icon. The design uses bold colors and clean lines for a modern, data-driven aesthetic. Ideal for presentations or reports. Progress decrease illustrations Vibrant Bar Graph on Document Icon: Upward Trend with Slight Dip, Colorful Data Visualization. A colorful bar graph depicting an upward trend with a minor dip, presented as a document icon. The design uses bold colors and clean lines for a modern, data-driven aesthetic. Ideal for presentations or reports
Free with trial A bold, bright yellow 3D arrow is depicted pointing directly downwards. The arrow has a thick, solid form with rounded edges, giving it a modern and approachable appearance. It is presented in isolation against a stark white background, making the arrow the sole focus of the image. Progress decrease illustrations Bright Yellow 3D Arrow Pointing Downwards on a White Background direction down arrow. A bold, bright yellow 3D arrow is depicted pointing directly downwards. The arrow has a thick, solid form with rounded edges, giving it a modern and approachable appearance. It is presented in isolation against a stark white background, making the arrow the sole focus of the image
Free with trial Up and down trend chart icon in black circle. Business growth and decline symbol illustration. Progress decrease vectors Up and down trend chart icon in black circle. Business growth and decline symbol