Free with trial A colorful circular gauge on a chalkboard showing a low score, indicated by crossed wooden sticks, high-resolution background Generative AI. Progress decrease illustrations A colorful circular gauge on a chalkboard showing a low score, indicated by crossed wooden sticks
Free with trial Business Analytics And Data Visualization Line Icon Set. Financial Growth, Market Trends, And Performance Analysis Outline Symbol Collection. Editable Stroke. Isolated Vector Illustration. Progress decrease vectors Business Analytics And Data Visualization Line Icon Set. Financial Growth, Market Trends, And Performance Analysis
Free with trial Hand drawing a downward trend graph with a yellow marker on a dark blackboard representing financial decline and economic downturn concepts. Bar chart visualization. Progress decrease illustrations Hand Drawing Downward Trend Graph With Yellow Marker On Dark Blackboard Representing Financial Decline. Hand drawing a downward trend graph with a yellow marker on a dark blackboard representing financial decline and economic downturn concepts. Bar chart visualization
Free with trial Fund investment concept, Interest rate, percentage and arrow investment on coin instead of return return index fund and mutual fund return long term investment retirement fund. Progress decrease illustrations Fund investment concept, Interest rate, percentage and arrow investment on coin instead of return return index fund and mutual
Free with trial A striking graph illustrates opposing trends one line sharply decreases while another rises, enveloped in warm orange hues that evoke energy and transformation. Progress decrease illustrations Dynamic Trends Displayed Through Contrasting Lines in Shades of Orange With a Vivid Background. A striking graph illustrates opposing trends one line sharply decreases while another rises, enveloped in warm orange hues that evoke energy and transformation
Free with trial Two lines traverse the canvas, one descending and the other ascending, embodying contrasting trends in a warm orange spectrum that captivates the observer's eye. Progress decrease illustrations Dynamic Trends Illustrated in Warm Shades of Orange Showcasing Contrasting Movements Over Time. Two lines traverse the canvas, one descending and the other ascending, embodying contrasting trends in a warm orange spectrum that captivates the observer's eye
Free with trial A 3D bar chart illustrating a declining trend, perfect for business, finance, and data visualization presentations. Progress decrease illustrations Colorful 3D bar graph showing a downward trend in business growth and financial data analysis. A 3D bar chart illustrating a declining trend, perfect for business, finance, and data visualization presentations
Free with trial Business refers to the organized efforts and activities of individuals or groups to produce, buy, sell, and exchange goods or services for profit. Progress decrease illustrations The piggy bank and coins for Business concept 3d rendering. Business refers to the organized efforts and activities of individuals or groups to produce, buy, sell, and exchange goods or services for profit
Free with trial Business refers to the organized efforts and activities of individuals or groups to produce, buy, sell, and exchange goods or services for profit. Progress decrease illustrations The Arrow down and coins for Business concept 3d rendering. Business refers to the organized efforts and activities of individuals or groups to produce, buy, sell, and exchange goods or services for profit
Free with trial Cost reduction concept on wooden cube, Expenses and saving money, Business strategy and project management, cost reduction, efficient business and budget cutting. Progress decrease illustrations Cost reduction concept on wooden cube, Expenses and saving money, Business strategy and project management, cost reduction
Free with trial Business refers to the organized efforts and activities of individuals or groups to produce, buy, sell, and exchange goods or services for profit. Progress decrease illustrations The Arrow down and coins for Business concept 3d rendering. Business refers to the organized efforts and activities of individuals or groups to produce, buy, sell, and exchange goods or services for profit
Free with trial Business refers to the organized efforts and activities of individuals or groups to produce, buy, sell, and exchange goods or services for profit. Progress decrease illustrations The Arrow down and coins for Business concept 3d rendering. Business refers to the organized efforts and activities of individuals or groups to produce, buy, sell, and exchange goods or services for profit
Free with trial A 3D rendering of a simple bar graph featuring two green and one orange cylinder. This image is perfect for illustrating business concepts, data representation, or as an infographic element. The clean design makes it versatile for various applications. This image was generated with the assistance of artificial intelligence. Progress decrease illustrations 3D Bar Graph, Green and Orange Cylinders, Business Chart, Data Visualization, Infographic Element. A 3D rendering of a simple bar graph featuring two green and one orange cylinder. This image is perfect for illustrating business concepts, data representation, or as an infographic element. The clean design makes it versatile for various applications.This image was generated with the assistance of artificial intelligence.
Free with trial Gold business icons on dark background graphs, charts, money, global, growth, finance, planning, idea, vibrant background Generative AI. Progress decrease illustrations Gold business icons on dark background graphs, charts, money, global, growth, finance, planning, idea
Free with trial Green happy face stands tall on a green block while sad faces descend on wooden blocks illustrating a business graph showing success and failure representing contrasting emotions and outcomes. This i. Progress decrease illustrations Green happy face stands above sad faces on a descending graph representing success and failure. Green happy face stands tall on a green block while sad faces descend on wooden blocks illustrating a business graph showing success and failure representing contrasting emotions and outcomes. This i
Free with trial Reduction chart icon vector logo set collection for web app ui. Progress decrease vectors Reduction chart icon set depicting data reduction symbols, ideal for business analytics and performance visuals. Reduction chart icon vector logo set collection for web app ui
Free with trial Business refers to the organized efforts and activities of individuals or groups to produce, buy, sell, and exchange goods or services for profit. Progress decrease illustrations The piggy bank and coins for Business concept 3d rendering. Business refers to the organized efforts and activities of individuals or groups to produce, buy, sell, and exchange goods or services for profit
Free with trial Business refers to the organized efforts and activities of individuals or groups to produce, buy, sell, and exchange goods or services for profit. Progress decrease illustrations The Arrow down and coins for Business concept 3d rendering. Business refers to the organized efforts and activities of individuals or groups to produce, buy, sell, and exchange goods or services for profit
Free with trial Business refers to the organized efforts and activities of individuals or groups to produce, buy, sell, and exchange goods or services for profit. Progress decrease illustrations The Arrow down and coins for Business concept 3d rendering. Business refers to the organized efforts and activities of individuals or groups to produce, buy, sell, and exchange goods or services for profit
Free with trial Business refers to the organized efforts and activities of individuals or groups to produce, buy, sell, and exchange goods or services for profit. Progress decrease illustrations The piggy bank and coins for Business concept 3d rendering. Business refers to the organized efforts and activities of individuals or groups to produce, buy, sell, and exchange goods or services for profit
Free with trial Business refers to the organized efforts and activities of individuals or groups to produce, buy, sell, and exchange goods or services for profit. Progress decrease illustrations The Arrow down and coins for Business concept 3d rendering. Business refers to the organized efforts and activities of individuals or groups to produce, buy, sell, and exchange goods or services for profit
Free with trial Two green arrows, one pointing upwards with a sleek curve and one pointing downwards, are isolated on a white background. The arrows have a smooth, 3D appearance with a glossy finish. The upward arrow suggests notions of growth and progress, while the downward arrow implies descent or decrease. Their green color often symbolizes renewal and direction. Progress decrease vectors A single green arrow with a sleek upward curve symbolizes growth and direction. Green Arrow isolated on white. Two green arrows, one pointing upwards with a sleek curve and one pointing downwards, are isolated on a white background. The arrows have a smooth, 3D appearance with a glossy finish. The upward arrow suggests notions of growth and progress, while the downward arrow implies descent or decrease. Their green color often symbolizes renewal and direction.
Free with trial Modern Robot Hands Interacting with Digital Cost Reduction Concept on Futuristic Background Representing Business Strategy and Brand Analysis Quark. Progress decrease illustrations Modern Robot Hands Interacting with Digital Cost Reduction Concept on Futuristic Background Representing Business
Free with trial Collage image poster illustration retro young guy holding arrow move up rise success among point down career goal challenge template. Progress decrease illustrations Collage image poster illustration retro young guy holding arrow move up rise success among point down career goal
Free with trial Red cube with arrow up. Business and market growth concept. Close-up. Progress decrease illustrations Red cube with arrow up. Business and market growth concept
Free with trial Red cube with arrow up. Business and market growth concept. Close-up. Progress decrease illustrations Red cube with arrow up. Business and market growth concept
Free with trial Red cube with arrow up. Business and market growth concept. Close-up. Progress decrease illustrations Red cube with arrow up. Business and market growth concept
Free with trial Red cube with arrow up. Business and market growth concept. Close-up. Progress decrease illustrations Red cube with arrow up. Business and market growth concept
Free with trial Red cube with arrow up. Business and market growth concept. Close-up. Progress decrease illustrations Red cube with arrow up. Business and market growth concept
Free with trial Red cube with arrow up. Business and market growth concept. Close-up. Progress decrease illustrations Red cube with arrow up. Business and market growth concept
Free with trial Financial crisis. Economic collapse. Unfavorable conditions for a startup. The person tries to keep the falling histogram. Progress decrease vectors Financial crisis. Economic collapse. Unfavorable conditions for a startup. The person tries to keep the falling histogram
Free with trial Blue folder with chart, business organization, data analysis, and report presentation concept. streamline your workflow ,Generative ai. Progress decrease illustrations Blue folder with chart, streamlining business data analysis and report presentation for enhanced workflow. Blue folder with chart, business organization, data analysis, and report presentation concept. streamline your workflow ,Generative ai
Free with trial A man standing in front of a chart with an arrow pointing to it, analyzing sales growth data, Worker analyzes sales growth graph, Simple and minimalist flat Vector Illustration. Progress decrease vectors A man standing in front of a chart with an arrow pointing to it, analyzing sales growth data, Worker analyzes sales growth graph
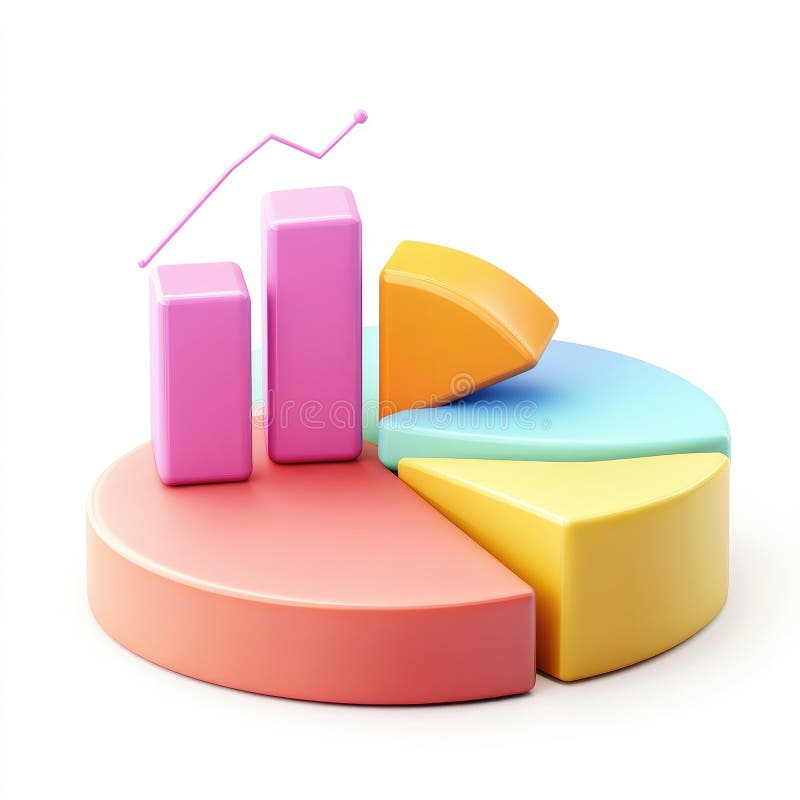
Free with trial This image shows a vibrant 3D bar chart and pie chart, ideal for business presentations and reports to visualize data effectively. The colorful design is visually appealing and easy to understand. Progress decrease illustrations Colorful 3D Bar and Pie Charts for Business Presentation. This image shows a vibrant 3D bar chart and pie chart, ideal for business presentations and reports to visualize data effectively. The colorful design is visually appealing and easy to understand.
Free with trial Colorful bar graph showing data and trends, perfect for business, finance, or analytics presentations. EPS 10. Progress decrease vectors Colorful bar graph showing data and trends, perfect for business, finance, or analytics presentations.
Free with trial Creative collage picture young man celebrate success money earning profit income euro golden coins finance drawing background. Progress decrease illustrations Creative collage picture young man celebrate success money earning profit income euro golden coins finance drawing
Free with trial A detailed financial chart showing business data analysis and market trend with upward arrow sign. Progress decrease illustrations Financial chart business data analysis and market trend view isolated on transparent background. a detailed financial chart showing business data analysis and market trend with upward arrow sign
Free with trial A bright yellow, three-dimensional arrow is depicted pointing directly downwards. The arrow has a classic arrowhead shape and a rectangular shaft, rendered with smooth surfaces and subtle shading to give it a solid appearance. It is isolated against a clean white background, making it stand out clearly as a directional symbol. Progress decrease illustrations Bright Yellow 3D Arrow Pointing Downwards on a White Background Keywords: arrow, down, pointing, direction, downward, yellow, 3d. A bright yellow, three-dimensional arrow is depicted pointing directly downwards. The arrow has a classic arrowhead shape and a rectangular shaft, rendered with smooth surfaces and subtle shading to give it a solid appearance. It is isolated against a clean white background, making it stand out clearly as a directional symbol
Free with trial Financial Transaction Icons Circular Linear and Directional Arrow Set for Business and Finance Concepts. Progress decrease vectors Financial Transaction Icons Circular Linear and Directional Arrow Set for Business and Finance Concepts
Free with trial Stock market trading technical analysis bar chart fall. Business candlestick graph exchange down trend. Crisis economy and investment loss graph. Trader financial index crash concept. Eps banner. Progress decrease vectors Stock market trading technical analysis bar chart fall. Business candlestick graph exchange down trend. Crisis economy
Free with trial Green cube with arrow up. Business and market growth concept. Close-up. Progress decrease illustrations Green cube with arrow up. Business and market growth concept
Free with trial Green cube with arrow up. Business and market growth concept. Close-up. Progress decrease illustrations Green cube with arrow up. Business and market growth concept
Free with trial Green cube with arrow up. Business and market growth concept. Close-up. Progress decrease illustrations Green cube with arrow up. Business and market growth concept
Free with trial Green cube with arrow up. Business and market growth concept. Close-up. Progress decrease illustrations Green cube with arrow up. Business and market growth concept
Free with trial The image is a digital illustration of a stock market chart. The chart is blue in color and has a line graph in the center. The line graph shows a downward trend, indicating a decrease in the stock market. On the top left corner of the chart, there is a white text that reads "10. 03570". The background of the image is made up of small white dots, which are scattered across the chart. Progress decrease illustrations The image is a digital illustration of a stock market chart. The chart is blue in color and has a line graph in the center.
Free with trial Hand interacting with blue chart, analyzing growth, trends, and financial performance data ,Generative ai. Progress decrease illustrations Hand analyzing blue chart, deciphering growth trends and financial performance for business success. Hand interacting with blue chart, analyzing growth, trends, and financial performance data ,Generative ai
Free with trial Dropping carbon emissions represented by a 3D graph, set against corporate buildings of the future. Corporate carbon reduction. Progress decrease illustrations Dropping carbon emissions represented by a 3D graph, set against corporate buildings of the future. Corporate carbon
Free with trial Stock market trading technical analysis bar chart fall. Business exchange graph downtrend. Crisis economy and investment loss graph. Trader financial index crash concept. Eps banner dark background. Progress decrease vectors Stock market trading technical analysis bar chart fall. Business exchange graph downtrend. Crisis economy and investment
Free with trial Magnifying glass over bar graph, symbolizes research, analysis, insights, growth, and strategy. Can be used for display or montage your products. Empty Space for display your products, copy space ,banner, advertising. Generative AI. Progress decrease illustrations Data Analysis and Market Research Magnifying glass over bar graph symbolizes research analysis insights growth and strategy. Magnifying glass over bar graph, symbolizes research, analysis, insights, growth, and strategy. Can be used for display or montage your products. Empty Space for display your products, copy space ,banner, advertising. Generative AI
Free with trial Chart icons for data analysis vector art design, Minimalist business charts icons bar graphs, line graphs, and pie charts vector illustration on white background the image is generated using AI. Progress decrease vectors Chart icons for data analysis vector art design, Minimalist business charts icons bar graphs, line graphs, and pie charts vector
Free with trial A businessman is actively typing on a modern, transparent laptop, which prominently displays the word Cost alongside a green downward-pointing arrow, illustrating a concept of cost reduction and improved financial efficiency in business operations. Progress decrease illustrations Businessman typing on laptop with Cost and a downward arrow displayed, symbolizing cost reduction and financial efficiency. A businessman is actively typing on a. A businessman is actively typing on a modern, transparent laptop, which prominently displays the word Cost alongside a green downward-pointing arrow, illustrating a concept of cost reduction and improved financial efficiency in business operations
Free with trial Vertical poster collage mature woman entrepreneur charts statistics hand body fragment pointing finger recession crisis loss. Progress decrease illustrations Vertical poster collage mature woman entrepreneur charts statistics hand body fragment pointing finger recession crisis
Free with trial Monochrome chart representing big data analysis with peaks and valleys, stock market theme for investment strategy and economic forecast using modern digital infographic. Progress decrease illustrations Abstract 3d graph with data blocks on white grid background, business analytics concept for financial report and corporate. Monochrome chart representing big data analysis with peaks and valleys, stock market theme for investment strategy and economic forecast using modern digital infographic
Free with trial A vibrant watercolor painting of a colorful tree alongside a bar graph showing fluctuating growth, symbolizing nature, growth, change, resilience, and potential. Elegant empty space crafted for branding, ads, and product presentations. Suitable for marketing campaigns and creative displays. . Generative AI. Progress decrease illustrations Watercolor Tree and Growth Chart A vibrant watercolor painting of a colorful tree alongside a bar graph showing fluctuating. A vibrant watercolor painting of a colorful tree alongside a bar graph showing fluctuating growth, symbolizing nature, growth, change, resilience, and potential. Elegant empty space crafted for branding, ads, and product presentations. Suitable for marketing campaigns and creative displays. . Generative AI
Free with trial A digital representation of quality and cost metrics in the business world, emphasizing strategy and analysis through upward and downward arrows in a modern setting. Qubit. Progress decrease illustrations Digital hand showcasing quality and cost metrics with upward and downward arrows, representing analysis, strategy, and. A digital representation of quality and cost metrics in the business world, emphasizing strategy and analysis through upward and downward arrows in a modern setting. Qubit
Free with trial Two sets of three dimensional bar charts. One set shows ascending bars in light colors, shows bars in yellow, beige with decreasing trend. Visual representation aids in data analysis. Progress decrease illustrations Two sets of three dimensional bar charts. One set shows ascending bars in light colors, shows bars in yellow, beige with
Free with trial An upward trend in finance represented by stacks of coins and a red arrow, symbolizing growth and prosperity, Generative AI. Progress decrease illustrations An upward trend in finance represented by stacks of coins and a red arrow, symbolizing growth and prosperity
Free with trial Hand drawn falling graph line over declining bar chart representing economic recession and business loss. Progress decrease vectors Hand drawn falling graph line over declining bar chart representing economic recession and business loss
Free with trial Minimalist graph icon showing growth and fluctuation. Perfect for finance, business reports, market analysis, and data presentation projects. Progress decrease vectors Minimalist graph icon showing growth and fluctuation. Perfect for finance, business reports, market analysis, and data
Free with trial Vector illustration of a graph with a downward arrow, representing decline or negative growth. Progress decrease vectors Professional Graph with Arrow Down Outline Icon Vector Illustration. Vector illustration of a graph with a downward arrow, representing decline or negative growth.
Free with trial Vector illustration of a graph with a downward arrow, representing decline or negative growth. Progress decrease vectors Professional Graph with Arrow Down Outline Icon Vector Illustration. Vector illustration of a graph with a downward arrow, representing decline or negative growth.
Free with trial Vector illustration of a graph with a downward arrow, representing decline or negative growth. Progress decrease vectors Professional Graph with Arrow Down Outline Icon Vector Illustration. Vector illustration of a graph with a downward arrow, representing decline or negative growth.
Free with trial This image showcases vibrant 3D bar and pie charts, illustrating growth and statistical data. Perfect for presentations or reports on financial success. Progress decrease illustrations Colorful 3D Bar and Pie Charts Showing Business Growth and Statistics. This image showcases vibrant 3D bar and pie charts, illustrating growth and statistical data. Perfect for presentations or reports on financial success.
Free with trial Line Graph Chart Solid Icon. Data Analysis, Trend Visualization, And Statistical Representation Silhouette Symbol. Business And Financial Insights. Isolated Vector Illustration. Progress decrease vectors Line Graph Chart Solid Icon. Data Analysis, Trend Visualization, And Statistical Representation Silhouette Symbol
Free with trial Abstract bar graph chart background representing stock market trade growth and financial investment success ideal for business analysis economic data visualization and corporate finance concept designs. Progress decrease illustrations Abstract bar graph chart stock market trade background showing upward growth financial investment concept. Abstract bar graph chart background representing stock market trade growth and financial investment success ideal for business analysis economic data visualization and corporate finance concept designs
Free with trial Visualizing cost reduction strategies in business, a hand places an arrow indicating decreasing costs on a graph, highlighting financial management and efficiency. 200 chars. Progress decrease illustrations Reduce costs strategy business finance management budget planning investment savings efficiency 100 chars. visualizing cost reduction strategies in business, a hand places an arrow indicating decreasing costs on a graph, highlighting financial management and efficiency. 200 chars
Free with trial Bold, hand-drawn arrow pointing down and right, conveying a sense of direction, decline, or a negative trend. This versatile graphic is perfect for presentations, infographics, or charts needing a simple, impactful visual cue. Progress decrease illustrations Drawn arrow pointing down and to the right, symbolizing direction or decline in a simple, bold graphic style. Bold, hand-drawn arrow pointing down and right, conveying a sense of direction, decline, or a negative trend. This versatile graphic is perfect for presentations, infographics, or charts needing a simple, impactful visual cue.
Free with trial Hand interacting with a projected bar chart on a wall, exploring data visualization ,Generative ai. Progress decrease illustrations Data visualization, hand engages with interactive bar chart projected on wall, exploring trends and insights. Hand interacting with a projected bar chart on a wall, exploring data visualization ,Generative ai
Free with trial Bitcoin coins with red arrow down and with green growth arrow. Falling and growing price of cryptocurrency, concept. 3D rendering isolated on white background. Progress decrease illustrations Bitcoin coins with red arrow down and with green growth arrow. Falling and growing price of cryptocurrency, concept. 3D rendering
Free with trial Businessman in a suit and a bar graph. Business and finance concept. Growth and investment idea. Copy space. Progress decrease illustrations Businessman in a suit and a bar graph. Business and finance concept. Growth and investment idea.
Free with trial Businessman in a suit and a bar graph. Business and finance concept. Growth and investment idea. Copy space. Progress decrease illustrations Businessman in a suit and a bar graph. Business and finance concept. Growth and investment idea.
Free with trial Businessman in a suit and a bar graph. Business and finance concept. Growth and investment idea. Copy space. Progress decrease illustrations Businessman in a suit and a bar graph. Business and finance concept. Growth and investment idea.
Free with trial Bar Chart With Arrows Line And Solid Icon Set. Data Analysis, Trend Indication, Business Performance Tracking Symbols. Visual Representation Of Growth And Decline. Isolated Vector Illustration. Progress decrease vectors Bar Chart With Arrows Line And Solid Icon Set. Data Analysis, Trend Indication, Business Performance Tracking Symbols
Free with trial This image features a glossy yellow arrow with a smooth, curved shape pointing downwards, symbolizing a decrease or negative trend in a visually striking manner. Progress decrease illustrations A glossy yellow arrow curves downwards, indicating a downward trend or direction isolated on white background. This image features a glossy yellow arrow with a smooth, curved shape pointing downwards, symbolizing a decrease or negative trend in a visually striking manner
Free with trial Glowing orange graph showing a downward market trend breaks through a dark surface, symbolizing decline and loss. Generated with an AI. Progress decrease illustrations Glowing orange graph showing a downward market trend breaks through a dark surface, symbolizing decline and loss
Free with trial Vibrant bar chart visualization with dark background displaying data trends ,Generative ai. Progress decrease illustrations Colorful bar chart on dark background, data visualization for business performance analysis and trend insights. Vibrant bar chart visualization with dark background displaying data trends ,Generative ai
Free with trial A hand with a pen analyzes financial charts on a digital screen, highlighting investment trends, market analysis, and economic growth using visual representation of performance. Progress decrease illustrations Analyzing financial data with pen on digital screen, showing investment trends and growth. Chart displays performance. A hand with a pen analyzes financial charts on a digital screen, highlighting investment trends, market analysis, and economic growth using visual representation of performance