Free with trial Generative ai, The image shows a red bar graph and a red arrow pointing down on a red grid background, illustrating a significant downward trend. Progress decrease illustrations The image shows a red and white arrow pointing down in front of a red grid background with a series of 3D red bars depicting. generative ai, The image shows a red bar graph and a red arrow pointing down on a red grid background, illustrating a significant downward trend
Free with trial CO2 emission reduction goals with wooden blocks. Climate change mitigation. created ai. Progress decrease illustrations Achieving CO2 Emission Reduction Goals with Wooden Blocks: Climate Change Mitigation Strategy, Eco Friendly Target, Carbon. CO2 emission reduction goals with wooden blocks. Climate change mitigation. created ai
Free with trial Graph with arrow down outline icon, symbolizing a downward trend or decrease in data. Perfect for financial reports, stock market analysis, and performance tracking. Progress decrease vectors Professional Graph with Downward Arrow Vector Illustration for Business Presentations. Graph with arrow down outline icon, symbolizing a downward trend or decrease in data. Perfect for financial reports, stock market analysis, and performance tracking.
Free with trial A monitor displays a downward trending bar graph, symbolizing financial loss or economic decline. The visual representation emphasizes negative trends and potential risks. Progress decrease vectors Vector art of monitor displaying a downward trending bar graph, indicating financial loss or economic decline. A monitor displays a downward trending bar graph, symbolizing financial loss or economic decline. The visual representation emphasizes negative trends and potential risks
Free with trial Red arrow pointing downward on colorful vertical bars. Business financial crisis chart with decreasing trend line. Economic data visualization. Progress decrease illustrations Red arrow pointing downward on colorful vertical bars. Business financial crisis chart with decreasing trend line
Free with trial This infographic illustrates a crucial aspect of data analysis: recognizing and interpreting downward trends. The chart clearly displays a decreasing arrow, highlighting a negative slope and a reduction in value over time. Understanding these downward trends is critical in various fields, from finance and business to investment and market analysis. The visual representation aids in quickly. Progress decrease illustrations Analyzing Downward Trends in Data A Comprehensive Guide to Understanding Decreasing Charts and Graphs in Business. This infographic illustrates a crucial aspect of data analysis: recognizing and interpreting downward trends. The chart clearly displays a decreasing arrow, highlighting a negative slope and a reduction in value over time. Understanding these downward trends is critical in various fields, from finance and business to investment and market analysis. The visual representation aids in quickly
Free with trial In a virtual space, a 3D graph displaying decreasing carbon emissions stands against modern corporate buildings. Corporate carbon reduction. Progress decrease illustrations In a virtual space, a 3D graph displaying decreasing carbon emissions stands against modern corporate buildings
Free with trial Colorful data visualization with various charts and graphs. Visual representation of growth and performance metrics, breathtaking wallpaper background Generative AI. Progress decrease illustrations Colorful data visualization with various charts and graphs. Visual representation of growth and performance metrics
Free with trial Hand drawn style illustration of a falling down chart on a calendar with a blue arrow, representing economic decline. Progress decrease vectors Hand drawn style illustration of a falling down chart on a calendar with a blue arrow, representing economic decline
Free with trial Decreasing bar graph illustration simple hand drawn financial decline, negative trend analysis chart with arrow axes, AI. Progress decrease vectors Decreasing bar graph illustration simple hand drawn financial decline, negative trend analysis chart with arrow axes, AI
Free with trial A bar chart with a downward-pointing red arrow and decreasing black bars symbolizing loss and failure. Finance, business, and economics concept. Progress decrease illustrations A bar chart with a downward-pointing red arrow and decreasing black bars symbolizing loss and failure. Finance, business, and
Free with trial 3D graph in virtual space portrays dwindling carbon emissions over time against futuristic corporate buildings. Corporate carbon reduction. Progress decrease illustrations 3D graph in virtual space portrays dwindling carbon emissions over time against futuristic corporate buildings
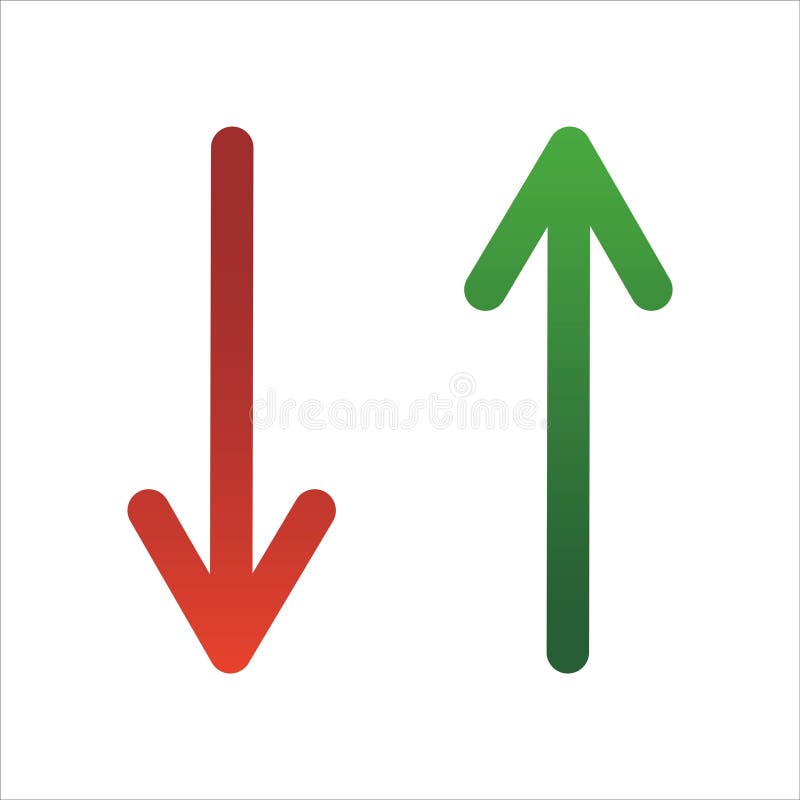
Free with trial Up and Down sign with green and red arrows vector illustration. Concept of sales bar chart symbol icon with arrow moving down and sales bar chart with arrow moving up. Progress decrease vectors Up and Down sign with green and red arrows vector illustration. Concept of sales bar chart symbol icon
Free with trial A 3D rendered pie chart composed of three pastel-colored segments: pink, blue, and teal. Two coins are positioned around the chart. A yellow coin with an upward-pointing arrow is above the chart, and a pink coin with a downward-pointing arrow is below it, set against a light purple background. Progress decrease illustrations 3D Pie Chart with Up and Down Arrows on Coins in Pastel Colors Keywords: pie chart, graph, data, analytics, statistics, finance. A 3D rendered pie chart composed of three pastel-colored segments: pink, blue, and teal. Two coins are positioned around the chart. A yellow coin with an upward-pointing arrow is above the chart, and a pink coin with a downward-pointing arrow is below it, set against a light purple background
Free with trial Digital financial chart displays rising falling stock market data. Dynamic investment data visualization shows fluctuating market trends. Abstract financial interface with glowing. Progress decrease illustrations Digital financial chart displays rising, falling stock market data. Dynamic investment data visualization shows fluctuating. Digital financial chart displays rising falling stock market data. Dynamic investment data visualization shows fluctuating market trends. Abstract financial interface with glowing.
Free with trial Set of linear graphs with red and blue lines showing different trends and dynamics vector illustration. Change in time of election results or income. For business analytics, financial reports. Progress decrease vectors Set of linear graphs with red and blue lines showing different trends and dynamics vector illustration. Change in time of election
Free with trial Businessman Choosing Cost Reduction Strategies through Digital Technologies and Visual Data Representation for Enhanced Profitability and Efficiency Quark. Progress decrease illustrations Businessman Choosing Cost Reduction Strategies through Digital Technologies and Visual Data Representation for Enhanced. Profitability and Efficiency Quark
Free with trial Two hands cradle glowing symbols. On the left, a percentage sign emanates warmth and light, while the right hand holds an upward-trending graph, symbolizing growth. Tiny, shimmering particles float between them, suggesting the exchange of financial concepts. Created ai. Progress decrease illustrations Boost your business success with strategic financial growth and rising interest rates now with this dynamic composition. Two hands cradle glowing symbols. On the left, a percentage sign emanates warmth and light, while the right hand holds an upward-trending graph, symbolizing growth. Tiny, shimmering particles float between them, suggesting the exchange of financial concepts. Created ai
Free with trial A vibrant infographic visualizes global consumption trends using circular graphs and colorful gradients This modern data visualization effectively presents worldwide consumption patterns, highlighting key insights for business analysis, market research, and economic reporting Ideal for presentations and publications, its design ensures easy data comprehension AI Generative. Progress decrease illustrations Abstract Infographic Global Consumption Trends Visualization with Circular Graphs and Colorful Gradients Modern Data Visualization. A vibrant infographic visualizes global consumption trends using circular graphs and colorful gradients This modern data visualization effectively presents worldwide consumption patterns, highlighting key insights for business analysis, market research, and economic reporting Ideal for presentations and publications, its design ensures easy data comprehension AI Generative
Free with trial A digital hand displays an illuminated financial growth graph with various statistics against a dark city backdrop, emphasizing technology in data analysis and investment trends. Scalp. Progress decrease illustrations Digital hand presenting glowing financial growth graph with statistics and global connectivity showcasing data analytics. A digital hand displays an illuminated financial growth graph with various statistics against a dark city backdrop, emphasizing technology in data analysis and investment trends. Scalp
Free with trial Infographic world map with charts, graphs, and data visualizations for business reports, presentations, and website content, vibrant background Generative AI. Progress decrease illustrations Infographic world map with charts, graphs, and data visualizations for business reports, presentations, and website content
Free with trial A financial report with bar graph and line chart is a visual tool for business data analysis, offering insights for presentation, review, and strategic decision-making. Progress decrease vectors Vector art of financial report with bar graph and line chart, showing business data and analysis for presentation and review. A financial report with bar graph and line chart is a visual tool for business data analysis, offering insights for presentation, review, and strategic decision-making
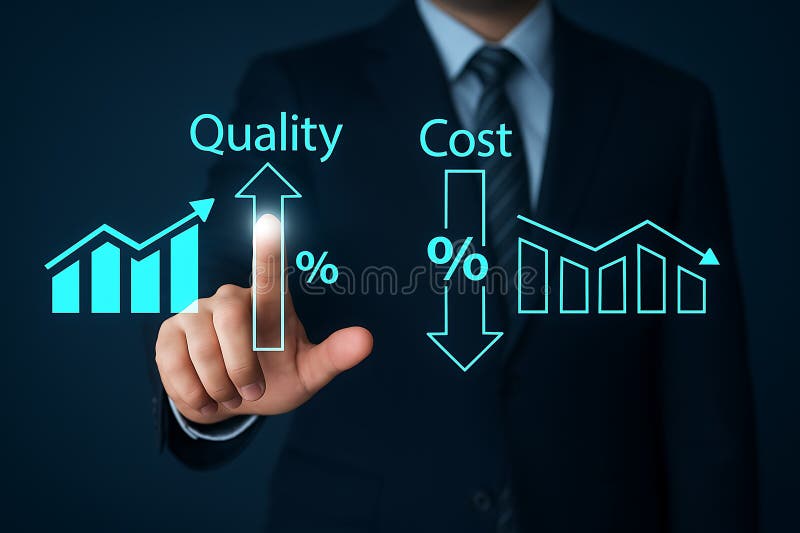
Free with trial Businessman pointing at a digital interface with interactive graphs representing quality and cost, with arrows indicating trends�quality is increasing while cost is decreasing, illustrating a business performance improvement. Progress decrease illustrations Businessman interacting with digital interface showing quality and cost graphs with arrows pointing up and down. businessman pointing at a digital interface with interactive graphs representing quality and cost, with arrows indicating trends�quality is increasing while cost is decreasing, illustrating a business performance improvement
Free with trial Red glossy arrow pointing upwards isolated on white background. Direction guide. Close-up. Progress decrease illustrations Red glossy arrow pointing upwards isolated on white background. Direction guide
Free with trial Red glossy arrow pointing upwards isolated on white background. Direction guide. Close-up. Progress decrease illustrations Red glossy arrow pointing upwards isolated on white background. Direction guide
Free with trial Red glossy arrow pointing upwards isolated on white background. Direction guide. Close-up. Progress decrease illustrations Red glossy arrow pointing upwards isolated on white background. Direction guide
Free with trial Red glossy arrow pointing upwards isolated on white background. Direction guide. Close-up. Progress decrease illustrations Red glossy arrow pointing upwards isolated on white background. Direction guide
Free with trial Red glossy arrow pointing upwards isolated on white background. Direction guide. Close-up. Progress decrease illustrations Red glossy arrow pointing upwards isolated on white background. Direction guide
Free with trial Red glossy arrow pointing upwards isolated on white background. Direction guide. Close-up. Progress decrease illustrations Red glossy arrow pointing upwards isolated on white background. Direction guide
Free with trial Red glossy arrow pointing upwards isolated on white background. Direction guide. Close-up. Progress decrease illustrations Red glossy arrow pointing upwards isolated on white background. Direction guide
Free with trial Red glossy arrow pointing upwards isolated on white background. Direction guide. Close-up. Progress decrease illustrations Red glossy arrow pointing upwards isolated on white background. Direction guide
Free with trial Red glossy arrow pointing upwards isolated on white background. Direction guide. Close-up. Progress decrease illustrations Red glossy arrow pointing upwards isolated on white background. Direction guide
Free with trial A set of line art icons illustrating financial growth, investment strategies, and market analysis, perfect for business presentations and reports with clean design. Progress decrease vectors Vector art of line art icons depicting financial growth, investment strategies, and market analysis, ideal for illustrating. A set of line art icons illustrating financial growth, investment strategies, and market analysis, perfect for business presentations and reports with clean design
Free with trial Line Graph Chart Icon. Data Analysis, Business Growth, And Statistical Trends Outline Symbol. Financial Performance Tracking. Editable Stroke. Isolated Vector Illustration. Progress decrease vectors Line Graph Chart Icon. Data Analysis, Business Growth, And Statistical Trends Outline Symbol. Financial Performance
Free with trial Data funnel filtering process showing percentage drop in prices or conversion rate on isolated black and white design. Progress decrease vectors Data funnel filtering process showing percentage drop in prices or conversion rate on isolated black and white design
Free with trial A striking depiction of a downward trend represented by a red graph line on a textured background, symbolizing market decline ,Generative AI. Progress decrease illustrations A striking depiction of a downward trend represented by a red graph line on a textured background, symbolizing market decline
Free with trial Bar graph showing GDP growth and decline, with flag icons representing countries. Generative Ai. Progress decrease illustrations Bar graph showing GDP growth and decline, with flag icons representing countries
Free with trial Digital tablet displaying real-time gold price chart with line graphs, market indicators. Investment analysis, financial market data, trading concept. Tablet is on gold bars financial. Progress decrease illustrations Digital tablet displaying real-time gold price chart with line graphs, market indicators. Investment analysis, financial market
Free with trial Person analyzes eco strategy for global sustainability on digital tablet. Hands hold futuristic tech device. Earth icon displayed. Data graphs charts show progress in eco development. Progress decrease illustrations Person analyzes eco strategy for global sustainability on digital tablet. Hands hold futuristic tech device. Earth icon
Free with trial Two entrepreneurs created a business strategy to reduce project operational costs using laptops. Cost Reduction concept. trend modern vector flat illustration. Progress decrease vectors Two entrepreneurs created a business strategy to reduce project operational costs using laptops. Cost Reduction concept.
Free with trial Bar graph illustrates GDP growth and decline, marked by country flags for comparison. Generative Ai. Progress decrease illustrations Bar graph illustrates GDP growth and decline, marked by country flags for comparison
Free with trial Businessman pointing at a digital interface with interactive graphs showing quality and cost, where quality is increasing and cost is decreasing, representing trends in business performance, set in a professional and modern workspace. Progress decrease illustrations Businessman interacting with a digital interface showing quality and cost graphs with arrows pointing up and down. businessman pointing at a digital interface with interactive graphs showing quality and cost, where quality is increasing and cost is decreasing, representing trends in business performance, set in a professional and modern workspace
Free with trial Close-up graphic of financial market graph with dynamic lines. Represents investment volatility, uncertainty, stock price fluctuations. Concept of business success, growth failure in. Progress decrease illustrations Close-up graphic of financial market graph with dynamic lines. Represents investment volatility, uncertainty, stock price
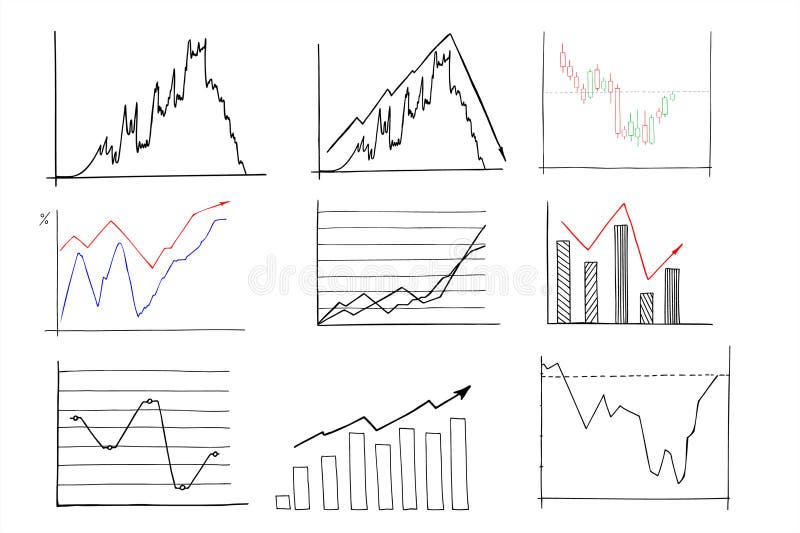
Free with trial Chart line set. Graph, finance report, income growth, economy statistic, diagram, infographic, mind map, data visualization vector illustration. Outline signs of analytic. Editable Stroke. Progress decrease vectors Analytical graphic chart with trend lines, columns set hand drawn ink sketch. Change in time of election results or income, plans. Chart line set. Graph, finance report, income growth, economy statistic, diagram, infographic, mind map, data visualization vector illustration. Outline signs of analytic. Editable Stroke
Free with trial Colorful 3D bar chart illustration on blue background with red, orange, yellow, turquoise bars. Simple, clean geometric shapes represent statistics, business data for reports. Progress decrease illustrations Colorful 3D bar chart illustration on blue background with red, orange, yellow, turquoise bars. Simple, clean geometric shapes
Free with trial Abstract 3D blue graph representing market data fluctuations over time, showing peaks and valleys on a financial report, detailed background Generative AI. Progress decrease illustrations Abstract 3D blue graph representing market data fluctuations over time, showing peaks and valleys on a financial report
Free with trial Green glossy arrow pointing upwards isolated on white background. Direction guide. Close-up. Progress decrease illustrations Green glossy arrow pointing upwards isolated on white background. Direction guide
Free with trial Green glossy arrow pointing upwards isolated on white background. Direction guide. Close-up. Progress decrease illustrations Green glossy arrow pointing upwards isolated on white background. Direction guide
Free with trial Green glossy arrow pointing upwards isolated on white background. Direction guide. Close-up. Progress decrease illustrations Green glossy arrow pointing upwards isolated on white background. Direction guide
Free with trial Green glossy arrow pointing upwards isolated on white background. Direction guide. Close-up. Progress decrease illustrations Green glossy arrow pointing upwards isolated on white background. Direction guide
Free with trial Green glossy arrow pointing upwards isolated on white background. Direction guide. Close-up. Progress decrease illustrations Green glossy arrow pointing upwards isolated on white background. Direction guide
Free with trial Glowing biofuel symbols adorn weathered shipping containers bathed in artificial night light This concept art portrays a sustainable future for global cargo shipping, showcasing eco-friendly transportation powered by renewable biofuels It envisions a cleaner, greener maritime industry, highlighting the potential of alternative energy for international trade AI Generative. Progress decrease illustrations Concept art depicting glowing biofuel symbols on weathered shipping containers under artificial light at night, showcasing. Glowing biofuel symbols adorn weathered shipping containers bathed in artificial night light This concept art portrays a sustainable future for global cargo shipping, showcasing eco-friendly transportation powered by renewable biofuels It envisions a cleaner, greener maritime industry, highlighting the potential of alternative energy for international trade AI Generative
Free with trial A 3D representation of a document displaying a bar chart and a dotted line graph, indicating data trends and analysis. A small, rounded icon featuring a landscape with mountains and a sun is placed ab. Progress decrease illustrations 3d infographic showing a document with a bar chart and line graph, alongside a small image icon, isolated on white background. A 3D representation of a document displaying a bar chart and a dotted line graph, indicating data trends and analysis. A small, rounded icon featuring a landscape with mountains and a sun is placed ab
Free with trial Closeup view of a pen resting on graph, suggesting data analysis or business planning ,Generative AI. Progress decrease illustrations Detailed view of a pen placed on graph, depicting financial analysis, business planning, and data interpretation for strategic. Closeup view of a pen resting on graph, suggesting data analysis or business planning ,Generative AI
Free with trial Declining bar graph illustration showing negative trend of business or economic recession or market crash with downward arrow. Progress decrease vectors Declining bar graph illustration showing negative trend of business or economic recession or market crash with downward arrow
Free with trial Person holding tablet displaying globe with eco data charts. Sustainable tech used for global investment strategy corporate responsibility in environmental governance. Data visualization. Progress decrease illustrations Person holding tablet displaying globe with eco data charts. Sustainable tech used for global investment strategy, corporate. Person holding tablet displaying globe with eco data charts. Sustainable tech used for global investment strategy corporate responsibility in environmental governance. Data visualization.
Free with trial Graph with arrow down outline icon, symbolizing a downward trend or decrease in data. Perfect for financial reports, stock market analysis, and performance tracking. Progress decrease vectors Professional Graph with Downward Arrow Vector Illustration for Business Presentations. Graph with arrow down outline icon, symbolizing a downward trend or decrease in data. Perfect for financial reports, stock market analysis, and performance tracking.
Free with trial Graph with arrow down outline icon, symbolizing a downward trend or decrease in data. Perfect for financial reports, stock market analysis, and performance tracking. Progress decrease vectors Professional Graph with Downward Arrow Vector Illustration for Business Presentations. Graph with arrow down outline icon, symbolizing a downward trend or decrease in data. Perfect for financial reports, stock market analysis, and performance tracking.
Free with trial Graph with arrow down outline icon, symbolizing a downward trend or decrease in data. Perfect for financial reports, stock market analysis, and performance tracking. Progress decrease vectors Professional Graph with Downward Arrow Vector Illustration for Business Presentations. Graph with arrow down outline icon, symbolizing a downward trend or decrease in data. Perfect for financial reports, stock market analysis, and performance tracking.
Free with trial Hand puts coins on wooden cube stairs. Growth of savings, financial planning, investment, pension contribution. Long term future vision, capital rise, retirement savings, wealth. Progress decrease illustrations Hand puts coins on wooden cube stairs. Growth of savings, financial planning, investment, pension contribution. Long term future
Free with trial Stack of coins with a red downward arrow, illustrating the effect of falling interest rates on savings, Generative AI. Progress decrease illustrations Stack of coins with a red downward arrow, illustrating the effect of falling interest rates on savings
Free with trial A wall display of framed blue data charts and graphs showing various financial trends and statistical information. A captivating fusion of imagination and modern design aesthetics. Generative AI. Progress decrease illustrations A wall display of framed blue data charts and graphs showing various financial trends and statistical information. Generative AI. A wall display of framed blue data charts and graphs showing various financial trends and statistical information. A captivating fusion of imagination and modern design aesthetics. Generative AI
Free with trial This bar graph visually represents a declining trend, effectively conveying data reduction and downward progression for analytical purposes and interpretation. Progress decrease vectors Vector art of declining bar graph showing a downward trend in data representation and visualization for statistical analysis. This bar graph visually represents a declining trend, effectively conveying data reduction and downward progression for analytical purposes and interpretation
Free with trial A sleek logo featuring the letter C integrated with chart bars, symbolizing financial growth and business analytics, suitable for finance or investment companies. Progress decrease vectors Vector art of modern logo design with letter c and chart bars, representing financial growth and business success in a minimalist. A sleek logo featuring the letter C integrated with chart bars, symbolizing financial growth and business analytics, suitable for finance or investment companies
Free with trial Tree illustration with bar graph displaying reduced carbon emissions from wood pellets, Generated by AI. Progress decrease illustrations Tree illustration with bar graph displaying reduced carbon emissions from wood pellets
Free with trial Business strategy with digital tech tools. Hands working on tablet analyzing data, graphs for cost management. Planning effective project management data analysis. Improving business. Progress decrease illustrations Business strategy with digital tech tools. Hands working on tablet analyzing data, graphs for cost management. Planning effective
Free with trial Illumination progression a series of glowing vintage bulbs arranged in descending size against a textured background. An elegant digital composition reflecting contemporary artistic sensibilities. Generative AI. Progress decrease illustrations Illumination progression a series of glowing vintage bulbs arranged in descending size against a textured background. Generative. Illumination progression a series of glowing vintage bulbs arranged in descending size against a textured background. An elegant digital composition reflecting contemporary artistic sensibilities. Generative AI
Free with trial The red futuristic with neon lights background for the economic crisis, a bearish trend. Hi-tech backdrop. Generative AI. Progress decrease illustrations The red futuristic with neon lights background for the economic crisis, a bearish trend. Hi-tech backdrop. Generative AI
Free with trial The red futuristic with neon lights background for the economic crisis, a bearish trend. Hi-tech backdrop. Generative AI. Progress decrease illustrations The red futuristic with neon lights background for the economic crisis, a bearish trend. Hi-tech backdrop. Generative AI
Free with trial The red futuristic with neon lights background for the economic crisis, a bearish trend. Hi-tech backdrop. Generative AI. Progress decrease illustrations The red futuristic with neon lights background for the economic crisis, a bearish trend. Hi-tech backdrop. Generative AI
Free with trial Graph going Up and Down sign with green and red arrows vector. Flat design vector illustration concept of sales bar chart symbol icon with arrow moving down and sales bar chart with arrow moving up. Progress decrease vectors Graph going Up and Down sign with green and red arrows vector. Flat design vector illustration concept of sales bar chart symbol
Free with trial Three bowler hats of different sizes (small, medium, large) in a row, symbolizing growth, choice, family values, or evolution. AI picture - created with the help of artificial intelligence technologies. Progress decrease vectors Three bowler hats of different sizes (small, medium, large) in a row, symbolizing growth, choice and evolution. Three bowler hats of different sizes (small, medium, large) in a row, symbolizing growth, choice, family values, or evolution. AI picture - created with the help of artificial intelligence technologies.
Free with trial Three bowler hats of different sizes (small, medium, large) in a row, symbolizing growth, choice, family values, or evolution. AI picture - created with the help of artificial intelligence technologies. Progress decrease vectors Three bowler hats of different sizes (small, medium, large) in a row, symbolizing growth, choice and evolution. Three bowler hats of different sizes (small, medium, large) in a row, symbolizing growth, choice, family values, or evolution. AI picture - created with the help of artificial intelligence technologies.
Free with trial Three bowler hats of different sizes (small, medium, large) in a row, symbolizing growth, choice, family values, or evolution. AI picture - created with the help of artificial intelligence technologies. Progress decrease vectors Three bowler hats of different sizes (small, medium, large) in a row, symbolizing growth, choice and evolution. Three bowler hats of different sizes (small, medium, large) in a row, symbolizing growth, choice, family values, or evolution. AI picture - created with the help of artificial intelligence technologies.
Free with trial Financial graph with blue and red pointers, Business strategy, Business concept, Price increase, Price decrease. Progress decrease vectors Financial graph with blue and red pointers, Business strategy, Business concept
Free with trial A glowing red zigzag arrow points downward, representing a decline on a digital financial chart. The surface is gridded and dark, highlighting the red of the arrow. The arrow has a neon-like appearance and reflects off the glossy surface, signaling a decrease in value. The surrounding chart includes descending graphical elements indicating fluctuating data, conveying a downturn in financial performance or market trends. Progress decrease illustrations A large red arrow points downwards over a gridded financial chart showing a sharp decline in value. A glowing red zigzag arrow points downward, representing a decline on a digital financial chart. The surface is gridded and dark, highlighting the red of the arrow. The arrow has a neon-like appearance and reflects off the glossy surface, signaling a decrease in value. The surrounding chart includes descending graphical elements indicating fluctuating data, conveying a downturn in financial performance or market trends.
Free with trial A glowing red zigzag arrow points downward, representing a decline on a digital financial chart. The surface is gridded and dark, highlighting the red of the arrow. The arrow has a neon-like appearance and reflects off the glossy surface, signaling a decrease in value. The surrounding chart includes descending graphical elements indicating fluctuating data, conveying a downturn in financial performance or market trends. Progress decrease illustrations A large red arrow points downwards over a gridded financial chart showing a sharp decline in value. A glowing red zigzag arrow points downward, representing a decline on a digital financial chart. The surface is gridded and dark, highlighting the red of the arrow. The arrow has a neon-like appearance and reflects off the glossy surface, signaling a decrease in value. The surrounding chart includes descending graphical elements indicating fluctuating data, conveying a downturn in financial performance or market trends.
Free with trial A glowing red zigzag arrow points downward, representing a decline on a digital financial chart. The surface is gridded and dark, highlighting the red of the arrow. The arrow has a neon-like appearance and reflects off the glossy surface, signaling a decrease in value. The surrounding chart includes descending graphical elements indicating fluctuating data, conveying a downturn in financial performance or market trends. Progress decrease illustrations A large red arrow points downwards over a gridded financial chart showing a sharp decline in value. A glowing red zigzag arrow points downward, representing a decline on a digital financial chart. The surface is gridded and dark, highlighting the red of the arrow. The arrow has a neon-like appearance and reflects off the glossy surface, signaling a decrease in value. The surrounding chart includes descending graphical elements indicating fluctuating data, conveying a downturn in financial performance or market trends.
Free with trial A glowing red zigzag arrow points downward, representing a decline on a digital financial chart. The surface is gridded and dark, highlighting the red of the arrow. The arrow has a neon-like appearance and reflects off the glossy surface, signaling a decrease in value. The surrounding chart includes descending graphical elements indicating fluctuating data, conveying a downturn in financial performance or market trends. Progress decrease illustrations A large red arrow points downwards over a gridded financial chart showing a sharp decline in value. A glowing red zigzag arrow points downward, representing a decline on a digital financial chart. The surface is gridded and dark, highlighting the red of the arrow. The arrow has a neon-like appearance and reflects off the glossy surface, signaling a decrease in value. The surrounding chart includes descending graphical elements indicating fluctuating data, conveying a downturn in financial performance or market trends.
Free with trial A glowing red zigzag arrow points downward, representing a decline on a digital financial chart. The surface is gridded and dark, highlighting the red of the arrow. The arrow has a neon-like appearance and reflects off the glossy surface, signaling a decrease in value. The surrounding chart includes descending graphical elements indicating fluctuating data, conveying a downturn in financial performance or market trends. Progress decrease illustrations A large red arrow points downwards over a gridded financial chart showing a sharp decline in value. A glowing red zigzag arrow points downward, representing a decline on a digital financial chart. The surface is gridded and dark, highlighting the red of the arrow. The arrow has a neon-like appearance and reflects off the glossy surface, signaling a decrease in value. The surrounding chart includes descending graphical elements indicating fluctuating data, conveying a downturn in financial performance or market trends.