Gratis med prøveperiode Discount trade chart and credit card icons set dot plot sign special offer market data payment vector simple halftone dots button discount trade chart and credit card icons set dot plot sign special offer market data payment vector simple halftone dots button.
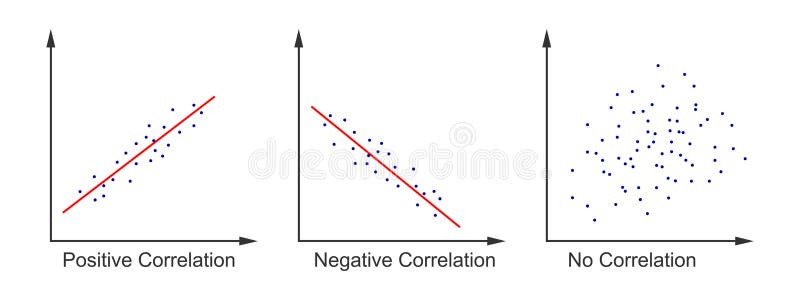
Gratis med prøveperiode Set of scatter plot diagrams scattergrams with different types of variables correlation data points plotted on a horizontal and set of scatter plot diagrams scattergrams with different types of variables correlation data points plotted on a horizontal and.
Gratis med prøveperiode Discount trade chart and credit card icons set dot plot sign special offer market data payment vector simple button with halftone discount trade chart and credit card icons set dot plot sign special offer market data payment vector simple button with halftone.
Gratis med prøveperiode Data visualization outline icons collection chart graph map plot diagram vector and illustration concept line linear analysis data visualization outline icons collection chart graph map plot diagram vector and illustration concept line linear analysis.
Gratis med prøveperiode Data visualization outline icons collection chart graph map plot diagram vector and illustration concept line linear analysis data visualization outline icons collection chart graph map plot diagram vector and illustration concept line linear analysis.
Gratis med prøveperiode Data visualization outline icons collection chart graph map plot diagram vector and illustration concept line linear analysis data visualization outline icons collection chart graph map plot diagram vector and illustration concept line linear analysis.
Gratis med prøveperiode Data visualization outline icons collection chart graph map plot diagram vector and illustration concept line linear analysis data visualization outline icons collection chart graph map plot diagram vector and illustration concept line linear analysis.
Gratis med prøveperiode Box plot introduction to data analysis by using the box plot introduction to data analysis by using the.
Gratis med prøveperiode Outlier graphic result as different statistics data point tiny person concept outlier graphic result as different statistics data outlier graphic result as different statistics data point tiny person concept outlier graphic result as different statistics data.
Gratis med prøveperiode Data complexity visual representation big abstract concept radial plot graphic background eps data complexity visual representation big abstract concept radial plot graphic background eps.
Gratis med prøveperiode Visualisering af big data konceptet. Abstrakt datadiagram. Kompleks radial informationsrepræsentation. Visuel big data analyse. Videnskabelig baggrund. Big data visualisering. Abstrakt datadiagram. Radial plot. Visuel big data analyse. Visualisering af big data konceptet. Abstrakt datadiagram. Kompleks radial informationsrepræsentation. Visuel big data analyse. Videnskabelig baggrund
Gratis med prøveperiode D rendering big data visualization digital threads plot network d rendering big data visualization digital threads plot network.
Gratis med prøveperiode D rendering big data visualization digital threads plot network d rendering big data visualization digital threads plot network.
Gratis med prøveperiode Big data visualization complex concept abstract information diagram visual analysis vector radial plot science technology big data visualization complex concept abstract information diagram visual analysis vector radial plot science technology.
Gratis med prøveperiode Complex data visual representation big visualization abstract radial plot graphic background vector illustration complex data visual representation big visualization abstract radial plot graphic background vector illustration.
Gratis med prøveperiode Big data concept visualization complexity representation abstract radial plot graphic background vector illustration big data concept visualization complexity representation abstract radial plot graphic background vector illustration.
Gratis med prøveperiode Big data visualization concept infographics digital design analysis representation abstract diagram radial scatter p plot big data visualization concept infographics digital design analysis representation abstract diagram radial scatter p plot.
Gratis med prøveperiode Complex data visual representation big data visualization abstract data radial plot complex data visual representation big data complex data visual representation big data visualization abstract data radial plot complex data visual representation big data.
Gratis med prøveperiode Big data visualization futuristic infographic complex information digital design visual complexity abstract plot graph science stockillustration big data visualization futuristic infographic complex information digital design visual complexity abstract plot graph science
Gratis med prøveperiode Datakompleksitetsrepræsentation. Visualisering af Big Data-konceptet. Abstrakt analysekoncept. Grafisk baggrund. Datakompleksitetsrepræsentation. Visualisering af Big Data-konceptet. Abstrakt analysekoncept. Radial plot. Datakompleksitetsrepræsentation. Visualisering af Big Data-konceptet. Abstrakt analysekoncept. Grafisk baggrund
Gratis med prøveperiode Big data complexity visual representation visualization radial plot graphic abstract background vector illustration big data complexity visual representation visualization radial plot graphic abstract background vector illustration.
Gratis med prøveperiode Data complexity visual representation big visualization abstract plot radial scatter graphic background vector illustration data complexity visual representation big visualization abstract plot radial scatter graphic background vector illustration.
Gratis med prøveperiode Digital interface with circular graph bar graph and scatter plot displaying various data points and trends the image presents a digital interface with circular graph bar graph and scatter plot displaying various data points and trends the image presents a.
Gratis med prøveperiode Big data concept visualization complexity representation abstract radial plot advanced analysis graphic background vector big data concept visualization complexity representation abstract radial plot advanced analysis graphic background vector.
Gratis med prøveperiode Complex big data visual representation visualization abstract radial plot background graphic vector illustration complex big data visual representation visualization abstract radial plot background graphic vector illustration.
Gratis med prøveperiode Big data ray light with code visual information complexity intricate data threads plot social network or business analytics big data ray light with code visual information complexity intricate data threads plot social network or business analytics.
Gratis med prøveperiode Big data complexity visual representation advanced analytics visualization beauty of abstract radial plot graphic background royalty-free illustration big data complexity visual representation advanced analytics visualization beauty of abstract radial plot graphic background
Gratis med prøveperiode Data complexity visual representation big visualization advanced analytics abstract radial plot graphic background vector vectorillustration data complexity visual representation big visualization advanced analytics abstract radial plot graphic background vector
Gratis med prøveperiode Vector abstract colorful big data point plot visualization futuristic infographics design visual information complexity intricate vector abstract colorful big data point plot visualization futuristic infographics design visual information complexity intricate.
Gratis med prøveperiode Vector abstract colorful big data point plot visualization futuristic infographics design visual information complexity intricate vector abstract colorful big data point plot visualization futuristic infographics design visual information complexity intricate.
Gratis med prøveperiode Big data orange plot visualization futuristic infographic information aesthetic design visual data complexity complex threads big data orange plot visualization futuristic infographic information aesthetic design visual data complexity complex threads.
Gratis med prøveperiode Data analysis laptop and dot plot icons set creative idea sign vector simple magnifying glass mobile computer presentation graph data analysis laptop and dot plot icons set creative idea sign vector simple magnifying glass mobile computer presentation graph.
Gratis med prøveperiode Dot plot diagram ui element template editable isolated vector dashboard component flat user interface visual data presentation web dot plot diagram ui element template editable isolated vector dashboard component flat user interface visual data presentation web.
Gratis med prøveperiode Vector abstract colorful big data point plot visualization futuristic infographics design visual information complexity intricate stockillustration vector abstract colorful big data point plot visualization futuristic infographics design visual information complexity intricate
Gratis med prøveperiode Big data brown plot visualization futuristic infographic information aesthetic design visual data complexity complex threads big data brown plot visualization futuristic infographic information aesthetic design visual data complexity complex threads.
Gratis med prøveperiode Graph sign rising curve plot hand drawn business growth simple vector illustration integration derivation mathematics logarithmic graph sign rising curve plot hand drawn business growth simple vector illustration integration derivation mathematics logarithmic.
Gratis med prøveperiode Recovery data dot plot and smartwatch icons set talk bubble sign vector simple people shapes timeline backup info presentation recovery data dot plot and smartwatch icons set talk bubble sign vector simple people shapes timeline backup info presentation.
Gratis med prøveperiode Dot plot ui element template editable isolated vector dashboard component flat user interface visual data presentation web design dot plot ui element template editable isolated vector dashboard component flat user interface visual data presentation web design.
Gratis med prøveperiode Vector abstract colorful big data point plot visualization futuristic infographics design visual information complexity intricate stockillustration vector abstract colorful big data point plot visualization futuristic infographics design visual information complexity intricate
Gratis med prøveperiode Set of finance flat icons payment loyalty card and dot plot elements for web application design vector star cashback update data set of finance flat icons payment loyalty card and dot plot elements for web application design vector star cashback update data.
Gratis med prøveperiode Big data plot grayscale visualization futuristic infographic information aesthetic design visual data complexity complex big data plot grayscale visualization futuristic infographic information aesthetic design visual data complexity complex.
Gratis med prøveperiode Big data blue plot visualization futuristic infographic information aesthetic design visual data complexity complex threads big data blue plot visualization futuristic infographic information aesthetic design visual data complexity complex threads.
Gratis med prøveperiode Calculator target dot plot and graph chart line icons set infographic financial data graphic creativity concept sign audit calculator target dot plot and graph chart line icons set infographic financial data graphic creativity concept sign audit.
Gratis med prøveperiode Dot plot infographic chart design template set spreading indicator research numbers economic indicators visual data presentation dot plot infographic chart design template set spreading indicator research numbers economic indicators visual data presentation.
Gratis med prøveperiode Scatter plot infographic chart design template trend identification society change infochart with vertical bar graphs visual data scatter plot infographic chart design template trend identification society change infochart with vertical bar graphs visual data.
Gratis med prøveperiode Data analysis laptop and dot plot icons set creative idea sign vector infographic timeline simple magnifying glass mobile computer data analysis laptop and dot plot icons set creative idea sign vector infographic timeline simple magnifying glass mobile computer.
Gratis med prøveperiode Big data futuristic info graphics aesthetic design visual information complexity intricate threads plot business analytics big data futuristic info graphics aesthetic design visual information complexity intricate threads plot business analytics.
Gratis med prøveperiode Scatter plot infographic chart design template for dark theme trend identification society change infochart with vertical bar scatter plot infographic chart design template for dark theme trend identification society change infochart with vertical bar.
Gratis med prøveperiode Analytics reporting showing pie chart bar graph plot chat icons for business and or intelligence sales operations data statistics analytics reporting showing pie chart bar graph plot chat icons for business and or intelligence sales operations data statistics.
Gratis med prøveperiode Horizontal dot plot infographic chart design template six categories values editable infochart with bar graphs visual data horizontal dot plot infographic chart design template six categories values editable infochart with bar graphs visual data.
Gratis med prøveperiode Scatter vector also known as scatter plot scatter vector also known as scatter plot is a graph used to show related data between scatter vector also known as scatter plot scatter vector also known as scatter plot is a graph used to show related data between.
Gratis med prøveperiode Scatter vector also known as scatter plot scatter vector also known as scatter plot is a graph used to show related data between scatter vector also known as scatter plot scatter vector also known as scatter plot is a graph used to show related data between.
Gratis med prøveperiode Scatter vector also known as scatter plot scatter vector also known as scatter plot is a graph used to show related data between scatter vector also known as scatter plot scatter vector also known as scatter plot is a graph used to show related data between.
Gratis med prøveperiode Scatter vector also known as scatter plot scatter vector also known as scatter plot is a graph used to show related data between scatter vector also known as scatter plot scatter vector also known as scatter plot is a graph used to show related data between.
Gratis med prøveperiode Scatter vector also known as scatter plot scatter vector also known as scatter plot is a graph used to show related data between scatter vector also known as scatter plot scatter vector also known as scatter plot is a graph used to show related data between.
Gratis med prøveperiode Scatter vector also known as scatter plot scatter vector also known as scatter plot is a graph used to show related data between scatter vector also known as scatter plot scatter vector also known as scatter plot is a graph used to show related data between.
Gratis med prøveperiode Scatter vector also known as scatter plot scatter vector also known as scatter plot is a graph used to show related data between scatter vector also known as scatter plot scatter vector also known as scatter plot is a graph used to show related data between.
Gratis med prøveperiode Scatter vector also known as scatter plot scatter vector also known as scatter plot is a graph used to show related data between scatter vector also known as scatter plot scatter vector also known as scatter plot is a graph used to show related data between.
Gratis med prøveperiode Scatter vector also known as scatter plot scatter vector also known as scatter plot is a graph used to show related data between scatter vector also known as scatter plot scatter vector also known as scatter plot is a graph used to show related data between.
Gratis med prøveperiode Scatter vector also known as scatter plot scatter vector also known as scatter plot is a graph used to show related data between scatter vector also known as scatter plot scatter vector also known as scatter plot is a graph used to show related data between.
Gratis med prøveperiode Scatter vector also known as scatter plot scatter vector also known as scatter plot is a graph used to show related data between scatter vector also known as scatter plot scatter vector also known as scatter plot is a graph used to show related data between.
Gratis med prøveperiode Scatter vector also known as scatter plot scatter vector also known as scatter plot is a graph used to show related data between scatter vector also known as scatter plot scatter vector also known as scatter plot is a graph used to show related data between.
Gratis med prøveperiode Scatter vector also known as scatter plot scatter vector also known as scatter plot is a graph used to show related data between scatter vector also known as scatter plot scatter vector also known as scatter plot is a graph used to show related data between.
Gratis med prøveperiode Scatter vector also known as scatter plot scatter vector also known as scatter plot is a graph used to show related data between scatter vector also known as scatter plot scatter vector also known as scatter plot is a graph used to show related data between.
Gratis med prøveperiode Scatter vector also known as scatter plot scatter vector also known as scatter plot is a graph used to show related data between scatter vector also known as scatter plot scatter vector also known as scatter plot is a graph used to show related data between.
Gratis med prøveperiode Scatter vector also known as scatter plot scatter vector also known as scatter plot is a graph used to show related data between scatter vector also known as scatter plot scatter vector also known as scatter plot is a graph used to show related data between.
Gratis med prøveperiode Scatter vector also known as scatter plot scatter vector also known as scatter plot is a graph used to show related data between scatter vector also known as scatter plot scatter vector also known as scatter plot is a graph used to show related data between.
Gratis med prøveperiode Big data plot colorful visualization futuristic infographic information aesthetic design visual data complexity complex stockillustration big data plot colorful visualization futuristic infographic information aesthetic design visual data complexity complex
Gratis med prøveperiode Time dot plot and unlock system line icons for website printing design vector collection of organic tested sick man diagram graph time dot plot and unlock system line icons for website printing design vector collection of organic tested sick man diagram graph.
Gratis med prøveperiode Horizontal dot plot infographic chart design template for dark theme six categories editable infochart with bar graphs visual data horizontal dot plot infographic chart design template for dark theme six categories editable infochart with bar graphs visual data.
Gratis med prøveperiode Big data plot colorful visualization futuristic infographic information aesthetic design visual data complexity complex big data plot colorful visualization futuristic infographic information aesthetic design visual data complexity complex.
Gratis med prøveperiode Big data plot colorful visualization futuristic infographic information aesthetic design visual data complexity complex big data plot colorful visualization futuristic infographic information aesthetic design visual data complexity complex.
Gratis med prøveperiode Data analysis laptop and dot plot icons set creative idea sign vector simple magnifying glass mobile computer presentation graph data analysis laptop and dot plot icons set creative idea sign vector simple magnifying glass mobile computer presentation graph.
Gratis med prøveperiode En computerskærm fyldt med flere linjer og prikker, der repræsenterer komplekse data og mønstre, et spredningsdiagram, der viser korrelationen mellem markedsvolatilitet og handelsvolumen, AI-genereret. En computerskærm fyldt med flere linjer og prikker, der repræsenterer komplekse data og mønstre, et spredningsdiagram, der viser
Gratis med prøveperiode Wallet sharing economy and dot plot minimal line icons for web application printing vector yellow abstract background world money wallet sharing economy and dot plot minimal line icons for web application printing vector yellow abstract background world money.
Gratis med prøveperiode Set of airplane dot plot and payment protection line icons for web app pictogram icon vector parking security shield approved set of airplane dot plot and payment protection line icons for web app pictogram icon vector parking security shield approved.
Gratis med prøveperiode Data analysis laptop and dot plot icons set creative idea sign vector do or stop data analysis laptop and dot plot icons simple data analysis laptop and dot plot icons set creative idea sign vector do or stop data analysis laptop and dot plot icons simple.
Gratis med prøveperiode Data analysis laptop and dot plot icons set creative idea sign vector simple comparison table magnifying glass mobile computer data analysis laptop and dot plot icons set creative idea sign vector simple comparison table magnifying glass mobile computer.
Gratis med prøveperiode En detaljeret visning af et søjlediagram, der vises på en computerskærm, der viser data og tendenser, et spredningsdiagram, der viser korrelationen mellem markedsvolatilitet og handelsvolumen, AI-genereret. En detaljeret visning af et søjlediagram, der vises på en computerskærm, der viser data og tendenser
Gratis med prøveperiode Sæt af lineære ikoner til brugergrænseflade. Indeholder tynde linjer til forbundne data, cirkulær grænseflade til cirkeldiagrammer, datakodning, strøm, boksplottets grænseflade, dataanalyse med dobbelte søjler, søjler og stigende linje Sæt af lineære ikoner til brugergrænseflade. Indeholder tynde linjer til forbundne data, cirkulær grænseflade til cirkeldiagrammer
 Log ind