Royalty-Free AI generated
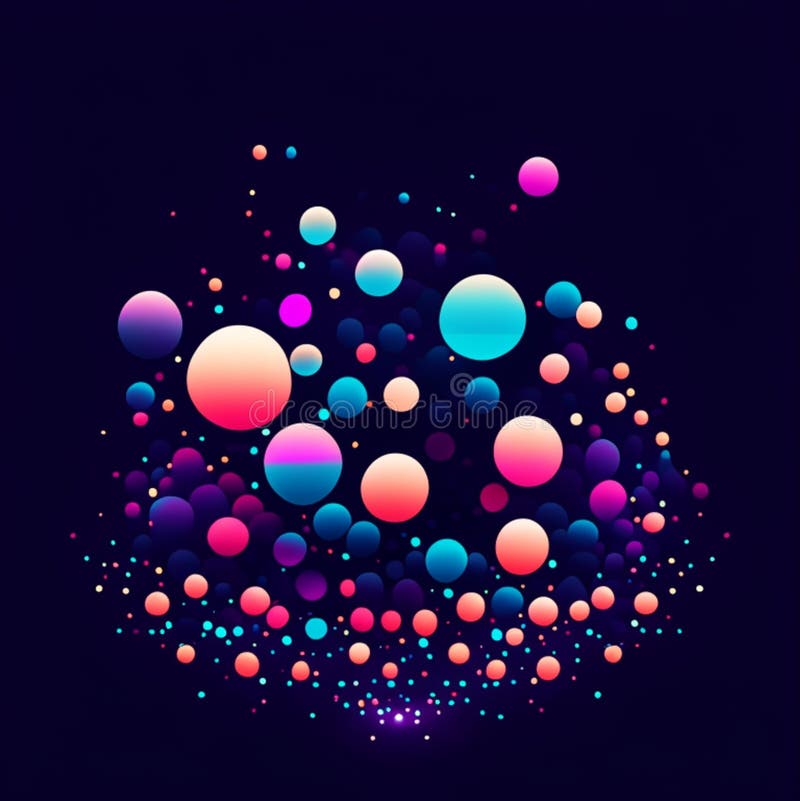
Scatter , also known as scatter plot, is a graph used to show related data between pairs of variables. using points or points on a two-dimensional plane The horizontal axis represents the value of the first variable. and the vertical axis represents the value of the second variable. with the distribution of points according to the specified position We can consider the trend or the relationship between the two variables can be obtained from the dot scatter scheme in the scatter. generative ai Illustration
- ?
$62.50USD
$150.00USD
$250.00USD
Size MAX
3463x3464px •
11.5" x 11.5" • @300dpi •
817kB • jpg
Author credit line


