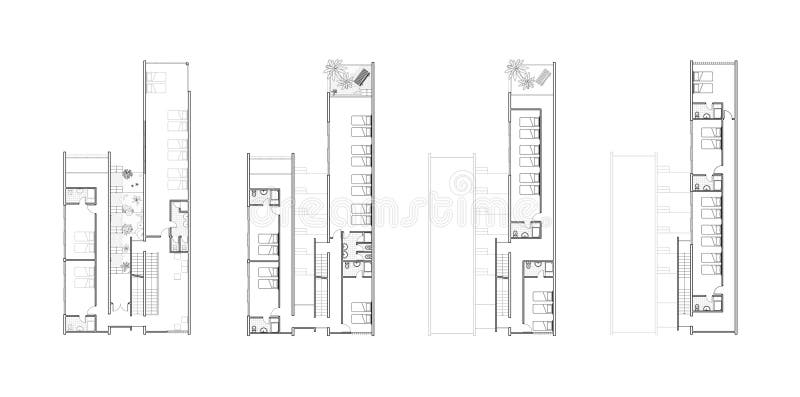
Free with trial Floor plans of an architectural design. First, second, third, and fourth floor plans of a youth hostel architectural design. Plot vectors Floor plans of an architectural design. First, second, third, and fourth floor plans of a youth hostel architectural design
Free with trial Database , Data & Graph icon set in thin line style. Graphic design Vector illustration. Plot vectors Database , Data & Graph icon set in thin line style. Graphic design Vector illustration
Free with trial Chemistry seamless. Vector illustration of seamless chemistry formulas on the black slate background. Plot vectors Chemistry seamless. Vector illustration of seamless chemistry formulas on the black slate background
Free with trial Singing online class isolated cartoon vector illustration. Music theatre virtual camp, singing online course, art summer program for kids, digital education, remote learning vector cartoon. Plot vectors Singing online class isolated cartoon vector illustration. Music theatre virtual camp, singing online course, art summer program for kids, digital education
Free with trial Twelve data visualization icons, each with a distinct focus: bar chart, pie chart, line graph, dashboard, rising trend, area chart, donut chart, target & KPI, database & coins, conversion funnel, comparison chart, user analytics, scatter plot, reports & data, gauge metric, and performance gear. Each icon features concise symbols and indicators relevant to data analysis, such as graphs, charts, targets, and gears, designed with a clean and modern aesthetic for effective representation of analytics concepts. Plot vectors Data Visualization Icons Charts And Analytics With Bar Chart. Twelve data visualization icons, each with a distinct focus: bar chart, pie chart, line graph. Twelve data visualization icons, each with a distinct focus: bar chart, pie chart, line graph, dashboard, rising trend, area chart, donut chart, target & KPI, database & coins, conversion funnel, comparison chart, user analytics, scatter plot, reports & data, gauge metric, and performance gear. Each icon features concise symbols and indicators relevant to data analysis, such as graphs, charts, targets, and gears, designed with a clean and modern aesthetic for effective representation of analytics concepts.
Free with trial Set line Geometric figure Pentagonal prism Chalkboard Test or exam sheet Equation solution Function mathematical symbol Human brain Sphere and Mathematics function sine icon. Vector. Plot vectors Set line Geometric figure Pentagonal prism, Chalkboard, Test or exam sheet, Equation solution, Function mathematical. Set line Geometric figure Pentagonal prism. Set line Geometric figure Pentagonal prism Chalkboard Test or exam sheet Equation solution Function mathematical symbol Human brain Sphere and Mathematics function sine icon. Vector.
Free with trial Guide dog isolated cartoon vector illustration. Seeing eye, mobility training class, visually impaired teenager walks with guide dog, assistance animal for blind children vector cartoon. Plot vectors Guide dog isolated cartoon vector illustration. Seeing eye, mobility training class, visually impaired teenager walks with guide dog, assistance animal for
Free with trial Overweight isolated cartoon vector illustration. Girl standing on weights with unhappy face, nutrition problem, floor scales indoors, weight controlling, healthy lifestyle vector cartoon. Plot vectors Overweight isolated cartoon vector illustration. Girl standing on weights with unhappy face, nutrition problem, floor scales indoors, weight controlling
Free with trial Learning to stand up isolated cartoon vector illustration. Infant learns to stand up with support, baby development milestone, nursery facility, kindergarten, early childhood vector cartoon. Plot vectors Learning to stand up isolated cartoon vector illustration. Infant learns to stand up with support, baby development milestone, nursery facility, kindergarten
Free with trial Personalized customer experience isolated cartoon vector illustrations. Smiling woman deals with e-commerce personalization, CRM system, marketing management, IT technology vector cartoon. Plot vectors Personalized customer experience isolated cartoon vector illustrations. Smiling woman deals with e-commerce personalization, CRM system, marketing management
Free with trial Teeth dentures implants isolated concept vector illustration. Denture implant, teeth whitening, tooth permanent replacement, cosmetic dentistry, orthodontic care procedure vector concept. Plot vectors Teeth dentures implants isolated concept vector illustration. Denture implant, teeth whitening, tooth permanent replacement, cosmetic dentistry, orthodontic
Free with trial Beard treatment isolated cartoon vector illustrations. Professional barber applies oil for beard to client, appearance and hygiene care, treatment process, beauty procedures vector cartoon. Plot vectors Beard treatment isolated cartoon vector illustrations. Professional barber applies oil for beard to client, appearance and hygiene care, treatment process
Free with trial Set of greenhouses for plants. Isometric Facilities farm and garden with plants, vegetables. Vector graphics. Plot vectors Set of greenhouses for plants. Isometric Facilities farm and garden with plants, vegetables. Vector graphics
Free with trial Cycling smartglasses isolated cartoon vector illustrations. Man riding a bike and wearing smart glasses, smart city transportation, Internet of Things, modern cycling technology vector cartoon. Plot vectors Cycling smartglasses isolated cartoon vector illustrations. Man riding a bike and wearing smart glasses, smart city transportation, Internet of Things, modern
Free with trial Pet shelter, Management and Dot plot line icons set. Secure shield and Money currency exchange. Messages, Search and Employees messenger icons. Fireworks, Time management and Ssd signs. Vector. Plot vectors Pet shelter, Management and Dot plot line icons set. Vector. Pet shelter, Management and Dot plot line icons set. Secure shield and Money currency exchange. Pet shelter, Management and Dot plot line icons set. Secure shield and Money currency exchange. Messages, Search and Employees messenger icons. Fireworks, Time management and Ssd signs. Vector
Free with trial Terracotta Red and White Watercolor Shoji Design. Kimono Tile. Organic Minimal Grid. Shibori Seamless Pattern. Tie Dye Abstract Texture. Batik Tie Dye Border. Stencil Japan Background. Plot vectors Tie Dye Pattern. Terracotta Red and White Watercolor Shoji Design. Kimono Tile. Organic Minimal Grid. Shibori Seamless Pattern. Tie Dye Abstract Texture. Batik. Terracotta Red and White Watercolor Shoji Design. Kimono Tile. Organic Minimal Grid. Shibori Seamless Pattern. Tie Dye Abstract Texture. Batik Tie Dye Border. Stencil Japan Background.
Free with trial Challenge isolated cartoon vector illustration. Raising children, child learns to walk, baby challenged to reach out for toy, parents encourage kid to come closer, family life vector cartoon. Plot vectors Challenge isolated cartoon vector illustration. Raising children, child learns to walk, baby challenged to reach out for toy, parents encourage kid to come
Free with trial A clean line art vector illustration depicting people tending to a shared community garden plot. This minimalist design emphasizes sustainable practices, collaboration, and outdoor activity. Perfect for environmental reports, educational materials on organic farming, or simple, charming visuals for community-focused projects. Versatile for various digital media, vector design Generative AI. Plot vectors Line art: People gardening in shared community plot, vector design Generative AI. A clean line art vector illustration depicting people tending to a shared. A clean line art vector illustration depicting people tending to a shared community garden plot. This minimalist design emphasizes sustainable practices, collaboration, and outdoor activity. Perfect for environmental reports, educational materials on organic farming, or simple, charming visuals for community-focused projects. Versatile for various digital media, vector design Generative AI
Free with trial VR in entertainment isolated cartoon vector illustrations. Man in VR glasses playing game, virtual racing, virtual and augmented reality, modern technology, leisure time vector cartoon. Plot vectors VR in entertainment isolated cartoon vector illustrations. Man in VR glasses playing game, virtual racing, virtual and augmented reality, modern technology
Free with trial EPS 10 Stock vector illustration, Clip art graphics. Plot vectors Simple pie chart-graph and diagram vector illustration. circle segmented, divided from 2 to 20 section, segment, portion or sector. EPS 10 Stock vector. EPS 10 Stock vector illustration, Clip art graphics
Free with trial Pedal boat isolated cartoon vector illustration. Family riding small catamaran, pedal boat slide for kids, having fun, sea cycle rental, water bike tour, summer resort activity vector cartoon. Plot vectors Pedal boat isolated cartoon vector illustration. Family riding small catamaran, pedal boat slide for kids, having fun, sea cycle rental, water bike tour
Free with trial Background with equipment for gardening and horticulture. White, flat drawings on a yellow field. Arrangement of land. Plot vectors Landscape design, seamless background, yellow, vector. Background with equipment for gardening and horticulture. White, flat drawings on a yellow field. Background with equipment for gardening and horticulture. White, flat drawings on a yellow field. Arrangement of land.
Free with trial Halftone pixel dotted circle plot icon. White pictogram with pixel geometric structure on a black background. Vector dotted circle plot icon combined of circle elements. Plot vectors White Halftone Dotted Circle Plot Icon. Halftone pixel dotted circle plot icon. White pictogram with pixel geometric structure on a black background. Vector. Halftone pixel dotted circle plot icon. White pictogram with pixel geometric structure on a black background. Vector dotted circle plot icon combined of circle elements.
Free with trial Education icons set. Included icon as Facts, Lgbt and Video conference web elements. Online survey, Stress, Fake news icons. Court judge, Secure mail, Document attachment web signs. Vector. Plot vectors Education icons set. Included icon as Facts, Lgbt and Video conference web elements. For website app. Vector. Education icons set. Included icon as Facts, Lgbt. Education icons set. Included icon as Facts, Lgbt and Video conference web elements. Online survey, Stress, Fake news icons. Court judge, Secure mail, Document attachment web signs. Vector
Free with trial Black and white simple line art logo of a plant growing on a plot of land in an arched frame. Plot vectors Simple line art logo of a plant growing on a plot of land in an arched frame. Black and white simple line art logo of a plant growing on a plot of land in an. Black and white simple line art logo of a plant growing on a plot of land in an arched frame
Free with trial This image was created using Generative AI. a coordinate system with two axes and a dotted square boundary symbolizing mathematical concepts. Plot vectors Coordinate system axes with dotted square boundary. This image was created using Generative AI. a coordinate system with two axes and a dotted square boundary. This image was created using Generative AI. a coordinate system with two axes and a dotted square boundary symbolizing mathematical concepts
Free with trial Personal stylist isolated cartoon vector illustrations. Fashion stylist offers dress to her client, choosing summer outfit, shopping mall, trying on new clothes and accessories vector cartoon. Plot vectors Personal stylist isolated cartoon vector illustrations. Fashion stylist offers dress to her client, choosing summer outfit, shopping mall, trying on new
Free with trial Detailed of chain link perimeter fence enclosing land plot with tree for property defense. Plot vectors Chain link perimeter fence enclosing land plot with tree for property defense. Detailed AI generated of chain link perimeter fence enclosing land plot with tree. Detailed of chain link perimeter fence enclosing land plot with tree for property defense
Free with trial Logo of the compass. Vector illustration for a logo, template, or label. Isolated on a white background. Plot vectors Logo of the compass. Vector illustration for a logo, template, or label. Isolated on a white background
Free with trial Shoe shop isolated cartoon vector illustrations. Handsome and smiling man buying shoes in the shopping mall, consumerism movement, day in fashion boutique, people lifestyle vector cartoon. Plot vectors Shoe shop isolated cartoon vector illustrations. Handsome and smiling man buying shoes in the shopping mall, consumerism movement, day in fashion boutique
Free with trial Computer aided design systems. Blueprint, scheme, plan, sketch. Technical illustrations backgrounds Light blue. Plot vectors Blueprint, Sketch. Vector engineering illustration. Cover, flyer, banner, background. Instrument-making drawings. Computer aided design systems. Blueprint. Computer aided design systems. Blueprint, scheme, plan, sketch. Technical illustrations backgrounds Light blue
Free with trial A page from "The Human Genome Project" displaying a dot matrix plot of nucleotides. Horizontal and vertical axes represent sequences, while dots signify matching nucleotides. This visualization reveals sequence alignment and repetitive elements, essential for genetic research and analysis. It highlights the complexity of genomic relationships and aids in understanding genetic patterns. Plot vectors A page from 'The Human Genome Project' displaying a dot matrix plot of nucleotides. Horizontal and vertical axes represent sequences, while dots signify. A page from "The Human Genome Project" displaying a dot matrix plot of nucleotides. Horizontal and vertical axes represent sequences, while dots signify matching nucleotides. This visualization reveals sequence alignment and repetitive elements, essential for genetic research and analysis. It highlights the complexity of genomic relationships and aids in understanding genetic patterns.
Free with trial Glasses designing for door glass kitchen shutter glass railing glass wardrobe glass partition glass ceiling glass used plotter vinyl cutting and mdf cutting used office glass film used. Plot vectors Glasses Door Partition Kitchen Shutter Railing Glass Design. Glasses designing for door glass kitchen shutter glass railing glass wardrobe glass partition glass. Glasses designing for door glass kitchen shutter glass railing glass wardrobe glass partition glass ceiling glass used plotter vinyl cutting and mdf cutting used office glass film used
Free with trial Tour on the wheels isolated cartoon vector illustrations. Happy couple smiling and riding electric scooters, wheels tour during city trip, cultural experience, electric vehicle vector cartoon. Plot vectors Tour on the wheels isolated cartoon vector illustrations. Happy couple smiling and riding electric scooters, wheels tour during city trip, cultural experience
Free with trial Study during maternity leave isolated cartoon vector illustrations. Mom studying online when having children, modern motherhood, combine education with family, distance learning vector cartoon. Plot vectors Study during maternity leave isolated cartoon vector illustrations. Mom studying online when having children, modern motherhood, combine education with family
Free with trial Dairy farming isolated cartoon vector illustrations. Farmer controls livestock on ranch, agriculture industry worker, agribusiness idea, production sector, animals rearing vector cartoon. Plot vectors Dairy farming isolated cartoon vector illustrations. Farmer controls livestock on ranch, agriculture industry worker, agribusiness idea, production sector
Free with trial Movie cinema hall, box with popcorn, soda water glass, 3d glasses, tickets - vector. Plot vectors Movie cinema hall. Box with popcorn, soda water glass, 3d glasses, tickets - vector
Free with trial Satisfaction isolated cartoon vector illustration. Satisfied girl having fun, feeling pleasure, achieving success, people psychology, kids socio-emotional development vector cartoon. Plot vectors Satisfaction isolated cartoon vector illustration. Satisfied girl having fun, feeling pleasure, achieving success, people psychology, kids socio-emotional
Free with trial Planting process set and juice flat vector, set. Four different infographics with planting process and juice in flat design. Plot vectors Planting process set and juice flat vector, set. Four different infographics with planting process and juice in flat design
Free with trial A friendly cartoon businessman points to a complex scatter plot graph illustrating the trade off and optimal positioning between product price and quality metrics for successful brand strategy. Plot vectors Businessman Explaining Price vs Quality Brand Positioning Strategy on Digital Whiteboard. A friendly cartoon businessman points to a complex scatter plot graph. A friendly cartoon businessman points to a complex scatter plot graph illustrating the trade off and optimal positioning between product price and quality metrics for successful brand strategy
Free with trial Cocktail party isolated cartoon vector illustrations. Group of young people dancing and drinking cocktails at party, nightlife activity, leisure time with friends at nightclub vector cartoon. Plot vectors Cocktail party isolated cartoon vector illustrations. Group of young people dancing and drinking cocktails at party, nightlife activity, leisure time with
Free with trial Cover, flyer. Vector engineering illustration. Blueprint, banner, background. Instrument-making drawings Mechanical Corporate Identity Technical illustration. Plot vectors Blueprint, background. Instrument-making Corporate Identity. Cover, flyer. Vector engineering illustration. Blueprint, banner, background. Instrument-making. Cover, flyer. Vector engineering illustration. Blueprint, banner, background. Instrument-making drawings Mechanical Corporate Identity Technical illustration
Free with trial School ground clean up isolated cartoon vector illustration. People work together, picking trash in the school area, collect rubbish from the ground, community volunteering vector cartoon. Plot vectors School ground clean up isolated cartoon vector illustration. People work together, picking trash in the school area, collect rubbish from the ground, community
Free with trial Pack a backpack isolated cartoon vector illustration. Smiling girl packing a bag, children daily routine, going to study, morning preparation for school, rush in the morning vector cartoon. Plot vectors Pack a backpack isolated cartoon vector illustration. Smiling girl packing a bag, children daily routine, going to study, morning preparation for school, rush
Free with trial Watercolor Shoji Design. Kimono Tile. Shibori Seamless Pattern. Tie Dye Abstract Texture. Navy Blue and Beige Organic Minimal Grid. Batik Tie Dye Border. Stencil Japan Background. Plot vectors Tie Dye Pattern. Watercolor Shoji Design. Kimono Tile. Shibori Seamless Pattern. Tie Dye Abstract Texture. Navy Blue and Beige Organic Minimal Grid. Batik Tie. Watercolor Shoji Design. Kimono Tile. Shibori Seamless Pattern. Tie Dye Abstract Texture. Navy Blue and Beige Organic Minimal Grid. Batik Tie Dye Border. Stencil Japan Background.
Free with trial Seed-planting drones isolated cartoon vector illustrations. Man dealing with seed-planting drone, smart farming industry, precision agriculture, improve agricultural yield vector cartoon. Plot vectors Seed-planting drones isolated cartoon vector illustrations. Man dealing with seed-planting drone, smart farming industry, precision agriculture, improve
Free with trial Access problems isolated cartoon vector illustrations. Disabled man struggles with climbing stairs, people in wheelchair, ramp problems, accessible city, barrier-free environment vector cartoon. Plot vectors Access problems isolated cartoon vector illustrations. Disabled man struggles with climbing stairs, people in wheelchair, ramp problems, accessible city
Free with trial Engineering backgrounds. Mechanical engineering drawings. Cover. Technical Design. Blueprints. Light green background Grid. Plot vectors Engineering backgrounds. Mechanical engineering drawings. Cover. Technical Design. Blueprints. Light green background Grid
Free with trial Yard twister isolated cartoon vector illustration. Family playing twister outdoors, leisure time, summer backyard game, fun activity for parents and children, colorful dots vector cartoon. Plot vectors Yard twister isolated cartoon vector illustration. Family playing twister outdoors, leisure time, summer backyard game, fun activity for parents and children
Free with trial Biological pest control isolated cartoon vector illustrations. Farmer gets rid of pests in the field, modern agriculture, organic farming, harvest safety, plant disease vector cartoon. Plot vectors Biological pest control isolated cartoon vector illustrations. Farmer gets rid of pests in the field, modern agriculture, organic farming, harvest safety
Free with trial Business background with scatter plot trend in saffron slate tones, 3:2 format, with copy space for presentations, reports, banners and web headers. Plot vectors Scatter Plot Trend Business Background, Saffron Slate. Business background with scatter plot trend in saffron slate tones, 3:2 format, with copy space for. Business background with scatter plot trend in saffron slate tones, 3:2 format, with copy space for presentations, reports, banners and web headers
Free with trial Shopping with kids isolated cartoon vector illustration. Happy children run with bags, family at shopping mall, parents and kids make purchases together, happy customers vector cartoon. Plot vectors Shopping with kids isolated cartoon vector illustration. Happy children run with bags, family at shopping mall, parents and kids make purchases together, happy
Free with trial Minimal set of Stress protection, Dot plot and Phone payment flat icons for web development. Marketing strategy, Family questions, Cyber attack icons. Trade infochart, Euro money. Vector. Plot vectors Minimal set of Stress protection, Dot plot and Phone payment flat icons for web development. For design. Vector. Minimal set of Stress protection, Dot plot and. Minimal set of Stress protection, Dot plot and Phone payment flat icons for web development. Marketing strategy, Family questions, Cyber attack icons. Trade infochart, Euro money. Vector
Free with trial Playdough modelling isolated cartoon vector illustration. Kid play with slime, make object with playdough, modelling class, kindergarten and preschool activity, fine motor skill vector cartoon. Plot vectors Playdough modelling isolated cartoon vector illustration. Kid play with slime, make object with playdough, modelling class, kindergarten and preschool activity
Free with trial Longboarding isolated cartoon vector illustrations. Young happy girl longboarding outdoors alone, university education break, student life diversity, campus activity vector cartoon. Plot vectors Longboarding isolated cartoon vector illustrations. Young happy girl longboarding outdoors alone, university education break, student life diversity, campus
Free with trial Sparse dotted irregular circle frame. Circular frame with sparse irregular dots forming open contour structure. Plot vectors Sparse dotted irregular circle frame. Circular frame with sparse irregular dots forming open contour structure
Free with trial Disgust isolated cartoon vector illustration. Little girl making grimace, kids disgust face expression, people psychology, socio-emotional development, negative feelings vector cartoon. Plot vectors Disgust isolated cartoon vector illustration. Little girl making grimace, kids disgust face expression, people psychology, socio-emotional development
Free with trial Diagram glyph background vector icon which can easily modify or edit. Plot vectors Diagram glyph background vector icon which can easily modify or edit
Free with trial Production Line Icons Isolated. Set of various technical elements of the production line process icons isolated vector illustration. Plot vectors Production Line Icons Isolated. Set of various technical elements of the production line process icons isolated vector illustration
Free with trial Graph. Red and Black Line Diagram Icon. Plot vectors Graph. Red and Black Line Diagram Icon
Free with trial Mediterranean diet isolated cartoon vector illustrations. Girl making vegetable salad, preparing Mediterranean meal, healthy nutrition, cooking food at home, fish on the table vector cartoon. Plot vectors Mediterranean diet isolated cartoon vector illustrations. Girl making vegetable salad, preparing Mediterranean meal, healthy nutrition, cooking food at home
Free with trial Clown entertainer isolated cartoon vector illustration. Birthday celebration, entertainment service, balloon modeling, home party, clown entertaining children, kids have fun vector cartoon. Plot vectors Clown entertainer isolated cartoon vector illustration. Birthday celebration, entertainment service, balloon modeling, home party, clown entertaining children
Free with trial Radar chart performance metrics modern line style data visualization element. Spider graph. Multivariate plot comparison. Black and white monochrome web design. Minimalist user interface component. Plot vectors Radar chart performance metrics modern line style data visualization element. Spider graph. Multivariate plot comparison. Black and white monochrome web design
Free with trial All about summer. Writing prompt for kids blank. Educational children page. Printable sheet for class teachers. Plot vectors All about summer. Writing prompt for kids blank. Educational children page for school break theme. All about summer. Writing prompt for kids blank. Educational. All about summer. Writing prompt for kids blank. Educational children page. Printable sheet for class teachers
Free with trial Vegetable Garden Illustration with Shed and Tools Circular Icon. A circular black-and-white of a vegetable garden with planting beds, a shed, and gardening tools. Plot vectors Vegetable Garden Illustration with Shed and Tools Circular Icon. A circular black-and-white of a vegetable garden with planting beds, a shed, and gardening tools
Free with trial Vector mathematical seamless texture with handwritten algebra and geometry formulas, functions, calculations. you can use any color of background. Plot vectors Vector mathematical seamless texture with handwritten algebra and geometry formulas, functions, calculations. You can use any color of background
Free with trial An image perfect for book enthusiasts on Book Day, showcasing an open book with vivid colors like electric blue, magenta, and a logo with a tree illustration in a circle. Plot vectors A colorful image showcasing an open book for enthusiasts of Book Day. An image perfect for book enthusiasts on Book Day, showcasing an open book with vivid. An image perfect for book enthusiasts on Book Day, showcasing an open book with vivid colors like electric blue, magenta, and a logo with a tree illustration in a circle
Free with trial Worker With Plotter Vector. Man. Prints Beautiful Picture, Banner. Print Service. Isolated Flat Cartoon Illustration. Plot vectors Worker With Plotter Vector. Man. Large Format Multifunction Printer. Polygraphy Service. Isolated Flat Cartoon. Worker With Plotter Vector. Man. Prints Beautiful. Worker With Plotter Vector. Man. Prints Beautiful Picture, Banner. Print Service. Isolated Flat Cartoon Illustration
Free with trial Business and Marketing Concepts, Illustration of Standard Deviation Diagram Chart, Gaussian Bell Graph or Normal Distribution Curve Isolated on White Background. Plot vectors Normal Distribution Diagram on A White Background. Business and Marketing Concepts, Illustration of Standard Deviation Diagram Chart, Gaussian Bell Graph or. Business and Marketing Concepts, Illustration of Standard Deviation Diagram Chart, Gaussian Bell Graph or Normal Distribution Curve Isolated on White Background
Free with trial Home cooking isolated concept vector illustration. Cook at home, online easy food recipes, family time activity, homemade traditional meal, cooking TV show, healthy eating habit vector concept. Plot vectors Home cooking isolated concept vector illustration. Cook at home, online easy food recipes, family time activity, homemade traditional meal, cooking TV show
Free with trial This image contains six different graphs, each representing various data trends and relationships. The first graph is a bar chart showing the frequency of a variable labeled 'D' over a range of values. The second graph is a line chart displaying fluctuations in a variable labeled 'C' over a period. The third graph is another line chart showing the relationship between variables 'f' and 'm' over. Plot vectors Graphical representation of data trends over time and categories. This image contains six different graphs, each representing various data trends and. This image contains six different graphs, each representing various data trends and relationships. The first graph is a bar chart showing the frequency of a variable labeled 'D' over a range of values. The second graph is a line chart displaying fluctuations in a variable labeled 'C' over a period. The third graph is another line chart showing the relationship between variables 'f' and 'm' over
Free with trial Blueprint, Sketch. Vector engineering illustration. Cover Light blue. Plot vectors Blueprint, Sketch. Vector engineering illustration. Cover Light blue
Free with trial Book icon. A Book icon with green cover and a bulb onit. Plot vectors Book icon. A Book icon with green cover and a bulb onit
Free with trial School chalk board. Vector illustration background. Plot vectors School chalk board. Vector illustration background
Free with trial Serving Christmas meal isolated cartoon vector illustration. Family gathering for xmas celebration, woman serving traditional meal for holiday, Christmas time with relatives vector cartoon. Plot vectors Serving Christmas meal isolated cartoon vector illustration. Family gathering for xmas celebration, woman serving traditional meal for holiday, Christmas time
Free with trial House rehab isolated cartoon vector illustrations. Group of house flippers repairing a building, small business, real estate rehabbing process, preparing apartment for sale vector cartoon. Plot vectors House rehab isolated cartoon vector illustrations. Group of house flippers repairing a building, small business, real estate rehabbing process, preparing
Free with trial Spoiler Alert text sign illustration. On white Background. Plot vectors Spoiler Alert text sign illustration. On white Background
 Sign in