Free with trial Vector pie chart icon set. On white background. Visualization vectors Vector pie chart icon set. On white background
Free with trial Business concept template. Timeline. Vector Infographic. Visualization vectors Business concept template. Timeline. Vector Infographic
Free with trial Data clusterization. Abstract background of connected sphere. Network of communication nodes. Technology abstract background. Visualization vectors Data clusterization. Abstract background of connected sphere. Network of communication nodes. Technology background. Data clusterization. Abstract background of. Data clusterization. Abstract background of connected sphere. Network of communication nodes. Technology abstract background
Free with trial Data analytics outline icons collection. Insights, Dashboards, Modeling, Metrics, Visualization, Algorithms, Curation. Visualization vectors Data analytics line icons collection. Insights, Dashboards, Modeling, Metrics, Visualization, Algorithms, Curation. Data analytics outline icons collection. Data analytics outline icons collection. Insights, Dashboards, Modeling, Metrics, Visualization, Algorithms, Curation
Free with trial A high-quality 3D render showcasing a vibrant, ripe mango suspended within a dynamic splash of juice. This realistic and clean design is perfect for commercial use, food branding, and stock imagery, featuring an isolated object on a transparent background. Visualization vectors 3d ripe mango with splash of juice isolated on transparent background. A high-quality 3D render showcasing a vibrant, ripe mango suspended within a dynamic. A high-quality 3D render showcasing a vibrant, ripe mango suspended within a dynamic splash of juice. This realistic and clean design is perfect for commercial use, food branding, and stock imagery, featuring an isolated object on a transparent background
Free with trial Phosphorus element. Atomic symbol P. Atomic number fifteen. Mass 30. 974. EPS 10. Visualization vectors Phosphorus element. Atomic symbol P. Atomic number fifteen. Mass 30.974. EPS 10
Free with trial Experiential learning notions rectangle infographic template. Data visualization with 5 steps. Editable timeline info chart. Workflow layout with line icons. Myriad Pro-Bold, Regular fonts used. Visualization vectors Experiential learning notions rectangle infographic template. Data visualization with 5 steps. Editable timeline info chart. Workflow layout with line icons
Free with trial A compelling icon of a city contained within a futuristic dome, evoking themes of either utopian sanctuary or dystopian control. Suitable for science fiction narratives, urban development plans, environmental enclosure concepts, or advanced architectural visualization, vector design Generative AI. Visualization vectors Dystopian or Utopian City Under Dome Icon Design, vector design Generative AI. A compelling icon of a city contained within a futuristic dome, evoking themes of. A compelling icon of a city contained within a futuristic dome, evoking themes of either utopian sanctuary or dystopian control. Suitable for science fiction narratives, urban development plans, environmental enclosure concepts, or advanced architectural visualization, vector design Generative AI
Free with trial 64. 9 Percentage circle diagrams Infographics vector, circle diagram business illustration, Designing the 64. 9 Segment in the Pie. Chart. Visualization vectors 64.9 Percentage circle diagrams Infographics vector, circle diagram business illustration, Designing the 64.9 Segment in the Pie. Chart
Free with trial This image features a 3D bar chart with orange bars of increasing height, representing growth. A green arrow extends from the bottom left to the top right, symbolizing upward progress and success. Visualization vectors A 3d bar chart with a green arrow indicating upward growth and success. This image features a 3D bar chart with orange bars of increasing height, representing. This image features a 3D bar chart with orange bars of increasing height, representing growth. A green arrow extends from the bottom left to the top right, symbolizing upward progress and success
Free with trial Abstract digital technology background. Digital tech motherboard texture design. Engineering circuit board concept for poster, header, banner, website, presentation. Visualization vectors Abstract digital technology background. Digital tech motherboard texture design. Engineering circuit board concept for. Poster, header, banner, website
Free with trial Vector illustration of a man in a futuristic suit. Made from many dots and particles. Made from many dots and. Visualization vectors Vector illustration of a man in a futuristic suit. Made from many dots and particles. Illustration of a man in a futuristic suit. Made from many dots and
Free with trial Media infographic timeline template, elements and icons. Infograph includes numbered options, line icon set with social media, user profile, broadcast media, music record, telecommunication etc. Visualization vectors Media infographic template, elements and icons. Media infographic timeline template, elements and icons. Infograph includes numbered options, line icon set with. Media infographic timeline template, elements and icons. Infograph includes numbered options, line icon set with social media, user profile, broadcast media, music record, telecommunication etc.
Free with trial Modern design template, infographics idea to ranked and statistics. Visualization vectors Infographic display, idea to ranked and statistics. Modern design template, infographics idea to ranked and statistics. Modern design template, infographics idea to ranked and statistics.
Free with trial Startup challenge overcoming vector infographic template. Business presentation outline design elements. Data visualization with 5 steps. Work timeline info chart. Workflow layout with line icons. Visualization vectors Startup challenge overcoming vector infographic template. Business presentation outline design elements. Data visualization with 5 steps. Work timeline info
Free with trial Lightning bolt, heartbeat with ECG line, and light bulb with gear signify energy, health, and creativity. Ideal for innovation, technology, healthcare, energy ideas problem-solving and progress. Visualization vectors Energy Bolt, Heartbeat, and Gear Bulb Representing Innovation, Health, and Technology Concepts. Lightning bolt, heartbeat with ECG line, and light bulb with gear. Lightning bolt, heartbeat with ECG line, and light bulb with gear signify energy, health, and creativity. Ideal for innovation, technology, healthcare, energy ideas problem-solving and progress
Free with trial Flat design infographic showing team collaboration, data charts, and business performance metrics for reports. Visualization vectors Diverse team analytics dashboard with data visualization and business insights on orange background. Flat design infographic showing team collaboration, data. Flat design infographic showing team collaboration, data charts, and business performance metrics for reports
Free with trial Minimalist abstract geometric design with bold red, blue, and white colors. A modern, dynamic composition with curved shapes and strong contrasts, ideal for backgrounds, branding, and digital art. Visualization vectors Minimalist abstract geometric design with bold red, blue, and white colors. A modern, dynamic composition with curved shapes. And strong contrasts, ideal for. Minimalist abstract geometric design with bold red, blue, and white colors. A modern, dynamic composition with curved shapes and strong contrasts, ideal for backgrounds, branding, and digital art
Free with trial A fluid vector illustration of interlocking hexagonal cells, forming an abstract and dynamic network pattern. This versatile design is ideal for technology themes, data flow visualization, or modern scientific concepts, representing connectivity, efficiency, and interconnected systems, vector design Generative AI. Visualization vectors Interlocking Hexagonal Cells, Abstract Network Pattern, vector design Generative AI. A fluid vector illustration of interlocking hexagonal cells, forming an. A fluid vector illustration of interlocking hexagonal cells, forming an abstract and dynamic network pattern. This versatile design is ideal for technology themes, data flow visualization, or modern scientific concepts, representing connectivity, efficiency, and interconnected systems, vector design Generative AI
Free with trial Minimalist SMART Goals Diagram with Thin Line Art Design. Vector Illustration. Visualization vectors Minimalist SMART Goals Diagram with Thin Line Art Design. Vector Illustration
Free with trial Collection Infographics template. Infographics for business presentations or information banner. Vector illustration. Visualization vectors Collection Infographics template. Infographics for business presentations or information banner. Vector illustration
Free with trial Professional presenting a growth chart on screen while holding a report. Ideal for business, education, teamwork, analytics, leadership, strategy discussion, progress visualization. Clean simple. Visualization vectors Person Presenting Growth Chart with Data Insights in a Training or Business Setting. Professional presenting a growth chart on screen while holding a report. Professional presenting a growth chart on screen while holding a report. Ideal for business, education, teamwork, analytics, leadership, strategy discussion, progress visualization. Clean simple
Free with trial Analytics, Chart, Pie, Graph Icons. Flat and Line Filled Icon Set Vector Blue Background. Visualization vectors Analytics, Chart, Pie, Graph Icons. Flat and Line Filled Icon Set Vector Blue Background
Free with trial 4 steps process or timeline color infographic elements ,vector illustration. Business data visualization. Visualization vectors 4 steps process color graphic elements infographic,vector illustration. 4 steps process or timeline color infographic elements ,vector illustration. Business. 4 steps process or timeline color infographic elements ,vector illustration. Business data visualization.
Free with trial A visualization of key trade routes that have been hindered by sanctions resulting in food shortages in certain areas. Vector illustration AI generated. Visualization vectors A visualization of key trade routes that have been hindered by sanctions resulting in food shortages in certain areas. Vector illustration AI generated
Free with trial A data chart vector with bars, representing graph visualizations and business analytics. Useful for business reports, data analysis tools, and designs related to data interpretation png transparent image Generative AI. Visualization vectors Data chart with bars, graph visualization, business analytics, data analysis png transparent image Generative AI. A data chart vector with bars, representing. A data chart vector with bars, representing graph visualizations and business analytics. Useful for business reports, data analysis tools, and designs related to data interpretation png transparent image Generative AI
Free with trial Ai architecture logo design with editable slogan. Business card and branding book template. Visualization vectors Ai architecture logo design with editable slogan. Branding book and business card template. Ai architecture logo design with editable slogan. Business card and. Ai architecture logo design with editable slogan. Business card and branding book template.
Free with trial Timeline infographic with infochart. Modern presentation template with 5 spets for business process. Website template on white background for concept modern design. Horizontal layout. Visualization vectors Timeline infographic with infochart. Modern presentation template with 5 spets for business process. Website template on. White background for concept modern. Timeline infographic with infochart. Modern presentation template with 5 spets for business process. Website template on white background for concept modern design. Horizontal layout
Free with trial Mind map with eight rounded elements connected to central circle. Modern scheme for organization of business information. Simple infographic design template. Linear vector illustration for banner. Visualization vectors Modern Infographic Options Template. Mind map with eight rounded elements connected to central circle. Modern scheme for organization of business information. Mind map with eight rounded elements connected to central circle. Modern scheme for organization of business information. Simple infographic design template. Linear vector illustration for banner.
Free with trial Lightbulb encasing organized luggage, analytics dashboard, and recycling symbol. Ideal for sustainability, travel, efficiency, organization, eco-consciousness, innovation simple landing page. Visualization vectors Sustainable Packing and Travel Planning with Innovative Digital Tools and Eco-Friendly Ideas. Lightbulb encasing organized luggage, analytics dashboard, and. Lightbulb encasing organized luggage, analytics dashboard, and recycling symbol. Ideal for sustainability, travel, efficiency, organization, eco-consciousness, innovation simple landing page
Free with trial Interface design, data analysis, user navigation, tech interaction, search engines, digital tools. Hand gesture for navigation, data graph and search bar. Interface design and data analysis concept. Visualization vectors Hand Gesture for Navigation with Graph Data and Search Bar Interaction Concept. Interface design, data analysis, user navigation, tech interaction, search. Interface design, data analysis, user navigation, tech interaction, search engines, digital tools. Hand gesture for navigation, data graph and search bar. Interface design and data analysis concept
Free with trial Infographics flowchart. Colored shadows scheme. Vector illustration. Visualization vectors Infographics flowchart. Colored shadows scheme. Vector illustration
Free with trial Not accepted waste materials vector infographic template. Presentation outline design elements. Data visualization with 4 steps. Process timeline info chart. Workflow layout with line icons. Visualization vectors Not accepted waste materials vector infographic template. Presentation outline design elements. Data visualization with 4 steps. Process timeline info chart
Free with trial Colorful world map, vector, and can be upscaled to any size. Visualization vectors Colorful world map, vector. And can be upscaled to any size
Free with trial Visual Plan 4 5 2 3 Step Diagram Slideshow Template Bundle. Modern Growth Four Five Two Three Element Infographic Presentation Layout Vector Illustration Collection. Visualization vectors Visual Plan 4 5 2 3 Step Diagram Slideshow Template Bundle. Modern Growth Four Five Two Three Element Infographic Presentation Layout Vector Illustration
Free with trial A vibrant red sound wave pattern, abstractly representing audio frequencies, music, or pulsating sound. Ideal for music applications, sound design, or digital media projects. Its rhythmic and undulating form suggests movement and energy, perfect for conveying dynamic audio experiences, vector design Generative AI. Visualization vectors Dynamic Red Sound Wave Pattern, Audio Frequency Visualization, vector design Generative AI. A vibrant red sound wave pattern, abstractly representing audio. A vibrant red sound wave pattern, abstractly representing audio frequencies, music, or pulsating sound. Ideal for music applications, sound design, or digital media projects. Its rhythmic and undulating form suggests movement and energy, perfect for conveying dynamic audio experiences, vector design Generative AI
Free with trial Pie chart, Pie graph, circular, circle diagram from series with 2 to 65 segments, portions. Ratio concept infographic, presentation element - stock vector illustration, clip-art graphics. Visualization vectors Pie chart, Pie graph, circular, circle diagram from series with 2 to 65 segments, portions. Ratio concept infographic,. Presentation element - stock vector. Pie chart, Pie graph, circular, circle diagram from series with 2 to 65 segments, portions. Ratio concept infographic, presentation element - stock vector illustration, clip-art graphics
Free with trial Big data design. With document folder and speech bubble over purple background, vector illustration. Visualization vectors Big data design. With document folder and speech bubble over purple background, vector illustration
Free with trial Isometric infographics timeline business workflow report background. With business icon 5 steps for presentation vector illustration. Visualization vectors Isometric infographics timeline business workflow report background. With business icon 5 steps for presentation vector illustration
Free with trial Solomon Islands badge. Flag of Solomon Islands in glowing network geometric style. Neat vector illustration. Visualization vectors Solomon Islands badge. Flag of Solomon Islands in glowing network geometric style. Neat vector illustration
Free with trial A dynamic vector illustration of data analysis charts on screens with circuit elements, symbolizing big data, digital visualization, and advanced analytics. This graphic is ideal for themes of business intelligence, financial technology, or statistical modeling. It represents the transformation of raw data into actionable insights, vector design Generative AI. Visualization vectors Big Data Analysis, Digital Visualization and Circuits, vector design Generative AI. A dynamic vector illustration of data analysis charts on screens with circuit. A dynamic vector illustration of data analysis charts on screens with circuit elements, symbolizing big data, digital visualization, and advanced analytics. This graphic is ideal for themes of business intelligence, financial technology, or statistical modeling. It represents the transformation of raw data into actionable insights, vector design Generative AI
Free with trial Abstract Circular Progress Timer with Green Arc Illustration. A sleek, modern circular progress indicator with a green arc showing progress from 0 to 60 units. Visualization vectors Abstract Circular Progress Timer with Green Arc Illustration. A sleek, modern circular progress indicator with a green arc showing progress from 0 to 60 units
Free with trial Education Infographic Depicting Student Steps Toward Graduation Goal Achievement. Visualization vectors Education Infographic Depicting Student Steps Toward Graduation Goal Achievement.
Free with trial Pipeline big data line icon vector illustration. Pipeline big data line icon vector. pipeline big data sign. isolated contour symbol black illustration. Visualization vectors Pipeline big data line icon vector illustration. Pipeline big data line icon vector. pipeline big data sign. isolated contour symbol black illustration
Free with trial Three abstract wireframe buildings visualization with dots, curved lines, and geometric forms. Futuristic architectural concept for technology, construction, design, and digital backgrounds. Visualization vectors Three abstract Wireframe Buildings with Dots and Geometric Lines. Three abstract wireframe buildings visualization with dots, curved lines, and geometric forms. Three abstract wireframe buildings visualization with dots, curved lines, and geometric forms. Futuristic architectural concept for technology, construction, design, and digital backgrounds.
Free with trial Anatomical visualization of a knee joint, showcasing bones, ligaments, and surrounding tissue. Glows around cells suggest cellular activity, health, or treatment. Visualization vectors Close-up view of a human knee joint with glowing cells highlighting health and regeneration isolated on white background. Anatomical visualization of a knee. Anatomical visualization of a knee joint, showcasing bones, ligaments, and surrounding tissue. Glows around cells suggest cellular activity, health, or treatment
Free with trial World map infographics. Vector stylized and embossed dotted world map with infographics elements. Visualization vectors World map infographics. Vector stylized and embossed dotted world map with infographics elements
Free with trial Artificial Intelligence, Big Data Analysis Visualization. Landing Page Template with Quantum Cryptography Concept. Business Presentation of Artificial Intelligence. Blockchain Virtual Visualization. Visualization vectors Big Data Analysis Visualization. Landing Page. Artificial Intelligence, Big Data Analysis Visualization. Landing Page Template with Quantum Cryptography Concept. Artificial Intelligence, Big Data Analysis Visualization. Landing Page Template with Quantum Cryptography Concept. Business Presentation of Artificial Intelligence. Blockchain Virtual Visualization.
Free with trial Incheon Airport Seoul stamp. Airport of Seoul round logo. Vector illustration. Visualization vectors Incheon Airport Seoul stamp. Airport of Seoul round logo. Vector illustration
Free with trial Business startups, innovation, goal achievement, analytics, progress tracking, growth. A rocket icon, a star symbol and percentage graphics. Startup growth and innovation concept. Visualization vectors Rocket Symbol with Star Outline and Percentage Statistics for Success, Growth, Innovation, or Business Progress. Business startups, innovation, goal achievement. Business startups, innovation, goal achievement, analytics, progress tracking, growth. A rocket icon, a star symbol and percentage graphics. Startup growth and innovation concept
Free with trial Big data background. Technology for visualization, artificial intelligence, deep learning and quantum computing. Design template for network concept. Modern big data backdrop. Visualization vectors Big data background. Technology for visualization, artificial in. Telligence, deep learning and quantum computing. Design template for network concept. Modern
Free with trial Dynamic 3D visualization of a business growth chart featuring an upward trend arrow, colorful bars, and shining coins symbolizing financial prosperity and successful investment strategies. Visualization vectors 3d growth chart with upward arrow and coins represents financial success business growth. Dynamic 3D visualization of a business growth chart featuring an upward. Dynamic 3D visualization of a business growth chart featuring an upward trend arrow, colorful bars, and shining coins symbolizing financial prosperity and successful investment strategies
Free with trial Infographic template design. Vector illustration decorative design. Visualization vectors Infographic template design. Vector illustration decorative design
Free with trial Waveform visualization. Sound signal pattern. Frequency vector shape. Black audio background. EPS 10. Visualization vectors Waveform visualization. Sound signal pattern. Frequency vector shape. Black audio background. EPS 10
Free with trial Instant messaging software vector infographic template. Messenger presentation outline design elements. Data visualization with 5 steps. Process timeline info chart. Workflow layout with line icons. Visualization vectors Instant messaging software vector infographic template. Messenger presentation outline design elements. Data visualization with 5 steps. Process timeline info
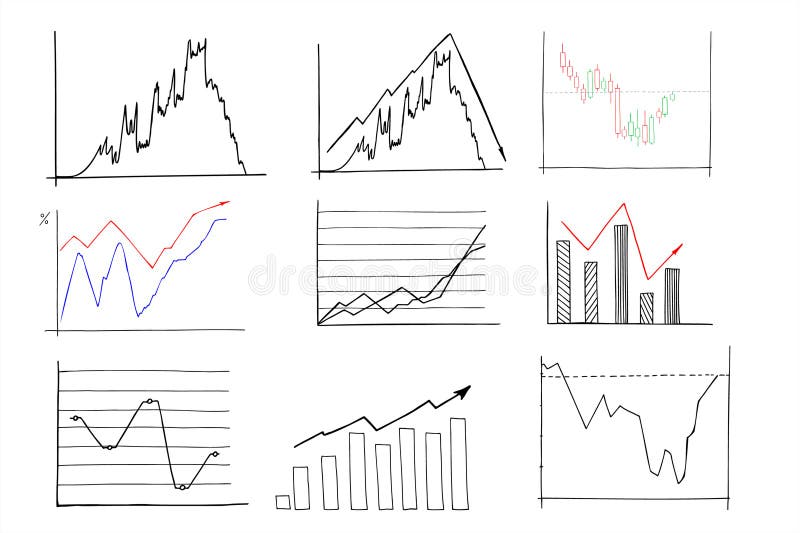
Free with trial Chart line set. Graph, finance report, income growth, economy statistic, diagram, infographic, mind map, data visualization vector illustration. Outline signs of analytic. Editable Stroke. Visualization vectors Analytical graphic chart with trend lines, columns set hand drawn ink sketch. Change in time of election results or income, plans. Chart line set. Graph, finance. Chart line set. Graph, finance report, income growth, economy statistic, diagram, infographic, mind map, data visualization vector illustration. Outline signs of analytic. Editable Stroke
Free with trial Rising financial graph with dollar sign. 3d illustration of an ascending bar graph with a red arrow and dollar symbol, depicting growth. Visualization vectors Rising financial graph with dollar sign. 3d illustration of an ascending bar graph with a red arrow and dollar symbol, depicting growth
Free with trial This image depicts an abstract representation of a brain composed of interconnected lines and nodes. The intricate web of lines illustrates the complex neural pathways and connections within the brain, emphasizing the sophisticated and interwoven nature of neural networks. The image is rendered in a minimalistic style with a turquoise color scheme, highlighting the structure and connectivity of. Visualization vectors Abstract brain network. This image depicts an abstract representation of a brain composed of interconnected lines and nodes. The intricate web of lines. This image depicts an abstract representation of a brain composed of interconnected lines and nodes. The intricate web of lines illustrates the complex neural pathways and connections within the brain, emphasizing the sophisticated and interwoven nature of neural networks. The image is rendered in a minimalistic style with a turquoise color scheme, highlighting the structure and connectivity of
Free with trial An imaginative vector illustration showcasing an elaborate submarine city with domed structures nestled on the ocean floor. This design evokes themes of futuristic living, marine science, and exploration of the deep. Perfect for sci-fi art, environmental concepts, or architectural visualization, vector design Generative AI. Visualization vectors Submarine City Domes Vector, Deep Sea Architecture, vector design Generative AI. An imaginative vector illustration showcasing an elaborate submarine city with. An imaginative vector illustration showcasing an elaborate submarine city with domed structures nestled on the ocean floor. This design evokes themes of futuristic living, marine science, and exploration of the deep. Perfect for sci-fi art, environmental concepts, or architectural visualization, vector design Generative AI
Free with trial This modern vector illustration showcases a clean geometric cube with arrows radiating from its center. It beautifully depicts ideas of outreach, distribution, or spreading information, perfect for diverse digital applications and presentations. Visualization vectors Abstract Geometric Cube Icon with Arrows Illustrating Dispersal and Outreach. This modern vector illustration showcases a clean geometric cube with arrows. This modern vector illustration showcases a clean geometric cube with arrows radiating from its center. It beautifully depicts ideas of outreach, distribution, or spreading information, perfect for diverse digital applications and presentations
Free with trial Checkpoint GPS map location rounded square flat icons. Checkpoint GPS map location flat icons on rounded square vivid color backgrounds. Visualization vectors Checkpoint GPS map location rounded square flat icons. Checkpoint GPS map location flat icons on rounded square vivid color backgrounds
Free with trial Smiling young woman sit on swing in clouds dreaming. Happy girl swaying on tilt in sky. Dreamer and visualization. Vector illustration. Visualization vectors Smiling woman on swing in clouds. Smiling young woman sit on swing in clouds dreaming. Happy girl swaying on tilt in sky. Dreamer and visualization. Vector. Smiling young woman sit on swing in clouds dreaming. Happy girl swaying on tilt in sky. Dreamer and visualization. Vector illustration.
Free with trial An illustration of a globe adorned with lines and nodes, representing a vast global data network and interconnectedness. It's perfect for themes of big data, cloud computing, telecommunications, or international business and communication, vector design Generative AI. Visualization vectors Global Data Network, Interconnected Earth Visualization. vector design Generative AI. An illustration of a globe adorned with lines and nodes, representing a. An illustration of a globe adorned with lines and nodes, representing a vast global data network and interconnectedness. It's perfect for themes of big data, cloud computing, telecommunications, or international business and communication, vector design Generative AI
Free with trial This line graph visualizes a steady decline in numerical data values from January 2022 through December 2023. The blue line illustrates a downward trajectory, indicating a significant reduction over the two-year period, presented against a clean grid background with labeled axes for clear interpretation of the statistical negative trend. Visualization vectors A line graph showing a consistent downward trend in data values over time period. This line graph visualizes a steady decline in numerical data values from. This line graph visualizes a steady decline in numerical data values from January 2022 through December 2023. The blue line illustrates a downward trajectory, indicating a significant reduction over the two-year period, presented against a clean grid background with labeled axes for clear interpretation of the statistical negative trend
Free with trial 62. 8 Percentage circle diagrams Infographics vector, circle diagram business illustration, Designing the 62. 8 Segment in the Pie. Chart. Visualization vectors 62.8 Percentage circle diagrams Infographics vector, circle diagram business illustration, Designing the 62.8 Segment in the Pie. Chart
Free with trial Team brainstorm around a table, a large brain with a glowing light bulb. Symbolizes ideas, innovation, and collaboration. Creative thinking concept. Visualization vectors Creative Thinking Concept. Brainstorming Meeting With Team and Light Bulb Idea Visualization. Team brainstorm around a table, a large brain with a glowing light. Team brainstorm around a table, a large brain with a glowing light bulb. Symbolizes ideas, innovation, and collaboration. Creative thinking concept
Free with trial Cloud computing, data integration, storage solutions, analytics visualization, technology trends, business growth. ion of a cloud, data graph and upward trend arrow. Cloud computing and data. Visualization vectors Data Analytics Concept with Cloud Storage, Graphs, and Statistics Visualization for Business Insights. Cloud computing, data integration, storage solutions. Cloud computing, data integration, storage solutions, analytics visualization, technology trends, business growth. ion of a cloud, data graph and upward trend arrow. Cloud computing and data
Free with trial Stylized illustration of an atom featuring a central nucleus depicted as an orange sphere. Four electrons orbit in elliptical paths, represented by colorful spheres: blue, green, and yellow. The orbits are shown as thick, intercrossing black lines, giving a dynamic sense of movement and structure that mirrors classical atomic models. Visualization vectors Stylized illustration of an atom with orbiting electrons and nucleus. Stylized illustration of an atom featuring a central nucleus depicted as an orange sphere. Stylized illustration of an atom featuring a central nucleus depicted as an orange sphere. Four electrons orbit in elliptical paths, represented by colorful spheres: blue, green, and yellow. The orbits are shown as thick, intercrossing black lines, giving a dynamic sense of movement and structure that mirrors classical atomic models.
Free with trial A flowing vector design of blue music notes on a staff. Suitable for classical music events, audio branding, and creative melody visualization. Elegant and rhythmic lines, vector design Generative AI. Visualization vectors Blue Music Notes Flow Vector Design, vector design Generative AI. A flowing vector design of blue music notes on a staff. Suitable for classical music events. A flowing vector design of blue music notes on a staff. Suitable for classical music events, audio branding, and creative melody visualization. Elegant and rhythmic lines, vector design Generative AI
Free with trial Futuristic Sci-Fi Technology HUD Screen. Futuristic Sci-fi vector HUD interface screen design. Virtual reality technology viewfinder display. Visualization vectors Futuristic Sci-Fi Technology HUD Screen. Futuristic Sci-fi vector HUD interface screen design. Virtual reality technology viewfinder display
Free with trial Infographics timeline element business data steps report layout template background with business line icon 5 steps for any business presentation vector illustration. Visualization vectors Infographics timeline element business data steps report layout template background with business line icon 5 steps. For any business presentation vector
 Sign in