Free with trial Elements of Infographics with buttons and menus. EPS10. Visualization vectors Elements of Infographics with buttons and menus. EPS10
Free with trial Scifi and HUD UI digital elements collection. Futuristic User Interface design set - charts, callouts, charts, audio waves and HUD interface elements. Vector illustration. Visualization vectors Scifi and HUD UI digital elements collection. Futuristic User Interface design set - charts, callouts, charts, audio. Waves and HUD interface elements. Vector
Free with trial Parental monitoring vector infographic template. Time control, content filter presentation design elements. Data visualization with 5 steps. Process timeline chart. Workflow layout with linear icons. Visualization vectors Parental monitoring vector infographic template. Time control, content filter presentation design elements. Data visualization with 5 steps. Process timeline
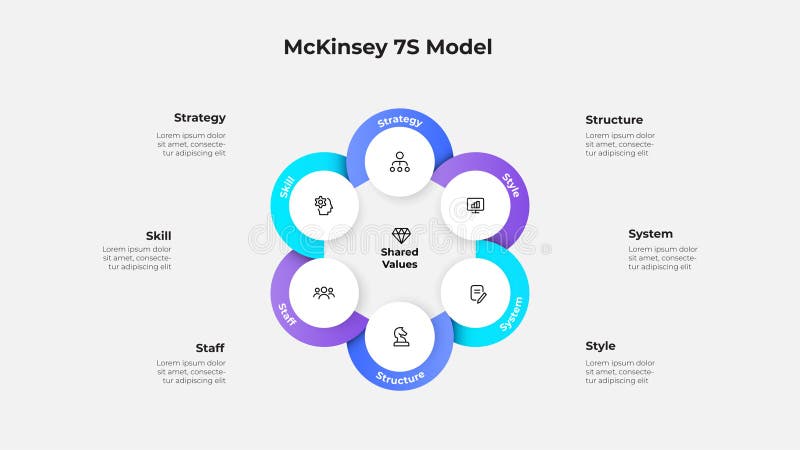
Free with trial Visual representation of the McKinsey 7S model showcasing interconnected elements with descriptions. Vibrant and modern infographic design on a clean layout, suitable for business analysis. Visualization vectors Visual representation of the McKinsey 7S model showcasing interconnected elements with descriptions. Vibrant and modern. Infographic design on a clean layout. Visual representation of the McKinsey 7S model showcasing interconnected elements with descriptions. Vibrant and modern infographic design on a clean layout, suitable for business analysis.
Free with trial Arrow design elements with 4 options, steps, parts, stages. Minimal colorful numbered banner for workflow layout, diagram, chart, report, web design, presentation, plan, strategy, data visualization. Visualization vectors Arrow design elements with 4 options, steps, parts, stages. Minimal colorful numbered banner for workflow layout, diagram, chart,. Report, web design. Arrow design elements with 4 options, steps, parts, stages. Minimal colorful numbered banner for workflow layout, diagram, chart, report, web design, presentation, plan, strategy, data visualization
Free with trial Editable hand drawn comparison chart infographic template with 4 numbered options, icons drawn as shapes and lorem ipsum placeholder text, kraft sketch color palette, 16:9 widescreen format. Pure EPS with separate shapes and no fonts. Visualization vectors Hand Drawn Comparison Chart Infographic, 4 Options, Kraft Sketch. Editable hand drawn comparison chart infographic template with 4 numbered options, icons drawn. Editable hand drawn comparison chart infographic template with 4 numbered options, icons drawn as shapes and lorem ipsum placeholder text, kraft sketch color palette, 16:9 widescreen format. Pure EPS with separate shapes and no fonts
Free with trial Digital stocks exchange chart diagram. Green lines dot money experience. Visualization vectors Digital stocks exchange chart diagram. Green lines dot money experience
Free with trial Digital Plan Slide Design Vector Illustration. Professional Review Five Element Diagram Slideshow Template. Enterprise Launch 5 Step Infographic Presentation Layout. Visualization vectors Enterprise Launch 5 Step Infographic Presentation Layout. Digital Plan Slide Design Vector Illustration. Professional Review Five Element Diagram Slideshow. Digital Plan Slide Design Vector Illustration. Professional Review Five Element Diagram Slideshow Template. Enterprise Launch 5 Step Infographic Presentation Layout
Free with trial Abstract vector technology wave of particles. Big data visualization. Dark background with motion dots and lines. Artificial intelligence. Visualization vectors Abstract vector technology wave of particles. Big data visualization. Background with motion dots and lines. Artificial. Abstract vector technology wave of. Abstract vector technology wave of particles. Big data visualization. Dark background with motion dots and lines. Artificial intelligence
Free with trial Information design. Information concept illustrated with a symbolic info icon, a droplet shape, and a directional arrow. Information clarity, direction, knowledge sharing, visual communication. Visualization vectors Information Symbol and Droplet Shape with Directional Arrow Illustration Concept. Information design. Information concept illustrated with a symbolic info icon. Information design. Information concept illustrated with a symbolic info icon, a droplet shape, and a directional arrow. Information clarity, direction, knowledge sharing, visual communication
Free with trial Dashboard analytics icon with finger touch interaction, gear settings and connected nodes on screen, outline line art symbol for UI, automation and data management. Visualization vectors Dashboard analytics icon with finger touch interaction, gear settings and connected nodes. On screen, outline line art symbol for UI, automation and data
Free with trial Collection of various color code catalogues. Visualization vectors Collection of various color code catalogues.
Free with trial Growth Presentation Board in a bold, solid black pictogram style. This clean, minimal graphic represents growth presentation board icon, rising chart, business report, training board and is suitable for business presentations, infographics, websites, mobile interfaces, reports, and other digital or print design projects. Visualization vectors Growth Presentation Board icon. Growth Presentation Board in a bold, solid black pictogram style. This clean, minimal graphic represents growth presentation. Growth Presentation Board in a bold, solid black pictogram style. This clean, minimal graphic represents growth presentation board icon, rising chart, business report, training board and is suitable for business presentations, infographics, websites, mobile interfaces, reports, and other digital or print design projects.
Free with trial JULY. Colored banner with the name of the month of the year. Stock vector illustration. Visualization vectors JULY. Colored banner with the name of the month of the year. Stock vector illustration
Free with trial Construction infographic template and elements. The template includes illustrations of hipster men and huge awesome set of thin line icons. Modern minimalistic flat vector design. Visualization vectors Construction flat design Infographic Template. Construction infographic template and elements. The template includes illustrations of hipster men and huge. Construction infographic template and elements. The template includes illustrations of hipster men and huge awesome set of thin line icons. Modern minimalistic flat vector design.
Free with trial Abstract background, geometric infographic option templates. Vector colorful business presentation or data brochure layouts with sample text. Visualization vectors Abstract background, geometric infographic option templates. Vector colorful business presentation or data brochure layouts with sample text
Free with trial Seamless vector geometric stock pattern of colored squares for textiles, packaging, paper printing, simple backgrounds and textures. Visualization vectors Seamless vector geometric stock pattern of colored squares. Modern random colors. Seamless vector geometric stock pattern of colored squares for textiles. Seamless vector geometric stock pattern of colored squares for textiles, packaging, paper printing, simple backgrounds and textures
Free with trial Abstract sound wave visualization features colorful gradient dots arranged in vertical columns, representing dynamic audio data or information flow. Visualization vectors Abstract digital sound wave visualization with colorful gradient dots. Abstract sound wave visualization features colorful gradient dots arranged in vertical. Abstract sound wave visualization features colorful gradient dots arranged in vertical columns, representing dynamic audio data or information flow
Free with trial Fitness, technology, health tracking, cloud computing, yoga, data analysis. Stick figure doing a yoga pose with a cloud and calculator. Fitness and technology integration concept. Visualization vectors Stick Figure Doing Yoga Pose With Cloud and Calculator Fitness, Technology, and Data. Fitness, technology, health tracking, cloud computing, yoga, data analysis. Fitness, technology, health tracking, cloud computing, yoga, data analysis. Stick figure doing a yoga pose with a cloud and calculator. Fitness and technology integration concept
Free with trial A grid of black line on a white background depicting various business and technology concepts including people, office supplies, and data visualization. set, collection, business , immersive atmosphere. Visualization vectors Collection of business and technology line on white background finance. A grid of black line on a white background depicting various business and technology. A grid of black line on a white background depicting various business and technology concepts including people, office supplies, and data visualization. set, collection, business , immersive atmosphere
Free with trial Abstract blue and pink plexus structures on a white background. Vector illustration of network connections, data, and technology for a modern web banner. Visualization vectors Plexus Data Visualization Digital Communication Concept. Abstract blue and pink plexus structures on a white background. Vector illustration of network. Abstract blue and pink plexus structures on a white background. Vector illustration of network connections, data, and technology for a modern web banner.
Free with trial Data analytics, forecasting, risk management, decision-making, error prevention, and environmental study. Pie chart with sections, warning triangle and ecological graph. Data analytics and risk. Visualization vectors Data Analysis and Risk Management Concept with Pie Chart and Warning Symbol. Data analytics, forecasting, risk management, decision-making, error prevention, and. Data analytics, forecasting, risk management, decision-making, error prevention, and environmental study. Pie chart with sections, warning triangle and ecological graph. Data analytics and risk
Free with trial Modern circular business infographic template with colorful numbered steps, icons, and text on white background. Vector illustration. Visualization vectors Modern circular business infographic template with colorful numbered steps, icons, and text. Vector illustration. Modern circular business infographic template. Modern circular business infographic template with colorful numbered steps, icons, and text on white background. Vector illustration.
Free with trial Desktop screen with graphs, user feedback emotion, and route tracking illustration. Ideal for data visualization, analytics, productivity, performance tracking, navigation, user engagement. Visualization vectors Digital Activity Monitoring with Location Tracking and User Feedback Analytics. Desktop screen with graphs, user feedback emotion, and route tracking. Desktop screen with graphs, user feedback emotion, and route tracking illustration. Ideal for data visualization, analytics, productivity, performance tracking, navigation, user engagement
Free with trial Horizontal progress bar featuring 3 arrow-shaped elements, symbolizing the three stages of business strategy and progression. Clean timeline infographic design template. Vector for presentation. Visualization vectors Horizontal progress bar featuring 3 arrow-shaped elements, symbolizing three six stages of business strategy and. Horizontal progress bar featuring 3 arrow. Horizontal progress bar featuring 3 arrow-shaped elements, symbolizing the three stages of business strategy and progression. Clean timeline infographic design template. Vector for presentation.
Free with trial Diverse global network icon, outline style. Diverse global network icon. Outline diverse global network vector icon for web design isolated on white background. Visualization vectors Diverse global network icon, outline style. Diverse global network icon. Outline diverse global network vector icon for web design isolated on white background
Free with trial Big data tools abstract concept vector illustration. Management tool, software development, big data technology, information visualization, analytics platform, open source abstract metaphor. Visualization vectors Big data tools abstract concept vector illustration. Management tool, software development, big data technology, information visualization, analytics platform
Free with trial Digital pixel background. Virtual technology concept. Tech background with glowing blue mosaic tiles. Big data visualization, AI or futuristic digital template. Cyber wall design. Vector Illustration. Visualization vectors Digital pixel background. Virtual technology concept. Tech background with glowing blue mosaic tiles. Big data visualization, AI. Or futuristic digital template. Digital pixel background. Virtual technology concept. Tech background with glowing blue mosaic tiles. Big data visualization, AI or futuristic digital template. Cyber wall design. Vector Illustration.
Free with trial Set with infographics. Data and information visualization. Template. Stock vector. Visualization vectors Set with infographics. Data and information visualization. Template. Stock vector
Free with trial Health technology, telemedicine, medical diagnostics, global communication, anatomy studies, data visualization. Body figure, heartbeat graph heart image globe interface. Health technology. Visualization vectors Human Health Monitoring with Heartbeat, Anatomy, Global Connectivity, and Data Analysis Elements. Health technology, telemedicine, medical diagnostics, global. Health technology, telemedicine, medical diagnostics, global communication, anatomy studies, data visualization. Body figure, heartbeat graph heart image globe interface. Health technology
Free with trial Black line Sales funnel with arrows for marketing and startup business icon isolated on gold background. Infographic. Template. Vector Illustration. Visualization vectors Black line Sales funnel with arrows for marketing and startup business icon isolated on gold background. Infographic. Template. Vector Illustration
Free with trial Vector Infographic Elements Templates Presentation. Visualization vectors Success infographic. Business presentation slide template. Arrow hit the target. Goal diagram. Chart with 5 steps. Vector Infographic Elements Templates. Vector Infographic Elements Templates Presentation.
Free with trial Steering wheel rounded square flat icons. Steering wheel flat icons on rounded square vivid color backgrounds. Visualization vectors Steering wheel rounded square flat icons. Steering wheel flat icons on rounded square vivid color backgrounds
Free with trial Infographic UI elements kit. Data visualization isolated vector dashboard components. Flat interface buttons template. Web design widget collection for mobile application with light theme. Visualization vectors Infographic UI elements kit. Data visualization isolated vector dashboard components. Flat interface buttons template. Web design widget collection for mobile
Free with trial Modern and clean infographic template perfect for showcasing a 4 steps process. This visually appealing process infographic is a versatile presentation template. Visualization vectors 4 Steps Infographic Template Modern Design with Colorful Boxes. Modern and clean infographic template perfect for showcasing a 4 steps process. This visually. Modern and clean infographic template perfect for showcasing a 4 steps process. This visually appealing process infographic is a versatile presentation template
Free with trial Regression analysis with linear data statistics results outline diagram. Labeled educational scheme and mathematical function calculation with variable outcome forecasting vector illustration. Visualization vectors Regression analysis with linear data statistics results outline diagram. Labeled educational scheme and mathematical function calculation with variable outcome
Free with trial Business departments infographic chart design template. Editable infochart with icons. Instructional graphics with 5 step sequence. Visual data presentation. Arial, Merriweather Sans fonts used. Visualization vectors Business departments infographic chart design template. Editable infochart with icons. Instructional graphics with 5 step sequence. Visual data presentation
Free with trial Cityscape on Floating Landmass Illustration. A whimsical illustration of a tall building on a floating landmass surrounded by greenery, cars, and a clear sky. Visualization vectors A tall building on a floating landmass surrounded by greenery, cars, and a clear sky. Generative AI. Cityscape on Floating Landmass Illustration.A whimsical. Cityscape on Floating Landmass Illustration.A whimsical illustration of a tall building on a floating landmass surrounded by greenery, cars, and a clear sky.
Free with trial Concept of arrow business model with 6 successive isometric steps. Six colorful graphic elements. Timeline design for brochure, presentation. Infographic design layout. Visualization vectors Concept of arrow business model with 6 successive isometric steps. Six colorful graphic elements. Timeline design for. Brochure, presentation. Infographic
Free with trial Business analytics, performance tracking, efficiency measurement, data visualization, user progress, productivity metrics. Bar chart with green bars, speedometer gauge and user icon. Business. Visualization vectors Data Analysis and Performance Dashboard with Bar Chart and Speedometer Gauge. Business analytics, performance tracking, efficiency measurement, data. Business analytics, performance tracking, efficiency measurement, data visualization, user progress, productivity metrics. Bar chart with green bars, speedometer gauge and user icon. Business
Free with trial Set Virtual reality glasses in perspective. Vector illustration. Of an augmented reality helmet in purple and blue tones. Colection of isolated objects. Visualization vectors Set Virtual reality glasses in perspective. Vector illustration. Of an augmented reality helmet in purple and blue tones. Colection of isolated objects
Free with trial This abstract background features a clean, minimalist design with a white canvas. Scattered across the image are clusters of small dots in muted tones of grey, beige, and blush pink. Thin, delicate lines connect some of these dots, creating a subtle network or constellation effect. The composition is balanced and airy, offering ample negative space, making it ideal for design overlays, presentations, or digital graphics requiring a modern and sophisticated aesthetic. Visualization vectors Abstract Geometric Network Background with Dots and Lines. This abstract background features a clean, minimalist design with a white canvas. Scattered across the. This abstract background features a clean, minimalist design with a white canvas. Scattered across the image are clusters of small dots in muted tones of grey, beige, and blush pink. Thin, delicate lines connect some of these dots, creating a subtle network or constellation effect. The composition is balanced and airy, offering ample negative space, making it ideal for design overlays, presentations, or digital graphics requiring a modern and sophisticated aesthetic.
Free with trial Big genomic data visualization. DNA test, genom map. Graphic concept for your design. Visualization vectors Big genomic data visualization. DNA test, genom map. Graphic concept for your design
Free with trial Glass Infinity Symbol. Concept Of Eternity And Limitlessness In Modern Design Isolated On Transparent Background. AI generated. Visualization vectors Glass Infinity Symbol. Concept Of Eternity And Limitlessness In Modern Design Isolated On Transparent Background. AI generated
Free with trial This image depicts a stylized representation of cloud computing, featuring a central cloud node connected to multiple smaller nodes and triangles. The geometric design conveys a sense of modernity, innovation, and technological advancement. The illustration highlights the concept of connectivity, data exchange, and online storage in a digital landscape. Visualization vectors A geometric cloud computing network with multiple connected nodes and triangles. This image depicts a stylized representation of cloud computing, featuring a. This image depicts a stylized representation of cloud computing, featuring a central cloud node connected to multiple smaller nodes and triangles. The geometric design conveys a sense of modernity, innovation, and technological advancement. The illustration highlights the concept of connectivity, data exchange, and online storage in a digital landscape.
Free with trial Abstract background dots and lines. Futuristic plexus dynamic wave. 3D rendering. Visualization vectors Abstract background dots and lines. Futuristic plexus dynamic wave. 3D rendering.
Free with trial Innovation, problem solving, creative thinking, time management, brainstorming, idea generation. A tangled cord forming a lightbulb, a clock and a question mark. Problem solving and innovation. Visualization vectors Problem Solving and Creative Thinking Concept with Light Bulb, Question Mark, and Clock Elements. Innovation, problem solving, creative thinking, time management. Innovation, problem solving, creative thinking, time management, brainstorming, idea generation. A tangled cord forming a lightbulb, a clock and a question mark. Problem solving and innovation
Free with trial Neuroscience in marketing vector infographic template. Pricing presentation outline design elements. Data visualization with 5 steps. Process timeline info chart. Workflow layout with line icons. Visualization vectors Neuroscience in marketing vector infographic template. Pricing presentation outline design elements. Data visualization with 5 steps. Process timeline info
Free with trial Target Growth Arrow in a bold, solid black pictogram style. This clean, minimal graphic represents bullseye, goal, aim, achievement and is suitable for business presentations, infographics, websites, mobile interfaces, reports, and other digital or print design projects. Visualization vectors Target Growth Arrow icon. Target Growth Arrow in a bold, solid black pictogram style. This clean, minimal graphic represents bullseye, goal, aim, achievement and. Target Growth Arrow in a bold, solid black pictogram style. This clean, minimal graphic represents bullseye, goal, aim, achievement and is suitable for business presentations, infographics, websites, mobile interfaces, reports, and other digital or print design projects.
Free with trial A modern flat illustration showing a person standing beside a large presentation board with upward‑trending bar and line graphs. The board also includes circular icons representing data targets and percentages. Surrounding elements such as gears, a pie chart, and a potted plant emphasize analysis, growth, and productivity. This artwork visually represents business growth, data analysis, financial reporting, and performance metrics—ideal for presentations, corporate materials, and educational content. Visualization vectors Business Data Visualization Illustration with Presentation Board, Bar Graphs, Line Charts, Pie Chart, and Growth. A modern flat illustration showing a person. A modern flat illustration showing a person standing beside a large presentation board with upward‑trending bar and line graphs. The board also includes circular icons representing data targets and percentages. Surrounding elements such as gears, a pie chart, and a potted plant emphasize analysis, growth, and productivity. This artwork visually represents business growth, data analysis, financial reporting, and performance metrics—ideal for presentations, corporate materials, and educational content.
Free with trial This image was created using Generative AI. A simple black bar chart with an upward trend line on a white background, symbolizing growth and progress in business or finance. Visualization vectors Black bar chart graph with upward trend line on white background. This image was created using Generative AI. A simple black bar chart with an upward trend line. This image was created using Generative AI. A simple black bar chart with an upward trend line on a white background, symbolizing growth and progress in business or finance
Free with trial Abstract Audio Waveform Visualization with Playback Bar. This image features a digital interface displaying an audio waveform alongside a playback progress. Visualization vectors Abstract Audio Waveform Visualization with Playback Bar. This image features a digital interface displaying an audio waveform alongside a playback progress
Free with trial Operation in progress rounded square flat icons. Operation in progress flat icons on rounded square vivid color backgrounds. Visualization vectors Operation in progress rounded square flat icons. Operation in progress flat icons on rounded square vivid color backgrounds
Free with trial Display of digital analytics with warning signs indicating errors in data input processes, Error data input process trending. Visualization vectors Display of digital analytics with warning signs indicating errors in data input processes, Error data input process trending.
Free with trial Lifestyle infographic template, elements and icons. Infograph includes customizable graph, line icon set with fast food, sport exercise, training machine, leisure activities, transport vehicle etc. Visualization vectors Lifestyle infographic template, elements and icons. Infograph includes customizable graph, line icon set with fast food, sport exercise, training machine
Free with trial Golden contour lines forming an abstract wireframe terrain or mountain range, depicting digital landscape and data visualization. Visualization vectors Golden wireframe grid abstract mountains topography. Golden contour lines forming an abstract wireframe terrain or mountain range, depicting digital landscape. Golden contour lines forming an abstract wireframe terrain or mountain range, depicting digital landscape and data visualization
Free with trial Cloud storage, data management, user profiles, analytics, technology, and online services. A large cloud with a user avatar and a graph. Cloud storage and data management visual concept. Visualization vectors Cloud Storage Concept with User Profile and Data Analysis Graph Visual. Cloud storage, data management, user profiles, analytics, technology, and online services. Cloud storage, data management, user profiles, analytics, technology, and online services. A large cloud with a user avatar and a graph. Cloud storage and data management visual concept
Free with trial Scientific vector illustration quantum computer technology. Plexus fiction effect. Deep learning artificial intelligence. Big data algorithms visualization. Quantum explosion background. Visualization vectors Scientific vector illustration quantum computer technology. Plexus fiction effect. Deep learning artificial intelligence. Big data algorithms visualization
Free with trial Abstract particle fractal background, hi-tech and big data background illustration. Visualization vectors Abstract particle fractal background, hi-tech and big data background illustration
Free with trial 2D online therapy vector infographics template with linear icons concept, data visualization with 4 steps, process timeline chart. Visualization vectors 2D online therapy layout with thin line icons concept. 2D online therapy vector infographics template with linear icons concept, data visualization with 4 steps. 2D online therapy vector infographics template with linear icons concept, data visualization with 4 steps, process timeline chart.
Free with trial Human figure examines interconnected users in a global network with a magnifying glass under a cloud. Ideal for teamwork, community, global reach, research, collaboration, online presence, business. Visualization vectors Global Networking and Searching Concept with User Connections and Magnifying Glass. Human figure examines interconnected users in a global network with a. Human figure examines interconnected users in a global network with a magnifying glass under a cloud. Ideal for teamwork, community, global reach, research, collaboration, online presence, business
Free with trial Environmental analysis, data presentation, carbon footprint, sustainability measures, climate change, emissions monitoring. Person presenting data chart and CO2 symbol. Environmental analysis. Visualization vectors Business Presentation on Carbon Emissions Data and Environmental Impact Reduction Concept. Environmental analysis, data presentation, carbon footprint. Environmental analysis, data presentation, carbon footprint, sustainability measures, climate change, emissions monitoring. Person presenting data chart and CO2 symbol. Environmental analysis
Free with trial Tree Collection Isolated On Transparent Background PNG Use for Visualization in Architecture Design or Garden Decoration. Visualization vectors Tree Collection Isolated On Transparent Background PNG. Use for Visualization in Architecture Design or Garden Decoration
Free with trial Large gear with a notification bell icon at its center, person kneeling with magnifying glass, cloud above. Ideal for settings, search, notification, analysis, discovery research productivity. A. Visualization vectors Gear with Notification Bell and Person Investigating with Magnifying Glass Under Cloud. Large gear with a notification bell icon at its center, person kneeling. Large gear with a notification bell icon at its center, person kneeling with magnifying glass, cloud above. Ideal for settings, search, notification, analysis, discovery research productivity. A
Free with trial GRAND OPENING. An impression of a seal or stamp with scuffs. Grunge style. Flat design. Visualization vectors GRAND OPENING. An impression of a seal or stamp with scuffs. Grunge style. Flat design
Free with trial Shiny mesh net falling trend arrow with vibrant bright dots, and grunge 15 discount Off Everything seal stamp. Green stamp seal contains 15 discount Off Everything title inside framed rectangle. Visualization vectors Rubber 15 discount Off Everything Stamp Seal with Net Falling Trend Arrow Glare Icon with Colorful Glare Spots. Shiny mesh net falling trend arrow with vibrant. Shiny mesh net falling trend arrow with vibrant bright dots, and grunge 15 discount Off Everything seal stamp. Green stamp seal contains 15 discount Off Everything title inside framed rectangle.
Free with trial An abstract vector illustration depicting an intricate branching data network with multiple glowing connection points. This image symbolizes complex interconnected systems, vast digital networks, or intricate data processing. Ideal for telecommunications, cloud computing, or big data visualization. Represents vast dynamic modern digital information, vector design Generative AI. Visualization vectors Branching Data Network, Interconnected Systems, vector design Generative AI. An abstract vector illustration depicting an intricate branching data network with. An abstract vector illustration depicting an intricate branching data network with multiple glowing connection points. This image symbolizes complex interconnected systems, vast digital networks, or intricate data processing. Ideal for telecommunications, cloud computing, or big data visualization. Represents vast dynamic modern digital information, vector design Generative AI
Free with trial Hexagonal abstract background. Big Data Visualization. Global network connection. Medical, technology, science. Background. Vector illustration. Visualization vectors Hexagonal abstract background. Big Data Visualization. Global network connection. Medical, technology, science. Background. Vector illustration
Free with trial This image was created using Generative AI. Modern business analytics dashboard featuring colorful chart graphs and data statistics. Includes line graph, pie chart, and bar chart for financial reporting and market analysis visualization. Visualization vectors Business analytics dashboard with colorful chart graphs and data statistics reporting. This image was created using Generative AI. Modern business analytics. This image was created using Generative AI. Modern business analytics dashboard featuring colorful chart graphs and data statistics. Includes line graph, pie chart, and bar chart for financial reporting and market analysis visualization
Free with trial Woman sitting with laptop, pointing to cloud above bar chart and trend line. Ideal for data analysis, cloud computing, progress tracking, technology, business strategy, forecasting, and analytics. Visualization vectors Woman analyzing data with a laptop, pointing at cloud with bar graph and trend line visualization. Woman sitting with laptop, pointing to cloud above bar chart. Woman sitting with laptop, pointing to cloud above bar chart and trend line. Ideal for data analysis, cloud computing, progress tracking, technology, business strategy, forecasting, and analytics
Free with trial Statistics card with charts and graphs collection, vector illustration isolated on white backdrop statistical data and set of varied geometric figures. Visualization vectors Statistics Card with Charts and Graphs Collection. Vector illustration isolated on white backdrop statistical data and set of varied geometric figures
Free with trial A person feels stressed amidst a customizable isometric workspace filled with clutter and distractions, Overwhelmed Customizable Isometric Illustration. Visualization vectors A person feels stressed amidst a customizable isometric workspace filled with clutter and distractions, Overwhelmed Customizable. Isometric Illustration
Free with trial Five colorful triangular element placed in horizontal row. Concept of 5 features of business project to choose. Simple infographic design template. Modern vector illustration for presentation, report. Visualization vectors Modern Infographic Vector Template. Five colorful triangular element placed in horizontal row. Concept of 5 features of business project to choose. Simple. Five colorful triangular element placed in horizontal row. Concept of 5 features of business project to choose. Simple infographic design template. Modern vector illustration for presentation, report.
Free with trial Business management, automation, digital tools, financial transactions, data analysis, technology integration. Monitor showing invoice and data processing. Business management and automation concept. Visualization vectors Digital Invoice Processing with Data Flow and Analytics for Business Automation and Financial Management. Business management, automation, digital tools. Business management, automation, digital tools, financial transactions, data analysis, technology integration. Monitor showing invoice and data processing. Business management and automation concept
 Sign in