Free with trial Microstock words. Words cloud with microstock photography related terms. Visualization vectors Microstock words. Words cloud with microstock photography related terms
Free with trial Infographics vintage elements - work time concept - illustration. Visualization vectors Infographics vintage elements - work time concept. Illustration
Free with trial Infographic design organization chart template for business presentations, information banner, timeline or web design. Vector illustration. Visualization vectors Infographic design organization chart template for business presentations, information banner, timeline or web design. Vector illustration
Free with trial Data analysis, environmental sustainability, minimal design, trends, graphic education, information visualization. Line graph with blue points and leaves. Data analysis and environmental. Visualization vectors Data Visualization with Line Graph and Minimalistic Plant Elements for Analytics and Design. Data analysis, environmental sustainability, minimal design, trends. Data analysis, environmental sustainability, minimal design, trends, graphic education, information visualization. Line graph with blue points and leaves. Data analysis and environmental
Free with trial Cute hand drawn chart. Doodle icon elements. Isolated on white background. Vector stock illustration. Visualization vectors Cute hand drawn graph. Doodle icon elements. Isolated on white background. Vector stock illustration. Cute hand drawn chart. Doodle icon elements. Isolated on. Cute hand drawn chart. Doodle icon elements. Isolated on white background. Vector stock illustration
Free with trial Window cleaning company with glass wall washing service outline concept. Building exterior brushing with water, sanitation spray or hygiene detergent vector illustration. Professional process team. Visualization vectors Window cleaning company with glass wall washing service scene outline concept. Window cleaning company with glass wall washing service outline concept. Building. Window cleaning company with glass wall washing service outline concept. Building exterior brushing with water, sanitation spray or hygiene detergent vector illustration. Professional process team.
Free with trial Vector infographic design template. Business concept with 5 options, parts, steps or processes. Can be used for workflow layout, diagram, number options, web design. Data visualization. Visualization vectors Vector infographic design template. Business concept with 5 options, parts, steps or processes. Can be used for workflow layout, diagram, number options, web
Free with trial Global network connection concept. Big data visualization. Social network communication in the global computer networks. Internet technology. Business. Science. Vector illustration. Visualization vectors Global network connection concept. Big data visualization. Social network communication in the global computer networks. Internet technology. Business. Science
Free with trial Process infographic with numbered steps on glass plates. Vector connected rectangular modules for workflow and business strategy. Blurred templates for presentation, instruction or project planning. Visualization vectors Connected blurred rectangular modules steps. Process infographic with numbered steps on glass plates. Vector connected rectangular modules for workflow and. Process infographic with numbered steps on glass plates. Vector connected rectangular modules for workflow and business strategy. Blurred templates for presentation, instruction or project planning
Free with trial Agriculture quadcopter monitoring crop health, wilting plant indicating issues, analytics report and checkmark symbolizing solution. Ideal for farming, technology, sustainability, innovation, environment. Visualization vectors Precision Agriculture Concept Featuring quadcopter, Wilting Plant, and Analytics Report. Agriculture quadcopter monitoring crop health, wilting plant indicating. Agriculture quadcopter monitoring crop health, wilting plant indicating issues, analytics report and checkmark symbolizing solution. Ideal for farming, technology, sustainability, innovation, environment
Free with trial A professional is pointing at a whiteboard displaying fluctuating data trends during a discussion in an office. The atmosphere reflects a collaborative environment focused on analysis. Visualization vectors Person analyzing data trends on a whiteboard during a business meeting in an office environment. A professional is pointing at a whiteboard displaying. A professional is pointing at a whiteboard displaying fluctuating data trends during a discussion in an office. The atmosphere reflects a collaborative environment focused on analysis.
Free with trial A grid of diverse gray rounded rectangles and squares creating a modern abstract design. Visualization vectors Abstract geometric pattern with modular gray rounded rectangles and squares. A grid of diverse gray rounded rectangles and squares creating a modern abstract. A grid of diverse gray rounded rectangles and squares creating a modern abstract design.
Free with trial A team engages in a business training session, discussing strategies with charts and data on display, Business training with flat illustrations for presenting charts and reports. Visualization vectors A team engages in a business training session, discussing strategies with charts and data on display, Business training with flat. Illustrations for presenting
Free with trial A computer monitor displays a javascript dashboard with multiple charts and graphs on screen , fresh tone. Visualization vectors Javascript dashboard on computer monitor displaying various charts and graphs for data analysis and visualization. A computer monitor displays a javascript. A computer monitor displays a javascript dashboard with multiple charts and graphs on screen , fresh tone
Free with trial Horizontal progress bar featuring 5 arrow-shaped elements, symbolizing the five stages of business strategy and progression. Clean timeline infographic design template. Vector for presentation. Visualization vectors Horizontal progress bar featuring 5 arrow-shaped elements, symbolizing the five stages of business strategy and. Progression. Clean timeline infographic design. Horizontal progress bar featuring 5 arrow-shaped elements, symbolizing the five stages of business strategy and progression. Clean timeline infographic design template. Vector for presentation.
Free with trial A dynamic abstract vector illustration depicting sound equalizer bars with a full gradient of vibrant colors, actively responding to audio. This design represents digital music, audio visualization, or energetic rhythmic flow. Ideal for music applications, recording studios, or abstract art that conveys a rich, full auditory experience. Lively and visually engaging, vector design Generative AI. Visualization vectors Gradient Abstract Sound Equalizer Bars Vector, Full Spectrum Audio, vector design Generative AI. A dynamic abstract vector illustration depicting sound equalizer. A dynamic abstract vector illustration depicting sound equalizer bars with a full gradient of vibrant colors, actively responding to audio. This design represents digital music, audio visualization, or energetic rhythmic flow. Ideal for music applications, recording studios, or abstract art that conveys a rich, full auditory experience. Lively and visually engaging, vector design Generative AI
Free with trial Progressive and native web apps infographic vertical sequence. Digital services for internet users. Visualization infochart with 2 steps. Circles workflow. Montserrat SemiBold, Lato Regular fonts used. Visualization vectors Progressive and native web apps infographic vertical sequence. Digital services for internet users. Visualization infochart with 2 steps. Circles workflow
Free with trial Innovative culture characteristics circle infographic template. Data visualization with 4 steps. Process timeline info chart. Workflow layout with line icons. Myriad Pro-Regular font used. Visualization vectors Innovative culture characteristics circle infographic template. Data visualization with 4 steps. Process timeline info chart. Workflow layout with line icons
Free with trial A vector illustration of augmented or virtual reality goggles displaying a floating 3D cube. This graphic represents immersive experiences, the metaverse, 3D visualization, AR and VR applications, and the future of digital interaction, vector design Generative AI. Visualization vectors Augmented or Virtual Reality Goggles Showing a 3D Cube, vector design Generative AI. A vector illustration of augmented or virtual reality goggles displaying a. A vector illustration of augmented or virtual reality goggles displaying a floating 3D cube. This graphic represents immersive experiences, the metaverse, 3D visualization, AR and VR applications, and the future of digital interaction, vector design Generative AI
Free with trial Nine pieces puzzle hexagonal diagram. Hexagon business presentation infographic. 9 steps, parts, pieces of process diagram. Section compare banner. Jigsaw puzzle info graphic. Marketing strategy. Visualization vectors Nine puzzle jigsaw hexagon line info graphic. Nine pieces puzzle hexagonal diagram. Hexagon business presentation infographic. 9 steps, parts, pieces of process. Nine pieces puzzle hexagonal diagram. Hexagon business presentation infographic. 9 steps, parts, pieces of process diagram. Section compare banner. Jigsaw puzzle info graphic. Marketing strategy.
Free with trial Vector design elements in flat style. Christmas gifts, snowflakes and fir tree. Visualization vectors Vector New Year design elements. Vector design elements in flat style. Christmas gifts, snowflakes and fir tree. Vector design elements in flat style. Christmas gifts, snowflakes and fir tree.
Free with trial This graphic illustration features a 3D isometric map of an island divided into several distinct regions. The design incorporates soft blue tones, simple icons representing mountains and weather patterns and a central location marker. The clean aesthetic makes it suitable for educational or travel-related infographics. Visualization vectors A stylized three dimensional map of an island with various regional divisions. This graphic illustration features a 3D isometric map of an island divided into. This graphic illustration features a 3D isometric map of an island divided into several distinct regions. The design incorporates soft blue tones, simple icons representing mountains and weather patterns and a central location marker. The clean aesthetic makes it suitable for educational or travel-related infographics
Free with trial A comprehensive guide covering various techniques of 3D modeling. Visualization vectors Comprehensive Guide to 3D Modeling Techniques. A comprehensive guide covering various techniques of 3D modeling. A comprehensive guide covering various techniques of 3D modeling.
Free with trial Landing Page, Big Data Analysis Visualization. Quantum Computing, Artificial Intelligence Concept. Futuristic Landing Page with Science Innovation Presentation. Signal Cryptography Page Template. Visualization vectors Landing Page Futuristic Template. Landing Page, Big Data Analysis Visualization. Quantum Computing, Artificial Intelligence Concept. Futuristic Landing Page. Landing Page, Big Data Analysis Visualization. Quantum Computing, Artificial Intelligence Concept. Futuristic Landing Page with Science Innovation Presentation. Signal Cryptography Page Template.
Free with trial Tech Globe Background. Decorative tech globe illustration for web banners, creative layouts, and modern visual branding. Visualization vectors Tech Globe Background. Decorative tech globe illustration for web banners, creative layouts, and modern visual branding
Free with trial Futuristic digital web technology background design. Vector. Visualization vectors Futuristic digital web technology background design. Vector
Free with trial Futuristic dots pattern on dark background. Technology or Science Banner. Big data digital code. 3D rendering. Vector illustration. Visualization vectors Digital technology background. Big Data visualization. Dynamic field of glowing particles. Abstract background. 3d. Futuristic dots pattern on dark background. Futuristic dots pattern on dark background. Technology or Science Banner. Big data digital code. 3D rendering. Vector illustration.
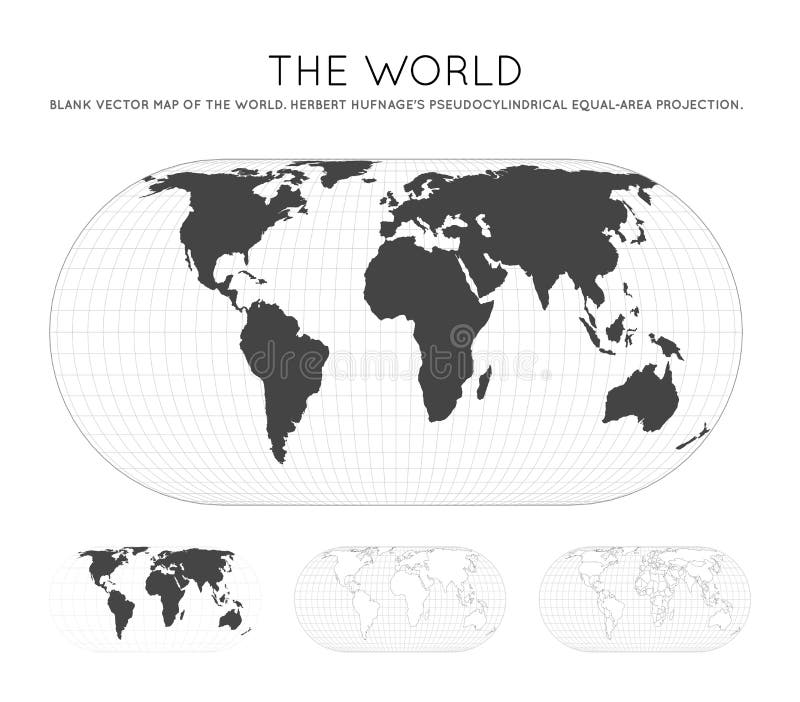
Free with trial Map of The World. Herbert Hufnage`s pseudocylindrical equal-area projection. Globe with latitude and longitude lines. World map on meridians and parallels background. Vector illustration. Visualization vectors Map of The World. Herbert Hufnage`s. Map of The World. Herbert Hufnage`s pseudocylindrical equal-area projection. Globe with latitude and longitude lines. World. Map of The World. Herbert Hufnage`s pseudocylindrical equal-area projection. Globe with latitude and longitude lines. World map on meridians and parallels background. Vector illustration.
Free with trial A creative vector design depicting a purple mechanical gear system with technical elements. Perfect for innovation concepts, engineering process visualization, and futuristic machinery graphics for websites and presentations, vector design Generative AI. Visualization vectors Purple Mechanical Gear System Concept Illustration, vector design Generative AI. A creative vector design depicting a purple mechanical gear system with. A creative vector design depicting a purple mechanical gear system with technical elements. Perfect for innovation concepts, engineering process visualization, and futuristic machinery graphics for websites and presentations, vector design Generative AI
Free with trial Concept visualization line icon drawing of business infographics. Vector scalable graphics. Visualization vectors Concept visualization line icon drawing of business infographics. Vector scalable graphics
Free with trial Map of Laos. Mosaic style map with flag of Laos. Vector illustration. Visualization vectors Map of Laos. Mosaic style map with flag of Laos. Vector illustration
Free with trial Geometric graphic background molecule and communication. Big data complex with compounds. Perspective backdrop. Minimal array. Digital data visualization. Scientific cybernetic vector illustration. Visualization vectors Geometric graphic background molecule and communication. Big data complex with compounds. Perspective backdrop. Minimal. Array. Digital data visualization. Geometric graphic background molecule and communication. Big data complex with compounds. Perspective backdrop. Minimal array. Digital data visualization. Scientific cybernetic vector illustration
Free with trial Collection of Infographic charts. Set of vector flat design infographics statistics charts and graphs. Visualization vectors Collection of Infographic charts. Set of vector flat design infographics statistics charts and graphs
Free with trial Map Finland isometric concept. 3d flat illustration of Map Finland. Visualization vectors Map Finland isometric concept. 3d flat illustration of Map Finland
Free with trial Abstract network of interconnected cubes, man holding a video player, and a floral design. Ideal for blockchain, digital connectivity, education, creativity, nature, teamwork and a simple landing. Visualization vectors Network of Interconnected Blocks with Man Holding Video Player and Floral Element. Abstract network of interconnected cubes, man holding a video player, and a. Abstract network of interconnected cubes, man holding a video player, and a floral design. Ideal for blockchain, digital connectivity, education, creativity, nature, teamwork and a simple landing
Free with trial Product roadmap design concept. Product roadmap design or project development concept. Line art style. Vector illustration, EPS10. Visualization vectors Product roadmap design concept. Product roadmap design or project development concept. Line art style. Vector illustration, EPS10
Free with trial 56. 7 Percentage circle diagrams Infographics vector, circle diagram business illustration, Designing the 56. 7 Segment in the Pie. Chart. Visualization vectors 56.7 Percentage circle diagrams Infographics vector, circle diagram business illustration, Designing the 56.7 Segment in the Pie. Chart
Free with trial Modern circular infographic template featuring colorful segments with icons and text placeholders for presentations. This infographic template is ideal for data visualization. Visualization vectors Segmented Circular Infographic Template with Icons and Text. Modern circular infographic template featuring colorful segments with icons and text placeholders. Modern circular infographic template featuring colorful segments with icons and text placeholders for presentations. This infographic template is ideal for data visualization
Free with trial Data analysis, sustainable farming, renewable energy, rural development, agricultural research, ecological monitoring. Bar graph and windmill with crops. Data analysis and sustainable farming concept. Visualization vectors Digital Business Analytics and Agriculture Concept with Graph Display and Windmill Elements. Data analysis, sustainable farming, renewable energy, rural. Data analysis, sustainable farming, renewable energy, rural development, agricultural research, ecological monitoring. Bar graph and windmill with crops. Data analysis and sustainable farming concept
Free with trial Invoice document with coin, statistical bell curve graph with percentages, and cloud. Ideal for finance, accounting, business strategy, economics, data management, cloud computing financial. Visualization vectors Financial document with invoice, statistical graph, and cloud storage concept for online business. Invoice document with coin, statistical bell curve graph with. Invoice document with coin, statistical bell curve graph with percentages, and cloud. Ideal for finance, accounting, business strategy, economics, data management, cloud computing financial
Free with trial Info-graphic design for product ranking. Ideal for statistical data display. Visualization vectors Infographic design for product ranking. Info-graphic design for product ranking. Ideal for statistical data display. Info-graphic design for product ranking. Ideal for statistical data display.
Free with trial Vector layout of flyer, banner design templates for website design, vertical flyer design, website decoration. Black color technology background. Digital visualization of science, medicine, tech concept. Visualization vectors Vector layout of flyer, banner design templates for website design, vertical flyer design, website decoration.Black. Color technology background.Digital. Vector layout of flyer, banner design templates for website design, vertical flyer design, website decoration.Black color technology background.Digital visualization of science, medicine, tech concept
Free with trial Elegant harmonic spirograph geometry featuring delicate multi-trace orbital lines in a sophisticated midnight bloom gradient, ideal for modern branding and tech backgrounds. Visualization vectors Minimalist Harmonic Spirograph Star Vector Pattern. Elegant harmonic spirograph geometry featuring delicate multi-trace orbital lines in a sophisticated midnight. Elegant harmonic spirograph geometry featuring delicate multi-trace orbital lines in a sophisticated midnight bloom gradient, ideal for modern branding and tech backgrounds
Free with trial Vertical progress bar featuring 3 arrow-shaped elements, symbolizing the three stages of business strategy and progression. Clean timeline infographic design template. Vector for mobile presentation. Visualization vectors Vertical progress bar featuring 3 arrow-shaped elements, symbolizing the three stages of business strategy and. Progression. Clean timeline infographic design. Vertical progress bar featuring 3 arrow-shaped elements, symbolizing the three stages of business strategy and progression. Clean timeline infographic design template. Vector for mobile presentation
Free with trial Application pin rounded square flat icons. Application pin flat icons on rounded square vivid color backgrounds. Visualization vectors Application pin rounded square flat icons. Application pin flat icons on rounded square vivid color backgrounds
Free with trial Company development rectangle blue horizontal infographic 3 steps. Corporate strategy. Data presentation cards. Vector illustration template with thin line icons. Process flow with outline graphics. Visualization vectors Company development rectangle blue horizontal infographic 3 steps. Corporate strategy. Data presentation cards. Vector illustration template with thin line
Free with trial Man running with magnifying glass vector, statistics and analysis of data. Research and investigation of details. Businessman with board and info. Visualization vectors Statistics and Analysis of Chart on Board Vector. Man running with magnifying glass vector, statistics and analysis of data. Research and investigation of. Man running with magnifying glass vector, statistics and analysis of data. Research and investigation of details. Businessman with board and info
Free with trial Mosaic window view mode multi colored flat icons on plain square backgrounds. Included white and darker icon variations for hover or active effects. Visualization vectors Mosaic window view mode square flat multi colored icons. Mosaic window view mode multi colored flat icons on plain square backgrounds. Included white and darker. Mosaic window view mode multi colored flat icons on plain square backgrounds. Included white and darker icon variations for hover or active effects
Free with trial Black sunglasses icon, gray monochrome style. Black sunglasses icon. Gray monochrome illustration of black sunglasses vector icon for web. Visualization vectors Black sunglasses icon, gray monochrome style. Black sunglasses icon. Gray monochrome illustration of black sunglasses vector icon for web
Free with trial Modern Infographic choice template. Vector infographic element. - Vector unique vector design. The pack includes:- 1 EPS10 file. You can easily change color and size for these vector elements without loss of quality. 1 JPG file. Each element has a large resolution 300 dpi, RGB. Note: Vector format allows you to edit the image as you wish: change colors, rearrange and combine elements, change the background and other. you have some questions, please contact me through my profile page. you like this file please rate it, thank you. Visualization vectors Simple Modern Infographics Template. Vector infographic element. - Vector. Modern Infographic choice template. Vector infographic element. - Vector. Modern Infographic choice template. Vector infographic element. - Vector unique vector design. The pack includes:- 1 EPS10 file. You can easily change color and size for these vector elements without loss of quality. 1 JPG file. Each element has a large resolution 300 dpi, RGB. Note: Vector format allows you to edit the image as you wish: change colors, rearrange and combine elements, change the background and other. you have some questions, please contact me through my profile page. you like this file please rate it, thank you.
Free with trial Vertical bar chart with upward arrow representing growth, professional analyzing data with a tablet, and percentage sign indicating statistics. Ideal for finance, analytics, business progress, data. Visualization vectors Business growth with chart visualization and analysis by a professional using a digital tablet. Vertical bar chart with upward arrow representing growth. Vertical bar chart with upward arrow representing growth, professional analyzing data with a tablet, and percentage sign indicating statistics. Ideal for finance, analytics, business progress, data
Free with trial A simple vector illustration of a grid pattern, representing organization, structure, or a window layout. This versatile icon is ideal for user interface design, data visualization, architectural plans, or any project requiring a clear and organized visual framework, vector design Generative AI. Visualization vectors Simple Grid Pattern Icon, Window Layout, Structured Design Vector Design Generative AI. A simple vector illustration of a grid pattern, representing organization. A simple vector illustration of a grid pattern, representing organization, structure, or a window layout. This versatile icon is ideal for user interface design, data visualization, architectural plans, or any project requiring a clear and organized visual framework, vector design Generative AI
Free with trial A vector illustration of a person touching and interacting with a floating screen of geometric shapes and patterns. This artwork is a great representation of user interface (UI). jpg design, user experience (UX). jpg, and data visualization, vector design Generative AI. Visualization vectors A Person Interacting with a Geometric Interface, User Experience Art, vector design Generative AI. A vector illustration of a person touching and interacting. A vector illustration of a person touching and interacting with a floating screen of geometric shapes and patterns. This artwork is a great representation of user interface (UI).jpg design, user experience (UX).jpg, and data visualization, vector design Generative AI
Free with trial Futuristic AI Voice Recognition Interface. A detailed illustration of a futuristic circular interface displaying a complex sound wave. Visualization vectors Futuristic AI Voice Recognition Interface. A detailed illustration of a futuristic circular interface displaying a complex sound wave
Free with trial System capabilities circle infographic template. Authorization. Data visualization with 5 steps. Editable timeline info chart. Workflow layout with line icons. Myriad Pro-Regular font used. Visualization vectors System capabilities circle infographic template. Authorization. Data visualization with 5 steps. Editable timeline info chart. Workflow layout with line icons
Free with trial A digital Kanban board features four columns or workflow stages labeled with different process names. Each column contains several cards or tasks, typically representing individual work items. The board uses a color scheme with orange and blue accents for visual differentiation. Circles and arrows are placed strategically to indicate movement or progress across the workflow stages. The layout is clean and organized, following a typical Kanban board style for managing tasks visually. Visualization vectors Kanban Board Workflow Visualization. A digital Kanban board features four columns or workflow stages labeled with different process names. Each column contains. A digital Kanban board features four columns or workflow stages labeled with different process names. Each column contains several cards or tasks, typically representing individual work items. The board uses a color scheme with orange and blue accents for visual differentiation. Circles and arrows are placed strategically to indicate movement or progress across the workflow stages. The layout is clean and organized, following a typical Kanban board style for managing tasks visually.
Free with trial Collection of business and finance line icons on white background. A set of black line icons representing various business and finance concepts. Visualization vectors Collection of business and finance line icons on white background. A set of black line icons representing various business and finance concepts
Free with trial Abstract digital landscape or waves with flowing particles. Big data or technology background. Visualization of sound waves. Virtual reality concept: 3D digital surface. EPS 10 vector illustration. Visualization vectors Abstract digital landscape or waves with flowing particles. Big data or technology background. Visualization of sound waves. Virtual reality concept: 3D
Free with trial Business data visualization. Process chart. Abstract elements of graph, diagram with steps, options, parts or processes. Vector business template for presentation. Visualization vectors Business data visualization. Process chart. Abstract elements of graph, diagram with steps, options, parts or processes. Vector. Business template for
Free with trial Human arm muscles anatomy illustration. Digital illustration overlay of human arm muscles on a male model, isolated on transparent background AI generated. Visualization vectors Human arm muscles anatomy illustration. Digital illustration overlay of human arm muscles on a male model, isolated on transparent background AI generated
Free with trial The image features a tablet device with a stand displaying a world map. The tablet is positioned upright, showcasing a detailed map of the globe with continents and oceans clearly visible. The map includes various geographical markers and lines indicating borders and possibly flight paths or other data. Visualization vectors Digital globe displaying world map. The image features a tablet device with a stand displaying a world map. The tablet is positioned upright, showcasing a. The image features a tablet device with a stand displaying a world map. The tablet is positioned upright, showcasing a detailed map of the globe with continents and oceans clearly visible. The map includes various geographical markers and lines indicating borders and possibly flight paths or other data
Free with trial Content management outline icons collection. Social media, Project management, Customer service, Digital marketing. Visualization vectors Content management line icons collection. Social media, Project management, Customer service, Digital marketing, Sales. Content management outline icons. Content management outline icons collection. Social media, Project management, Customer service, Digital marketing
Free with trial An abstract geometric layered pattern, perfect for modern design, digital art, and contemporary backgrounds. Ideal for architectural visualization, unique branding, and complex visual compositions. It showcases a blend of precision and artistic flair, vector design Generative AI. Visualization vectors Abstract Geometric Layered Pattern for Modern Design, vector design Generative AI. An abstract geometric layered pattern, perfect for modern design, digital art. An abstract geometric layered pattern, perfect for modern design, digital art, and contemporary backgrounds. Ideal for architectural visualization, unique branding, and complex visual compositions. It showcases a blend of precision and artistic flair, vector design Generative AI
Free with trial Knowledge Wisdom hierarchy infographic template with icon has Wisdom (Shared understanding), Knowledge (Judgment), Information (Cognition), Data (Processing). DIKW knowledge management pyramid vector. Visualization vectors Knowledge Wisdom hierarchy infographic template with icons. DIKW knowledge management pyramid vector. Knowledge Wisdom hierarchy infographic template with icon. Knowledge Wisdom hierarchy infographic template with icon has Wisdom (Shared understanding), Knowledge (Judgment), Information (Cognition), Data (Processing). DIKW knowledge management pyramid vector.
Free with trial Company Planning Four Element Infographic Slide Layout. Marketing Strategy Frame Template Vector Illustration. Corporate Proposal 4 Option Diagram Slideshow Design. Visualization vectors Corporate Proposal 4 Option Diagram Slideshow Design. Company Planning Four Element Infographic Slide Layout. Marketing Strategy Frame Template Vector. Company Planning Four Element Infographic Slide Layout. Marketing Strategy Frame Template Vector Illustration. Corporate Proposal 4 Option Diagram Slideshow Design
Free with trial Timeline infographic with infochart. Modern presentation template with 5 spets for business process. Website template on white background for concept modern design. Horizontal layout. Visualization vectors Timeline infographic with infochart. Modern presentation template with 5 spets for business process. Website template on. White background for concept modern. Timeline infographic with infochart. Modern presentation template with 5 spets for business process. Website template on white background for concept modern design. Horizontal layout
Free with trial Intricate geometric wave pattern featuring concentric resonance chambers rendered in soft pink lines for modern abstract graphic design. Visualization vectors Concentric Resonance Chambers Soft Pink Vector Art. Intricate geometric wave pattern featuring concentric resonance chambers rendered in soft pink lines for. Intricate geometric wave pattern featuring concentric resonance chambers rendered in soft pink lines for modern abstract graphic design
Free with trial Package tracking rounded square flat icons. Package tracking flat icons on rounded square vivid color backgrounds. Visualization vectors Package tracking rounded square flat icons. Package tracking flat icons on rounded square vivid color backgrounds
Free with trial This artwork showcases diverse professionals collaborating on strategic business planning and data analysis, Customizable semi-flat illustrations for strategic consulting. Visualization vectors This artwork showcases diverse professionals collaborating on strategic business planning and data analysis, Customizable semi-. Flat illustrations for strategic
Free with trial Visas information for Canada passport holders. Year 2017. World map infographics showing visa requirements for all countries. Vector illustration. Visualization vectors Visas information for Canada passport holders. Year 2017. World map infographics showing visa requirements for all countries. Vector illustration
Free with trial Hand gesture indicating segmented pie chart, stacked wooden crates. Ideal for data analysis, logistics, inventory management, planning, business strategy, delivery solutions, simple flat metaphor. Visualization vectors Hand Pointing at Pie Chart and Crates Representing Analytics and Supply Chain Management. Hand gesture indicating segmented pie chart, stacked wooden crates. Hand gesture indicating segmented pie chart, stacked wooden crates. Ideal for data analysis, logistics, inventory management, planning, business strategy, delivery solutions, simple flat metaphor
Free with trial Colorful Multipurpose Timeline Template made from color square content blocks. Simple eight steps time line infogrchart template made from color blocks and sample content on dark background. Visualization vectors Colorful Dark Multipurpose Timeline Template made from color square content blocks. Colorful Multipurpose Timeline Template made from color square content blocks. Colorful Multipurpose Timeline Template made from color square content blocks. Simple eight steps time line infogrchart template made from color blocks and sample content on dark background
Free with trial Infographic elements & tools business info graphic template, can be used for presentation, web or workflow diagram layout. Visualization vectors Creative steps collection colorful business infographic template, can be used for presentation, web or workflow diagram layout. Infographic elements & tools. Infographic elements & tools business info graphic template, can be used for presentation, web or workflow diagram layout
Free with trial This image displays a clean, digital sound wave visualization consisting of multiple red vertical bars of varying heights arranged symmetrically against a dark, solid blue-black background, symbolizing audio frequency, music, or data. Visualization vectors A minimalist graphic representation of sound waves featuring red vertical bars on a dark background. This image displays a clean, digital sound wave. This image displays a clean, digital sound wave visualization consisting of multiple red vertical bars of varying heights arranged symmetrically against a dark, solid blue-black background, symbolizing audio frequency, music, or data
Free with trial World map with recycle arrow logo design vector graphic symbol icon sign illustration creative idea. Visualization vectors World map with recycle arrow logo design vector graphic symbol icon sign illustration creative idea
Free with trial Cleaning agency staff vector infographic template. Housekeeping. Business presentation design elements. Data visualization, four steps, option. Process timeline chart. Workflow layout, linear icons. Visualization vectors Cleaning agency staff vector infographic template. Housekeeping. Business presentation design elements. Data visualization, four steps, option. Process
 Sign in