Free with trial 3D infographic template design. Business concept infograph with 2 options, steps or processes. Vector visualization can be used. Visualization vectors 3D infographic template design. Business concept infograph with 2 options, steps or processes. Vector visualization can be used. 3D infographic template design
Free with trial Modern business infographic for your presentation. Four steps to success. Puzzle pieces. Visualization vectors Modern business infographic for your presentation. Four steps to success. Puzzle pieces
Free with trial Geometric abstract background with connected line and dots. Structure molecule and communication. Big Data Visualization. Medical, technology, science background. Vector illustration. Visualization vectors Geometric abstract background with connected line and dots. Structure molecule and communication. Big Data Visualization. Medical, technology, science
Free with trial Business data visualization. timeline infographic icons designed for abstract background template milestone element modern diagram process technology digital marketing data presentation chart Vector. Visualization vectors Presentation business infographic template. Business data visualization. timeline infographic icons designed for abstract background template milestone element. Business data visualization. timeline infographic icons designed for abstract background template milestone element modern diagram process technology digital marketing data presentation chart Vector
Free with trial Isometric number 1. Vector illustration decorative design. Visualization vectors Isometric number 1. Vector illustration decorative design
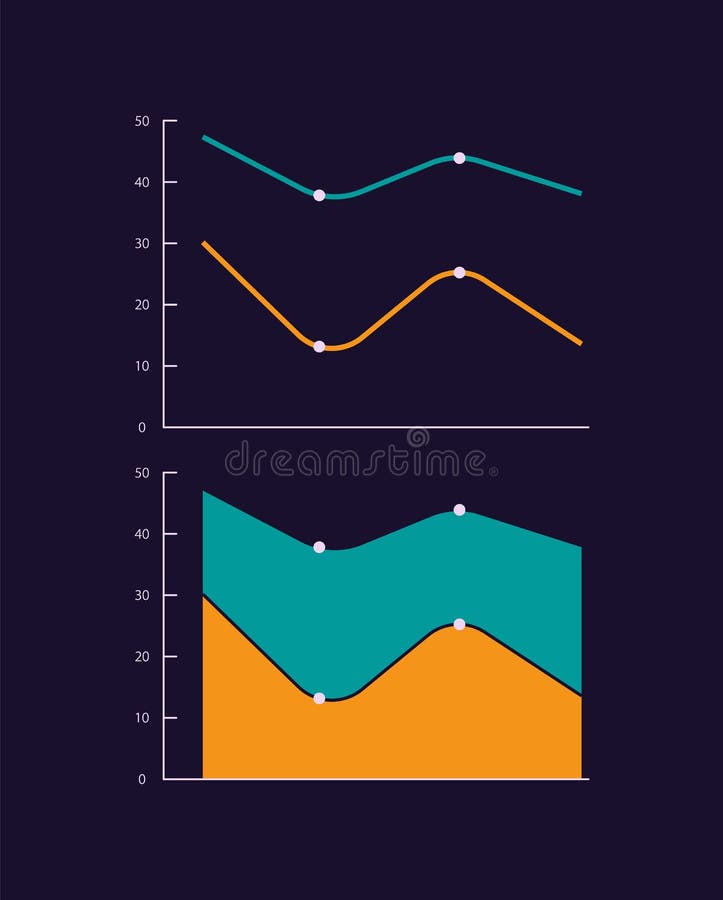
Free with trial Line and area infographic charts design template set for dark theme. Magnitude change over time. Visual data presentation. Editable diagrams collection. Myriad Pro-Bold, Regular fonts used. Visualization vectors Line and area infographic charts design template set for dark theme. Magnitude change over time. Visual data presentation. Editable diagrams collection. Myriad
Free with trial Infographic business concept design with icons and 2 steps. Simple chart presentation template. Abstract vector illustration. Visualization vectors Infographic business concept design with icons and 2 steps. Simple chart presentation template. Abstract vector illustration.
Free with trial Healthy food infographic template, elements and icons. Infograph includes customizable graphs, charts, line icon set with food plate, restaurant meal ingredients, eat plan, fish, vegetables, meat etc. Visualization vectors Healthy food infographic template, elements, icons. Healthy food infographic template, elements and icons. Infograph includes customizable graphs, charts, line. Healthy food infographic template, elements and icons. Infograph includes customizable graphs, charts, line icon set with food plate, restaurant meal ingredients, eat plan, fish, vegetables, meat etc.
Free with trial Abstract background. Psychedelic texture of brush strokes of colored paint of blurred lines and spots of different shapes and sizes. Visualization vectors Abstract background. Psychedelic fractal, texture of brush strokes of colored paint of blurred lines and spots of different shapes. Abstract background. Abstract background. Psychedelic texture of brush strokes of colored paint of blurred lines and spots of different shapes and sizes
Free with trial People persuading to choose Yes or No button. Persuasion and conviction for vote or choose, meaning decision, flat vector illustration isolated on white background. Visualization vectors People persuading to choose Yes or No button, flat vector illustration isolated. People persuading to choose Yes or No button. Persuasion and conviction for. People persuading to choose Yes or No button. Persuasion and conviction for vote or choose, meaning decision, flat vector illustration isolated on white background.
Free with trial Set of black and white vector icons including bar chart, pie chart, magnifying glass with graph, ascending line graph, cogwheel with bars, and laptop screen with data analytics. Generative AI. Visualization vectors Black and white icons of charts and analytics tools for business data analysis. Set of black and white vector icons including bar chart, pie chart, magnifying. Set of black and white vector icons including bar chart, pie chart, magnifying glass with graph, ascending line graph, cogwheel with bars, and laptop screen with data analytics. Generative AI
Free with trial Hyperfocus idea, how to become more efficient. Intense form of mental concentration or visualization that focuses consciousness on a task. You get less tired. Flat vector illustration. Visualization vectors Hyperfocus idea, how to become more efficient. Intense form of mental. Concentration or visualization that focuses consciousness on a task. You get less tired. Hyperfocus idea, how to become more efficient. Intense form of mental concentration or visualization that focuses consciousness on a task. You get less tired. Flat vector illustration
Free with trial Abstract line art with wavy black lines on white background. Visualization vectors Abstract line art with wavy black lines on white background.
Free with trial Dracaena fragrans plants 3d illustration on black background. Premium. Visualization vectors Dracaena fragrans plants 3d illustration on black background. Premium
Free with trial The image depicts a stylized, futuristic aircraft with a layered wing design. The structure appears segmented and angular, giving it a modern and innovative look. The overall shape suggests a blend of aerodynamics and artistic expression, possibly representing concepts in aviation or conceptual art. Visualization vectors Geometric abstraction of a futuristic aircraft with layered wings and sleek design. The image depicts a stylized, futuristic aircraft with a layered wing design. The image depicts a stylized, futuristic aircraft with a layered wing design. The structure appears segmented and angular, giving it a modern and innovative look. The overall shape suggests a blend of aerodynamics and artistic expression, possibly representing concepts in aviation or conceptual art
Free with trial This detailed infographic illustrates the sales and marketing customer journey funnel, segmented into distinct stages: Awareness, Interest, Consideration, Conversion, and Loyalty Advocacy. Each stage is represented by a different color and accompanied by relevant flat design icons, such as a megaphone for awareness, a shopping cart for interest, a dollar sign for consideration, a trophy for conversion, and gift boxes for loyalty. This vector illustration is ideal for explaining marketing strategies, lead generation processes, customer lifecycle management, and business growth concepts in presentations, websites, and educational materials. Visualization vectors Sales and Marketing Funnel Infographic with Customer Journey Stages. This detailed infographic illustrates the sales and marketing customer journey funnel. This detailed infographic illustrates the sales and marketing customer journey funnel, segmented into distinct stages: Awareness, Interest, Consideration, Conversion, and Loyalty Advocacy. Each stage is represented by a different color and accompanied by relevant flat design icons, such as a megaphone for awareness, a shopping cart for interest, a dollar sign for consideration, a trophy for conversion, and gift boxes for loyalty. This vector illustration is ideal for explaining marketing strategies, lead generation processes, customer lifecycle management, and business growth concepts in presentations, websites, and educational materials.
Free with trial Vector infographic diagram template presenting a 6-step or 6-option process flow. The layout features six triangular geometric shapes with numbers and text placeholders in shades of blue. Useful for business presentations, workflow visualization, or education. Visualization vectors Diagram 6 elements infographic template, six stage business process. Vector infographic diagram template presenting a 6-step or 6-option process flow. The layout. Vector infographic diagram template presenting a 6-step or 6-option process flow. The layout features six triangular geometric shapes with numbers and text placeholders in shades of blue. Useful for business presentations, workflow visualization, or education.
Free with trial A diverse set of Wales maps, including a black silhouette, detailed outline, political division map with counties, and a flag-themed version, ideal for educational and design purposes. Visualization vectors Detailed Wales Map Collection with Outline, Silhouette, Counties, and Flag Overlay Variations. A diverse set of Wales maps, including a black silhouette. A diverse set of Wales maps, including a black silhouette, detailed outline, political division map with counties, and a flag-themed version, ideal for educational and design purposes
Free with trial Horizontal progress bar featuring 5 arrow-shaped elements, symbolizing the five stages of business strategy and progression. Clean timeline infographic design template. Vector for presentation. Visualization vectors Horizontal progress bar featuring 5 arrow-shaped elements, symbolizing the five stages of business strategy and. Progression. Clean timeline infographic design. Horizontal progress bar featuring 5 arrow-shaped elements, symbolizing the five stages of business strategy and progression. Clean timeline infographic design template. Vector for presentation.
Free with trial Modern concept for strategy process visualization with five steps and place for your description. Easy to use for your website or presentation. Visualization vectors Modern concept for strategy process visualization with five steps and place for your description. Easy to use for your website or presentation
Free with trial Geometric option infographic templates. Vector geometric option infographic templates. Visualization vectors Geometric option infographic templates. Vector geometric option infographic templates
Free with trial Speedometer with a gradient-filled gauge indicating measurement or progress, over a cloudy abstract background. Ideal for performance, speed, tracking, progress, goals, monitoring optimization. A. Visualization vectors Speedometer with Gradient Gauge Against Minimalist Cloudy Background Symbolizing Progress or Monitoring. Speedometer with a gradient-filled gauge indicating. Speedometer with a gradient-filled gauge indicating measurement or progress, over a cloudy abstract background. Ideal for performance, speed, tracking, progress, goals, monitoring optimization. A
Free with trial Education, data analysis, career growth, academic trends, knowledge sharing, success planning. Line chart with blue points alongside a graduation cap and a cloud. Education and data analysis concept. Visualization vectors Education Analytics and Data Trends Concept with Graduation Cap and Growth Chart. Education, data analysis, career growth, academic trends, knowledge sharing. Education, data analysis, career growth, academic trends, knowledge sharing, success planning. Line chart with blue points alongside a graduation cap and a cloud. Education and data analysis concept
Free with trial Information flow sorting and analysis, Neural network big data flow visualization, Futuristic technology artificial intelligence digital grid, Processing databases using algorithms, Quantum computing. Visualization vectors Information flow sorting and analysis, Neural network big data flow visualization, Futuristic technology artificial intelligence. Digital grid, Processing. Information flow sorting and analysis, Neural network big data flow visualization, Futuristic technology artificial intelligence digital grid, Processing databases using algorithms, Quantum computing
Free with trial Stylish magical effect vector design. Virtual beauty shine abstract background. EPS 10. Visualization vectors Stylish magical effect vector design. Virtual beauty shine abstract background. EPS 10
Free with trial This image depicts a battery icon with a 75 percent charge level, set against a clean white background. The battery is represented in a simple, modern style, with a green and white color scheme that effectively conveys the charge level. The image is suitable for use in various digital applications, such as mobile apps, websites, or software interfaces, where a clear and concise visual representation of battery status is required. Visualization vectors A battery icon displaying 75 percent charge on a white background. This image depicts a battery icon with a 75 percent charge level, set against a clean white. This image depicts a battery icon with a 75 percent charge level, set against a clean white background. The battery is represented in a simple, modern style, with a green and white color scheme that effectively conveys the charge level. The image is suitable for use in various digital applications, such as mobile apps, websites, or software interfaces, where a clear and concise visual representation of battery status is required.
Free with trial Artificial intelligence fine tuning rectangle infographic template. Data visualization with 4 steps. Editable timeline info chart. Workflow layout with line icons. Lato-Bold, Regular fonts used. Visualization vectors Artificial intelligence fine tuning rectangle infographic template. Data visualization with 4 steps. Editable timeline info chart. Workflow layout with line
Free with trial Bar graph line icons set. Business graphs and charts icons. Business infographics. Statistic data, charts, vector. Visualization vectors Bar graph line icons set. Graph, Line, Bar, Chart, Diagram, Report, Statistics. Business graphs and charts icons. Business info. Bar graph line icons set. Bar graph line icons set. Business graphs and charts icons. Business infographics. Statistic data, charts, vector
Free with trial Individuals engage with a stylized digital currency setup, showcasing Bitcoin symbols, transactions, and modern technology in a vibrant environment. Visualization vectors Individuals engage with a stylized digital currency setup, showcasing Bitcoin symbols, transactions, and modern technology in a. Vibrant environment
Free with trial This image is created by Artificial Intelligence. A female researcher stands on a sandy beach at sunset, interacting with a floating holographic map of underwater terrain. Beside her sits a futuristic mobile ocean lab equipped with solar panels. Visualization vectors Female Scientist Interacting with Holographic Ocean Map on Tropical Beach with Futuristic Mobile Lab Unit. This image is created by Artificial Intelligence. A. This image is created by Artificial Intelligence. A female researcher stands on a sandy beach at sunset, interacting with a floating holographic map of underwater terrain. Beside her sits a futuristic mobile ocean lab equipped with solar panels
Free with trial A wristwatch projects a holographic display reading "WORKPLACE INCLUSION: Diverse Minds, Unified Success. " Surrounding text and icons illustrate diversity statistics and themes. The background features an office space with blurred desks and chairs, emphasizing a corporate environment. The hologram, with its futuristic blue hue and digital graphics, portrays the concept of technology enhancing modern business practices. Visualization vectors Business professional hand presenting holographic WORKPLACE INCLUSION panel in air. A wristwatch projects a holographic display reading 'WORKPLACE INCLUSION. A wristwatch projects a holographic display reading "WORKPLACE INCLUSION: Diverse Minds, Unified Success." Surrounding text and icons illustrate diversity statistics and themes. The background features an office space with blurred desks and chairs, emphasizing a corporate environment. The hologram, with its futuristic blue hue and digital graphics, portrays the concept of technology enhancing modern business practices.
Free with trial SWOT diagram concept with 4 steps, options, parts or processes. The concept of threats, weaknesses, strengths, opportunities of the company. Visualization of business data. Visualization vectors SWOT diagram with 4 steps, options, parts or processes. Threats, weaknesses, strengths, opportunities of the company. SWOT diagram concept with 4 steps, options. SWOT diagram concept with 4 steps, options, parts or processes. The concept of threats, weaknesses, strengths, opportunities of the company. Visualization of business data
Free with trial Clean corporate empty infographic template. Chronological milestone graphic. Vector diagram blank design with 4 steps. Editable info graphic with options. Modern data visualization. Visualization vectors Clean corporate empty infographic template. Chronological milestone graphic. Vector diagram blank design with 4 steps. Editable info graphic with options
Free with trial Infographic Template - 6 Parts. Row of six connected circles with icons and place for text, flat business infographic template, vector eps10 illustration. Visualization vectors Infographic Template - 6 Parts. Row of six connected circles with icons and place for text, flat business infographic template, vector eps10 illustration
Free with trial Paper with statistics isolated icon. Vector illustration design. Visualization vectors Paper with statistics isolated icon. Vector illustration design
Free with trial Person in stylish casual clothes next to a basic bar graph on colored background with wavy lines. Ideal for fashion, data analysis, creativity, modern design, youth culture, lifestyle, simple flat. Visualization vectors Trendy Person Standing Next to a Minimal Bar Graph with Abstract Waves. Person in stylish casual clothes next to a basic bar graph on colored background with. Person in stylish casual clothes next to a basic bar graph on colored background with wavy lines. Ideal for fashion, data analysis, creativity, modern design, youth culture, lifestyle, simple flat
Free with trial Red 3D bar chart showing upward growth trend with decorative ribbon isolated transparent background. Visualization vectors Red upward growth bar chart with ribbon isolated transparent background. Red 3D bar chart showing upward growth trend with decorative ribbon isolated transparent. Red 3D bar chart showing upward growth trend with decorative ribbon isolated transparent background
Free with trial 3d Digital Visualization. Big Data Complex. Wave Cosmic Design with Distortion and Motion. Analysis of Big Data Sorting. Technology Background in Futuristic Style. Fractal Element. Big Data Analysis. Visualization vectors Wave 3D Big Data Visualization. Analysis Infographic. 3d Digital Visualization. Big Data Complex. Wave Cosmic Design with Distortion and Motion. Analysis of Big. 3d Digital Visualization. Big Data Complex. Wave Cosmic Design with Distortion and Motion. Analysis of Big Data Sorting. Technology Background in Futuristic Style. Fractal Element. Big Data Analysis.
Free with trial Corporate communication vector infographic template. Core values presentation design elements. Data visualization with 5 steps. Process timeline chart. Workflow layout with linear icons. Visualization vectors Corporate communication vector infographic template. Core values presentation design elements. Data visualization with 5 steps. Process timeline chart
Free with trial Agriculture biotechnologies rectangle infographic template. Data visualization with 5 steps. Editable timeline info chart. Workflow layout with line icons. Lato-Bold, Regular fonts used. Visualization vectors Agriculture biotechnologies rectangle infographic template. Data visualization with 5 steps. Editable timeline info chart. Workflow layout with line icons
Free with trial Horizontal progress bar featuring 3 arrow-shaped elements, symbolizing the three stages of business strategy and progression. Clean timeline infographic design template. Vector for presentation. Visualization vectors Horizontal progress bar featuring 3 arrow-shaped elements, symbolizing three six stages of business strategy and. Horizontal progress bar featuring 3 arrow. Horizontal progress bar featuring 3 arrow-shaped elements, symbolizing the three stages of business strategy and progression. Clean timeline infographic design template. Vector for presentation.
Free with trial Block scheme icons set 9 color collection. Isolated on white for any design. Visualization vectors Block scheme icons set 9 color collection. Isolated on white for any design
Free with trial Original black and white wave with 3D distortion effect for innovative design concepts. Eps 10. Original black and white wave with 3D distortion effect for. Visualization vectors Original black and white wave with 3D distortion effect for innovative design concepts. Eps 10. Original black and white wave with 3D distortion effect for
Free with trial Abstract health care banner template with flat icons. Healthcare medicine concept. Medical innovation technology pharmacy banner. Vector illustration. Visualization vectors Abstract health care banner template with flat icons. Healthcare medicine concept. Medical innovation technology. Pharmacy banner. Vector illustration
Free with trial Bigdata illustration. Big data science technology background with particles grid and bokeh flare. Visualization vectors Data sorting process. Big data futuristic infographic. Colorful particle grid with bokeh. Bigdata illustration. Big data science technology background with. Bigdata illustration. Big data science technology background with particles grid and bokeh flare
Free with trial Timeline infographic with infochart. Modern presentation template with 6 spets for business process. Website template on white background for concept modern design. Horizontal layout. Visualization vectors Timeline infographic with infochart. Modern presentation template with 6 spets for business process. Website template on. White background for concept modern. Timeline infographic with infochart. Modern presentation template with 6 spets for business process. Website template on white background for concept modern design. Horizontal layout
Free with trial A professional woman wearing a mask is creatively presenting data trends on a glass board for her audience. Visualization vectors A businesswoman engaged in thorough analysis of data trends presented on a modern glass board. A professional woman wearing a mask is creatively presenting data. A professional woman wearing a mask is creatively presenting data trends on a glass board for her audience
Free with trial Modern abstract molecules structure for science or medical background. DNA helix or atom visualization. Molecular wave flow abstract background. Vector illustration. Visualization vectors Modern abstract molecules structure for science or medical background. DNA helix or atom visualization. Molecular wave. Flow abstract background. Vector
Free with trial Graphic features 5 red folded ribbon arrows pointing right in a staggered staircase layout isolated on a white background. For demonstrating business growth and directional flow. Visualization vectors Red Arrow Progress Graphic, Minimalist Flat Design Infographic, Folded Ribbon Style Directional Success Concept for Marketing. Graphic features 5 red folded. Graphic features 5 red folded ribbon arrows pointing right in a staggered staircase layout isolated on a white background. For demonstrating business growth and directional flow
Free with trial Mesh dollar down trend polygonal 2d vector illustration, with black virus elements. Model is created from dollar down trend flat icon, with virus items and polygonal mesh. Visualization vectors Dollar Down Trend Carcass Mesh Icon with Infectious Items. Mesh dollar down trend polygonal 2d vector illustration, with black virus elements. Model is created. Mesh dollar down trend polygonal 2d vector illustration, with black virus elements. Model is created from dollar down trend flat icon, with virus items and polygonal mesh.
Free with trial Education innovation infographic template. Digital technology for learning. Data visualization with 4 steps. Empty process vector design. Editable blank options info graphics. Lexend font used. Visualization vectors Education innovation infographic template. Digital technology for learning. Data visualization with 4 steps. Empty process vector design. Editable blank
Free with trial Person studying world map with location markers, holding a tablet. Includes settings gear and metric counter. Ideal for technology, analytics, data visualization, tracking, navigation, digital. Visualization vectors Professional Analyzing Geographical Data and Monitoring Metrics with Digital Interfaces. Person studying world map with location markers, holding a tablet. Person studying world map with location markers, holding a tablet. Includes settings gear and metric counter. Ideal for technology, analytics, data visualization, tracking, navigation, digital
Free with trial A digital illustration of a futuristic landscape with mountains and rolling hills illuminated by glowing pink and blue lines. The scene creates a surreal and ethereal effect. High quality photo. Visualization vectors A digital illustration of a futuristic landscape with mountains and rolling hills illuminated by glowing pink and blue. Lines. The scene creates a surreal and. A digital illustration of a futuristic landscape with mountains and rolling hills illuminated by glowing pink and blue lines. The scene creates a surreal and ethereal effect. High quality photo
Free with trial Data Comparison on Dark Background. Business Growth Analytics Bar Chart Showing Financial Performance and Data Comparison on Dark Background. Visualization vectors Data Comparison on Dark Background. Business Growth Analytics Bar Chart Showing Financial Performance and Data Comparison on Dark Background
Free with trial Virtual reality glasses technology background. Abstract vr world with neon lines. Creative futuristic concept. Modern template for web and print. Visualization vectors Virtual reality glasses technology background. Abstract vr world with neon lines. Creative futuristic concept. Modern template for web and print
Free with trial This image depicts two futuristic robots exchanging data in a digital network connection. The illustration showcases a seamless interaction between the two machines, highlighting the potential for collaboration and innovation in the field of artificial intelligence and robotics. The image represents a vision of the future where technology and machines work together to advance human knowledge and progress. Visualization vectors Two futuristic robots exchanging data in a digital network connection. This image depicts two futuristic robots exchanging data in a digital network connection. This image depicts two futuristic robots exchanging data in a digital network connection. The illustration showcases a seamless interaction between the two machines, highlighting the potential for collaboration and innovation in the field of artificial intelligence and robotics. The image represents a vision of the future where technology and machines work together to advance human knowledge and progress.
Free with trial Data analysis, technology interfaces, tracking systems, user communication, security insights, and monitoring. Features a radar screen, profile avatar and documents. Data analysis and technology. Visualization vectors Radar Interface with Female Avatar and Digital Documents Analysis and Data Monitoring. Data analysis, technology interfaces, tracking systems, user communication. Data analysis, technology interfaces, tracking systems, user communication, security insights, and monitoring. Features a radar screen, profile avatar and documents. Data analysis and technology
Free with trial Vibrant Light Waves. This image features vibrant flowing light waves with bright hues, conveying energy and movement in. Visualization vectors Vibrant Light Waves. This image features vibrant flowing light waves with bright hues, conveying energy and movement in
Free with trial Social media infographic template, elements and icons. Infograph includes customizable graphs, charts, line icon set with social media, global network, electronic mail, internet technology etc. Visualization vectors Social media infographic template, elements, icons. Social media infographic template, elements and icons. Infograph includes customizable graphs, charts, line. Social media infographic template, elements and icons. Infograph includes customizable graphs, charts, line icon set with social media, global network, electronic mail, internet technology etc.
Free with trial Abstract infographics visualization. Big data code representation. Futuristic network or business analytics. Graphic concept for your design. Visualization vectors Abstract infographics visualization. Big data code representation. Futuristic network or business analytics. Graphic concept for your design
Free with trial Collaborative economy vector infographic template. Modern business model UI web banner with flat characters. Sharing and exchanging services cartoon advertising flyer, leaflet, ppt info poster idea. Visualization vectors Collaborative economy vector infographic template. Modern business model UI web banner with flat characters. Sharing and exchanging services cartoon
Free with trial Poster or vertical banner about augmented reality flat style, vector illustration. Smiling boy with mobile phone standing around planets, education, place for text. Visualization vectors Poster or vertical banner about augmented reality flat style. Vector illustration. Smiling boy with mobile phone standing around planets, education, place for
Free with trial Girl with big books list to read. Top favorite literature concept. Vector illustration. Visualization vectors Girl with big books list to read. Top favorite literature concept. Vector illustration
Free with trial Amaranthus viridis grass plants 3d illustration on black background. Premium. Visualization vectors Amaranthus viridis grass plants 3d illustration on black background. Premium
Free with trial Business analytics, career development, data growth, progress tracking, workflow visualization, document organization. Rising graph alongside a personal profile document. Business analytics. Visualization vectors Data Analysis Growth Chart with Personal Profile Document and Progress Workflow Concept. Business analytics, career development, data growth, progress tracking. Business analytics, career development, data growth, progress tracking, workflow visualization, document organization. Rising graph alongside a personal profile document. Business analytics
Free with trial Circular economy advantages rectangle infographic template. Zero waste. Data visualization with 4 steps. Process timeline info chart. Workflow layout with line icons. Lato-Bold, Regular fonts used. Visualization vectors Circular economy advantages rectangle infographic template. Zero waste. Data visualization with 4 steps. Process timeline info chart. Workflow layout with line
Free with trial Data analysis, reporting tools, performance management, business forecasting, financial insights, presentation design. Bar chart, line graph and dashboard elements. Data analysis and reporting tools. Visualization vectors Data Analytics and Performance Dashboard with Bar Chart, Line Graph, and Infographic Elements. Data analysis, reporting tools, performance management, business. Data analysis, reporting tools, performance management, business forecasting, financial insights, presentation design. Bar chart, line graph and dashboard elements. Data analysis and reporting tools
Free with trial Bar diagram increase chart column graph growth data information yellow 3d icon realistic vector illustration. Infographic step trend level rise statistic analyzing business report datum visualization. Visualization vectors Bar diagram increase chart column graph growth data information yellow 3d icon realistic vector. Illustration. Infographic step trend level rise statistic. Bar diagram increase chart column graph growth data information yellow 3d icon realistic vector illustration. Infographic step trend level rise statistic analyzing business report datum visualization
Free with trial Infographic elements & tools business info graphic template, can be used for presentation, web or workflow diagram layout. Visualization vectors Creative steps collection colorful business infographic template, can be used for presentation, web or workflow diagram layout. Infographic elements & tools. Infographic elements & tools business info graphic template, can be used for presentation, web or workflow diagram layout
Free with trial A complex abstract vector illustration featuring an intricate geometric pattern composed of organized dots and lines. The design creates a sense of digital precision and modern artistry. Ideal for technology themes, data visualization, backgrounds, or contemporary graphic projects requiring a structured and visually engaging element. Dynamic and versatile, vector design Generative AI. Visualization vectors Abstract Geometric Pattern with Dots and Lines, Modern Art, vector design Generative AI. A complex abstract vector illustration featuring an intricate geometric. A complex abstract vector illustration featuring an intricate geometric pattern composed of organized dots and lines. The design creates a sense of digital precision and modern artistry. Ideal for technology themes, data visualization, backgrounds, or contemporary graphic projects requiring a structured and visually engaging element. Dynamic and versatile, vector design Generative AI
Free with trial Visualization of Sorting data, Abstract processing of information flow. Vector database background. Filtering machine algorithms. Visualization vectors Visualization of Sorting data, Abstract processing of information flow. Vector database background. Filtering machine algorithms.
Free with trial Colorful Tunnel Background. Abstract digital background. Big data visualization. Data flow information. Concept of digital communication. Wormhole. 3D rendering. Vector illustration. Visualization vectors Colorful Tunnel Background. Abstract digital background. Big data visualization. Data flow information. Concept of. Digital communication. Wormhole. 3D. Colorful Tunnel Background. Abstract digital background. Big data visualization. Data flow information. Concept of digital communication. Wormhole. 3D rendering. Vector illustration
Free with trial Data analytics line icons. linear set. quality vector line set such as progress chart, database storage, data visualization, data processing, flexibility, hierarchy structure, analytics. Visualization vectors Data analytics line icons. linear set. quality vector line set such as progress chart, database storage, data visualization, data. Processing, flexibility. data analytics line icons. linear set. quality vector line set such as progress chart, database storage, data visualization, data processing, flexibility, hierarchy structure, analytics
Free with trial Saint Martin badge. Bright gradient logo of island in low poly style. Multicolored Saint Martin rounded sign with map in geometric style for your infographics. Visualization vectors Saint Martin badge. Bright gradient logo of island in low poly style. Multicolored Saint Martin rounded sign with map in geometric style for your infographics
 Sign in