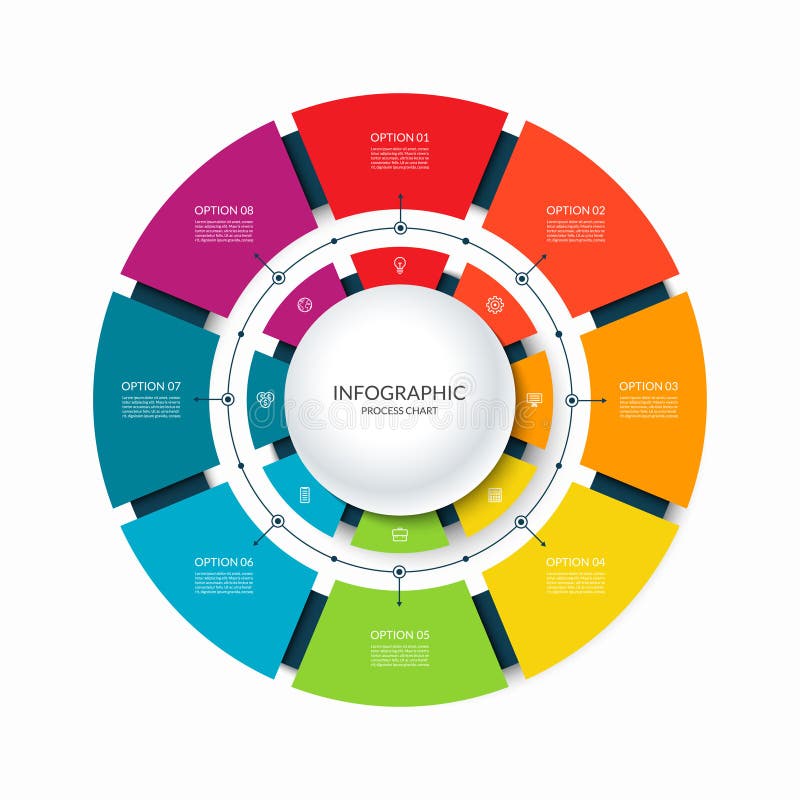
Free with trial Infographic circular chart divided into 8 parts. Step-by step cycle diagram with eight options designed for report, presentation, data visualization. Visualization vectors Infographic circular chart divided into 8 parts. Step-by step cycle diagram with eight options. Infographic circular chart divided into 8 parts. Step-by step. Infographic circular chart divided into 8 parts. Step-by step cycle diagram with eight options designed for report, presentation, data visualization.
Free with trial Infographic elements & tools business info graphic template, can be used for presentation, web or workflow diagram layout. Visualization vectors Timeline Infographic tools business template, can be used for presentation, web or workflow diagram layout. Infographic elements & tools business info graphic. Infographic elements & tools business info graphic template, can be used for presentation, web or workflow diagram layout
Free with trial Abstract sound wave visualization with vertical bars representing audio frequencies, creating a visual representation of. Sound and music. Visualization vectors Abstract sound wave visualization with vertical bars representing audio frequencies, creating a visual representation of. Sound and music
Free with trial Chart Icon Vector Symbol Design Illustration. Chart Icon or Logo Vector Illustration Isolated Sign Symbol - High Quality Black Style Vector Icon. Visualization vectors Chart Icon Vector Symbol Design Illustration. Chart Icon or Logo Vector Illustration Isolated Sign Symbol - High Quality Black Style Vector Icon
Free with trial A stunning digital illustration of an atom, featuring a glowing core and orbiting electrons against a soft blue background. This stylized visualization depicts atomic energy and structure. Visualization vectors Luminous Digital Atom Illustration Depicting Energy and Subatomic Structure. A stunning digital illustration of an atom, featuring a glowing core and orbiting. A stunning digital illustration of an atom, featuring a glowing core and orbiting electrons against a soft blue background. This stylized visualization depicts atomic energy and structure
Free with trial World Map Vector.. Gilbert`s two-world perspective projection. World in red orange gradient on deep blue ocean waves. Cool vector illustration. Visualization vectors World Map Vector.. World Map Vector. Gilbert`s two-world perspective projection. World in red orange gradient on deep blue ocean waves. Cool vector illustration
Free with trial Seamless background with cartoon crabs for packaging design, paper printing, simple backgrounds and texture, posters and banners and Wallpaper. Visualization vectors Seamless background with cartoon crabs for packaging design, printing and texture. Seamless background with cartoon crabs for packaging design, paper printing. Seamless background with cartoon crabs for packaging design, paper printing, simple backgrounds and texture, posters and banners and Wallpaper
Free with trial Colorful sound spectrum visualization with rows of rectangular bars on black background. This is a beatiful picture AI generated. Visualization vectors Colorful sound spectrum visualization with rows of rectangular bars on black background. This is a beatiful picture AI generated
Free with trial Bundle infographic UI, UX, KIT elements. Different charts, diagrams, workflow, flowchart, timeline, schemes, marketing icons, graphs and bars design template. Vector info graphic and infographics set. Visualization vectors Bundle infographic UI, UX, KIT elements. Different charts, diagrams, workflow, flowchart, timeline, schemes, marketing. Icons, graphs and bars design template. Bundle infographic UI, UX, KIT elements. Different charts, diagrams, workflow, flowchart, timeline, schemes, marketing icons, graphs and bars design template. Vector info graphic and infographics set.
Free with trial Stream of encoded data. Abstract digital code visualization. Artificial intelligence and machine learning. Big data code representation. Visualization vectors Stream of encoded data. Abstract digital code visualization. Artificial intelligence and machine learning. Big data code representation
Free with trial Data Visualization, big data, Analytics, Machine Learning, data center, icons set design template. Visualization vectors Data Visualization, big data, Analytics. Machine Learning, data center, icons set design template
Free with trial Global network connection website header or banner design. Abstract background with connecting dots and lines. Global business. Social network communication. Internet technology. Vector illustration. Visualization vectors Global network connection website header or banner design. Abstract background with connecting dots and lines. Global. Business. Social network communication. Global network connection website header or banner design. Abstract background with connecting dots and lines. Global business. Social network communication. Internet technology. Vector illustration.
Free with trial Two tree infographics with root systems, connecting icons to text boxes for presentation purposes. Vector design for business development ideas and process visualization. Visualization vectors Dual Tree Diagram Infographic with Root System for Presentation and Business Development Ideas. Two tree infographics with root systems, connecting icons to text. Two tree infographics with root systems, connecting icons to text boxes for presentation purposes. Vector design for business development ideas and process visualization
Free with trial Flat vector integration dashboard UI mockup with charts, APIs and synced systems, isolated. On white generative ai. Visualization vectors Flat vector integration dashboard UI mockup with charts, APIs and synced systems, isolated. On white generative ai
Free with trial Magnifying glass with eye inspecting AI chip, representing analysis, innovation, and artificial intelligence. Ideal for technology, science, research, education, automation data visualization. Visualization vectors AI exploration concept with magnifying glass, eye symbol, and technology chip in minimal design. Magnifying glass with eye inspecting AI chip, representing. Magnifying glass with eye inspecting AI chip, representing analysis, innovation, and artificial intelligence. Ideal for technology, science, research, education, automation data visualization
Free with trial Contour diagram infographic process on 5 parts, options or processes. Template timeline for graph, presentation and chart. Five steps transparent part hexagon puzzle pieces for business, flow concept. Visualization vectors Five steps line infographic, puzzle diagram. Contour diagram infographic process on 5 parts, options or processes. Template timeline for graph, presentation and. Contour diagram infographic process on 5 parts, options or processes. Template timeline for graph, presentation and chart. Five steps transparent part hexagon puzzle pieces for business, flow concept
Free with trial Circular loading interface with a futuristic design features blue tones, arranged concentrically around a central circle. Bars, arcs, and gear-like shapes represent data or progress indicators, giving a high-tech appearance reminiscent of heads-up display (HUD) graphics. The symmetry and repetition create a sense of movement, commonly used in digital interfaces and gaming environments to visualize processes. The background is dark, enhancing the vividness of the blue elements. Visualization vectors Abstract Blue Futuristic HUD Interface Circular Loading Element Flat Vector Illustration. Circular loading interface with a futuristic design features blue tones. Circular loading interface with a futuristic design features blue tones, arranged concentrically around a central circle. Bars, arcs, and gear-like shapes represent data or progress indicators, giving a high-tech appearance reminiscent of heads-up display (HUD) graphics. The symmetry and repetition create a sense of movement, commonly used in digital interfaces and gaming environments to visualize processes. The background is dark, enhancing the vividness of the blue elements.
Free with trial Modern abstract background with dispersed blue circles and network-like structures, representing analytics, AI, and cloud computing. Visualization vectors Vector abstract data visualization. Digital Network Connections. Modern abstract background with dispersed blue circles and network-like structures, representing. Modern abstract background with dispersed blue circles and network-like structures, representing analytics, AI, and cloud computing
Free with trial AI reporting with automated business reports, data analysis and performance tracking. Business intelligence, reporting automation and analytics dashboard vector illustration. Visualization vectors AI reporting with automated business reports, data analysis and performance tracking. Business intelligence, reporting. Automation and analytics dashboard
Free with trial Dark Hand Drawn Financial Background Vector Illustration. This image is generated using AI tool. Visualization vectors Dark Hand Drawn Financial Background Vector Illustration. This image is generated using AI tool
Free with trial Education, learning progress, analytics, career planning, data visualization, academic success. Graduation cap with a path, graph with upward trend. Education and learning progress concept. Visualization vectors Education Pathway and Data Analysis with Graduation Cap and Growth Chart. Education, learning progress, analytics, career planning, data visualization, academic. Education, learning progress, analytics, career planning, data visualization, academic success. Graduation cap with a path, graph with upward trend. Education and learning progress concept
Free with trial Abstract and glowing particle background with dynamic flow of technological beauty. Vector. Visualization vectors Abstract and glowing particle background with dynamic flow of technological beauty. Vector
Free with trial Statistics Flowcharts and Infographics with Text. Sample set. Business schemes vector, design of infographic, visualization of received data results. Visualization vectors Statistics Flowcharts and Infographics with Text. Sample set. Business schemes vector, design of infographic, visualization of received data results
Free with trial Vector Infographics Elements Template Design. Business Data Visualization Timeline with Marketing Icons most useful can be used f. Visualization vectors Vector Infographics Elements Template Design . Business Data Visualization Timeline with Marketing Icons most useful can be used f
Free with trial Abstract science and innovation technology background. Molecular structures and chemical engineering with hexagonal pattern. Vector illustration. Visualization vectors Abstract science and innovation technology background. Molecular structures and chemical engineering with hexagonal pattern. Vector illustration
Free with trial Person using a laptop at a desk with books and files, viewing a cube model and task checklist. Ideal for work management, 3D design, task organization, remote work, office productivity, goal. Visualization vectors Professional Reviewing 3D Model and Task Checklist at Modern Office Desk. Person using a laptop at a desk with books and files, viewing a cube model and task. Person using a laptop at a desk with books and files, viewing a cube model and task checklist. Ideal for work management, 3D design, task organization, remote work, office productivity, goal
Free with trial Tunisia sign. Country flag with colorful rays. Radiant sunburst with Tunisia flag. Vector illustration. Visualization vectors Tunisia sign. Country flag with colorful rays. Radiant sunburst with Tunisia flag. Vector illustration
Free with trial Minimalist clouds and laptop screen highlight digital connectivity and cloud services. Ideal for technology, communication, online storage, innovation, remote work, data sharing, simple flat metaphor. Visualization vectors Cloud Technology Concept with Minimalist Elements and Laptop for Online Collaboration. Minimalist clouds and laptop screen highlight digital connectivity and. Minimalist clouds and laptop screen highlight digital connectivity and cloud services. Ideal for technology, communication, online storage, innovation, remote work, data sharing, simple flat metaphor
Free with trial A blue and green background with dots, technology background, blue abstract background, abstract background, halftone background, stream background, background blue. Visualization vectors Technology background, blue abstract background, abstract background, halftone background, stream background, background blue. A blue and green background with. a blue and green background with dots, technology background, blue abstract background, abstract background, halftone background, stream background, background blue
Free with trial Household management benefits circle infographic template. Data visualization with 5 steps. Editable timeline info chart. Workflow layout with line icons. Lato-Bold, Regular fonts used. Visualization vectors Household management benefits circle infographic template. Data visualization with 5 steps. Editable timeline info chart. Workflow layout with line icons. Lato
Free with trial Virtual reality data analytics dashboard landing page template VR headsets and line graphs. Business intelligence, digital marketing, technology research, data visualization, market trends, immersive. Visualization vectors Virtual Reality Data Analytics Dashboard Landing Page Template with VR Headset and Graph Icons. Virtual reality data analytics dashboard landing page template VR. Virtual reality data analytics dashboard landing page template VR headsets and line graphs. Business intelligence, digital marketing, technology research, data visualization, market trends, immersive
Free with trial Long term investment strategy illustrating business growth through a progress chart with plants and coins in a vibrant setting. Visualization vectors Long term investment strategy illustrating business growth through a progress chart with plants and coins in a vibrant setting.
Free with trial Template for science and technology presentation. Plexus style background. Visualization vectors Template for science and technology presentation. Plexus style background
Free with trial Laptop screen with interface elements, pencil, and window showcasing data visualization and messages. Ideal for technology, communication, UX design, digital tools, remote work, education simple. Visualization vectors Digital Workspace with Laptop, Pencil, and Interface Elements Highlighting Data and Communication. Laptop screen with interface elements, pencil, and window. Laptop screen with interface elements, pencil, and window showcasing data visualization and messages. Ideal for technology, communication, UX design, digital tools, remote work, education simple
Free with trial Benefits of contactless payments loop infographic template. Data visualization with 5 steps. Process timeline info chart. Workflow layout with line icons. Myriad Pro-Bold, Regular fonts used. Visualization vectors Benefits of contactless payments loop infographic template. Data visualization with 5 steps. Process timeline info chart. Workflow layout with line icons
Free with trial This image was created using Generative AI. A computer monitor displaying a bar chart on its screen, symbolizing data analysis and business finance concepts. Visualization vectors Computer monitor with bar chart on screen. This image was created using Generative AI. A computer monitor displaying a bar chart on its screen, symbolizing data. This image was created using Generative AI. A computer monitor displaying a bar chart on its screen, symbolizing data analysis and business finance concepts
Free with trial House with garage door inside circle, gear, and interface layout. Ideal for logistics, technology, warehousing, automation, e-commerce development supply chain. Simple flat metaphor. Visualization vectors Warehouse management concept with house, gear, and interface layout. House with garage door inside circle, gear, and interface layout. Ideal for logistics. House with garage door inside circle, gear, and interface layout. Ideal for logistics, technology, warehousing, automation, e-commerce development supply chain. Simple flat metaphor
Free with trial An icon of a tablet displaying a rising graph and charts, symbolizing data analysis, business growth, or financial progress. This design is perfect for financial apps, market research, or business presentations, highlighting successful trends and insightful data visualization, vector design Generative AI. Visualization vectors Tablet Data Analysis Growth Progress, vector design Generative AI. An icon of a tablet displaying a rising graph and charts, symbolizing data analysis, business. An icon of a tablet displaying a rising graph and charts, symbolizing data analysis, business growth, or financial progress. This design is perfect for financial apps, market research, or business presentations, highlighting successful trends and insightful data visualization, vector design Generative AI
Free with trial Abstract tech network connection dots. Digital technology and big data analysis background. White background with plexus lines. Geometric background with abstract mesh. Visualization vectors Abstract tech network connection dots. Digital technology and big data analysis background. White background with plexus lines. Geometric background with
Free with trial Elegant green business brochure design. Business flyer design layout template. Can be use for annual report, poster or cover. Modern publication poster magazine. Flat style vector illustration. Visualization vectors Elegant green business brochure design. Business flyer design layout template. Can be use for annual report, poster or cover. Modern publication poster
Free with trial Timeline vector infographic. World map. Vector illustration. Visualization vectors Timeline vector infographic. World map. Vector illustration
Free with trial Timeline infographic with infochart. Modern presentation template with 5 spets for business process. Website template on white background for concept modern design. Horizontal layout. Visualization vectors Timeline infographic with infochart. Modern presentation template with 5 spets for business process. Website template on. White background for concept modern. Timeline infographic with infochart. Modern presentation template with 5 spets for business process. Website template on white background for concept modern design. Horizontal layout
Free with trial Cryptocurrency, financial growth, investment ideas, sustainability, modern economy, agriculture. Bitcoin symbol, dollar sign inside light bulb and carrot icon. Cryptocurrency and financial growth. Visualization vectors Bitcoin Symbol, Dollar Sign Light Bulb, and Carrot Outline Cryptocurrency and Investment Concepts. Cryptocurrency, financial growth, investment ideas. Cryptocurrency, financial growth, investment ideas, sustainability, modern economy, agriculture. Bitcoin symbol, dollar sign inside light bulb and carrot icon. Cryptocurrency and financial growth
Free with trial Business Intelligence Technology Icons Set Vector. Business Intelligence Technology Vector Seamless Pattern Color Line Illustration. Visualization vectors Business Intelligence Technology Icons Set Vector. Business Intelligence Technology Vector Seamless Pattern Color Line Illustration
Free with trial Chart picture information shown by infographic with increasing arrow, symbol of success at work, preserving winning position, vector illustration. Visualization vectors Chart Picture Information Vector Illustration. Chart picture information shown by infographic with increasing arrow, symbol of success at work, preserving. Chart picture information shown by infographic with increasing arrow, symbol of success at work, preserving winning position, vector illustration
Free with trial Seamless pattern Radial color segments forming a circular abstract design, presenting a vivid pie chart of diverse hues and gradients ideal for digital art and graphic backgrounds. Visualization vectors Seamless pattern Radial burst abstract pattern creating vibrant color wheel. Seamless pattern Radial color segments forming a circular abstract design. seamless pattern Radial color segments forming a circular abstract design, presenting a vivid pie chart of diverse hues and gradients ideal for digital art and graphic backgrounds
Free with trial A diverse collection of colorful line icons representing business strategy, data visualization, and technological processes. This extensive vector set is ideal for dashboards, presentations, and organizational materials, Rendered by Ai. Visualization vectors Business Analytics and Strategy Icon Set. A diverse collection of colorful line icons representing business strategy, data visualization, and technological. A diverse collection of colorful line icons representing business strategy, data visualization, and technological processes. This extensive vector set is ideal for dashboards, presentations, and organizational materials, Rendered by Ai
Free with trial A focused individual wearing over-ear headphones and working on audio editing software displayed on a laptop screen with waveform visualization. Visualization vectors Person listening to music with headphones and editing audio on laptop. A focused individual wearing over-ear headphones and working on audio editing software. A focused individual wearing over-ear headphones and working on audio editing software displayed on a laptop screen with waveform visualization
Free with trial Eritrea round sign. Futuristic satelite view of the world centered to Eritrea. Country badge with map, round text and binary background. Astonishing vector illustration. Visualization vectors Eritrea round sign. Futuristic satelite view of the world centered to Eritrea. Country badge with map, round text and binary background. Astonishing vector
Free with trial A cartoon illustration of a businesswoman holding a tablet and analyzing a bar graph, symbolizing data analysis and business intelligence. The image is set against a soft pink background, conveying a sense of professionalism and modern technology. Visualization vectors Businesswoman Analyzing Data on Tablet. A cartoon illustration of a businesswoman holding a tablet and analyzing a bar graph, symbolizing data analysis and. A cartoon illustration of a businesswoman holding a tablet and analyzing a bar graph, symbolizing data analysis and business intelligence. The image is set against a soft pink background, conveying a sense of professionalism and modern technology.
Free with trial Business analytics, innovation, creativity, data visualization, artificial intelligence, decision-making. Pie chart, lightbulb and eye graphic. Data visualization and innovation concepts. Visualization vectors Data Analysis Concept with Pie Chart, Eye Symbol, and Lightbulb Illustration. Business analytics, innovation, creativity, data visualization, artificial. Business analytics, innovation, creativity, data visualization, artificial intelligence, decision-making. Pie chart, lightbulb and eye graphic. Data visualization and innovation concepts
Free with trial Set of infographic elements. Presentation template. Book cover design. Vector illustration. Visualization vectors Set of infographic elements. Presentation template. Book cover design. Vector illustration
Free with trial Woman gesturing towards a serene lotus flower blooming in front of a tranquil sky. Ideal for wellness, mindfulness, focus, meditation, personal growth, relaxation, mental clarity simple flat metaphor. Visualization vectors Woman pointing at calm nature-themed display with a blooming lotus and soft cloud backdrop. Woman gesturing towards a serene lotus flower blooming in front of a. Woman gesturing towards a serene lotus flower blooming in front of a tranquil sky. Ideal for wellness, mindfulness, focus, meditation, personal growth, relaxation, mental clarity simple flat metaphor
Free with trial Scatter trend chart icon is a clean silhouette icon for websites, mobile apps, presentations, infographics and business designs. scatter trend chart is a flat monochrome glyph made for data visualization, annual reports, market analysis slides, dashboards and web design, the crisp lines remain clear on small screens and large prints, simple to edit and combine with text and other icons. Visualization vectors Scatter trend chart icon in simple silhouette style. Scatter trend chart icon is a clean silhouette icon for websites, mobile apps, presentations, infographics. Scatter trend chart icon is a clean silhouette icon for websites, mobile apps, presentations, infographics and business designs. scatter trend chart is a flat monochrome glyph made for data visualization, annual reports, market analysis slides, dashboards and web design, the crisp lines remain clear on small screens and large prints, simple to edit and combine with text and other icons
Free with trial Analytics Icon. Icon Related to Marketing - A flat design analytics icon, suitable for marketing, data analysis, or business content. Visualization vectors Modern Marketing Analytics Icon for Data Visualization Strategy. Analytics Icon. Icon Related to Marketing - A flat design analytics icon, suitable for marketing. Analytics Icon. Icon Related to Marketing - A flat design analytics icon, suitable for marketing, data analysis, or business content.
Free with trial Germany region map: colorful isometric top view. Detailed map of Germany regions. Vector illustration. Visualization vectors Germany region map: colorful isometric top view. Detailed map of Germany regions. Vector illustration
Free with trial Technology interactive whiteboard pen cartoon. education teaching, learning digital, writing display technology interactive whiteboard pen sign vector. Visualization vectors Technology interactive whiteboard pen vector cartoon graphic. Technology interactive whiteboard pen cartoon. education teaching, learning digital, writing. technology interactive whiteboard pen cartoon. education teaching, learning digital, writing display technology interactive whiteboard pen sign vector
Free with trial Seamless background featuring intersecting sinusoidal standing waves rendered in a deep midnight bloom gradient, ideal for modern web design, luxury branding, and decorative print applications. Visualization vectors Interfering Standing Waves Midnight Bloom Pattern. Seamless background featuring intersecting sinusoidal standing waves rendered in a deep midnight bloom. Seamless background featuring intersecting sinusoidal standing waves rendered in a deep midnight bloom gradient, ideal for modern web design, luxury branding, and decorative print applications
Free with trial Timeline infographic with infochart. Modern presentation template with 3 spets for business process. Website template on white background for concept modern design. Horizontal layout. Visualization vectors Timeline infographic with infochart. Modern presentation template with 3 spets for business process. Website template on. White background for concept modern. Timeline infographic with infochart. Modern presentation template with 3 spets for business process. Website template on white background for concept modern design. Horizontal layout
Free with trial Horizontal progress bar featuring 4 arrow-shaped elements, symbolizing the four stages of business strategy and progression. Clean timeline infographic design template. Vector for presentation. Visualization vectors Horizontal progress bar featuring 4 arrow-shaped elements, symbolizing the four stages of business strategy and. Progression. Clean timeline infographic design. Horizontal progress bar featuring 4 arrow-shaped elements, symbolizing the four stages of business strategy and progression. Clean timeline infographic design template. Vector for presentation.
Free with trial Cloud info bar chart vector illustration. Cloud info bar chart white background vector illustration. Visualization vectors Cloud info bar chart vector illustration. Cloud info bar chart white background vector illustration
Free with trial Business strategy, audience targeting, analytics, customer reviews, feedback evaluation, digital marketing. Bullseye location, bar chart and user feedback interface. Business strategy and audience. Visualization vectors Target Achievement, User Reviews, and Business Analytics Concept with Charts and Location Marker. Business strategy, audience targeting, analytics, customer. Business strategy, audience targeting, analytics, customer reviews, feedback evaluation, digital marketing. Bullseye location, bar chart and user feedback interface. Business strategy and audience
Free with trial A colorful upward arrow graphic symbolizing growth, progress, and success. The arrow features a blue outline with green, yellow, and orange sections, set against a white background. This image can be used to represent business growth, financial success, or upward trends in various contexts. Visualization vectors Upward Arrow Growth Concept. A colorful upward arrow graphic symbolizing growth, progress, and success. The arrow features a blue outline with green, yellow, and. A colorful upward arrow graphic symbolizing growth, progress, and success. The arrow features a blue outline with green, yellow, and orange sections, set against a white background. This image can be used to represent business growth, financial success, or upward trends in various contexts.
Free with trial Head-up display navigation map elements for the web and app. Futuristic user interface. Virtual graphic. Visualization vectors Head-up display navigation map elements for the web and app. Futuristic user interface. Virtual graphic
Free with trial Map australia isometric concept. 3d flat illustration of Map australia. Visualization vectors Map australia isometric concept. 3d flat illustration of Map australia
Free with trial SMART Goals Infographic Featuring Head Profiles with Arrow-Based Goal-Setting Framework. Vector Illustration. Visualization vectors SMART Goals Infographic Featuring Head Profiles with Arrow-Based Goal-Setting Framework. Vector Illustration
Free with trial Set of digital icons menu options, blockchain network nodes, and a line chart for web landing page banners. Technology, connectivity, data analysis, business, software, interface. Graphical symbols. Visualization vectors Data Analytics and Network Connection Icons Set for Web Landing Page Design. Set of digital icons menu options, blockchain network nodes, and a line chart for. Set of digital icons menu options, blockchain network nodes, and a line chart for web landing page banners. Technology, connectivity, data analysis, business, software, interface. Graphical symbols
Free with trial Abstract digital lock mechanism displays vibrant geometric forms symbolizing unified security through flowing energy lines and connection nodes. This composition works perfectly for cybersecurity visualization concepts and technology protection themes worldwide. Soft even lighting highlights smooth volumetric forms against layered fluid patterns creating visual depth quality. Generated with AI. Visualization vectors Vibrant Geometric Lock Mechanism With Flowing Energy Lines On Layered Abstract Background. Abstract digital lock mechanism displays vibrant geometric forms. Abstract digital lock mechanism displays vibrant geometric forms symbolizing unified security through flowing energy lines and connection nodes. This composition works perfectly for cybersecurity visualization concepts and technology protection themes worldwide. Soft even lighting highlights smooth volumetric forms against layered fluid patterns creating visual depth quality. Generated with AI
Free with trial Infographic Template. Data Visualization. Can be used for workflow layout, number of options, steps, diagram, graph, presentation, round chart and web design. Vector illustration. Visualization vectors Infographic Template. Data Visualization. Can be used for workflow layout, number of options, steps, diagram, graph. Presentation, round chart and web design
Free with trial A professional workspace features individuals engaged in activities like brainstorming, planning, and financial success, Customizable Semi Flat Illustration for Success Factors. Visualization vectors A professional workspace features individuals engaged in activities like brainstorming, planning, and financial success,. Customizable Semi Flat Illustration
Free with trial Data management, cloud computing, IT solutions, database organization, server administration, technology concepts. Man thinking beside a server stack and cloud icon. Data management and cloud. Visualization vectors Man Thinking About Data Storage Near a Server Icon and Cloud Symbol. Data management, cloud computing, IT solutions, database organization, server administration. Data management, cloud computing, IT solutions, database organization, server administration, technology concepts. Man thinking beside a server stack and cloud icon. Data management and cloud
Free with trial Person using stylus on digital tablet displaying analytics dashboard charts. Hand holding stylus pen interacting with tablet showing various charts and graphs. Visualization vectors Person using stylus on digital tablet displaying analytics dashboard charts. Hand holding stylus pen interacting with tablet showing various charts and graphs
 Sign in