This media is no longer available.
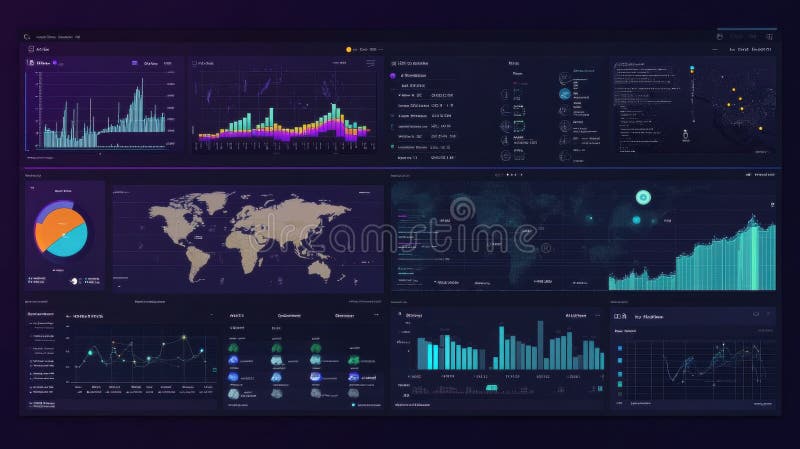
Dashboard featuring various data visualization elements on a dark background. Includes pie charts, bar graphs, line graphs, circular progress indicators, and segmented charts. Each section is labeled with various metrics and percentages, such as energy usage and analysis of trends. Colors predominantly feature blues, yellows, and oranges, enhancing data differentiation. The layout is structured into multiple panels with headers separating individual sections.
Exclusively on Dreamstime
- ?
$62.50USD
$150.00USD
$250.00USD
Size MAX
8200x8200px •
27.3" x 27.3" • @300dpi •
4.8MB • jpg
Author credit line