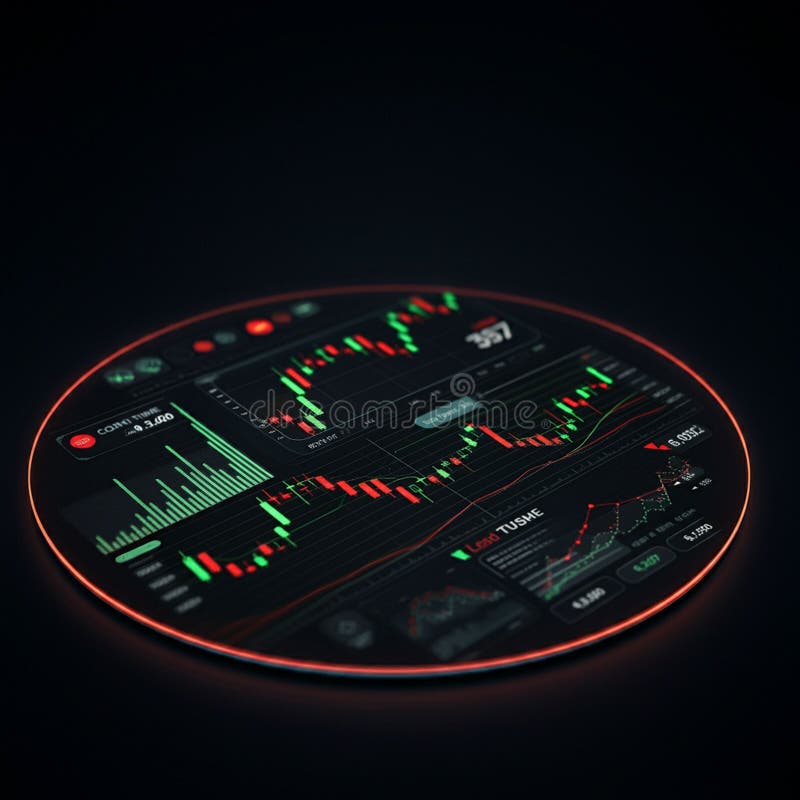
Royalty-Free AI generated

A digital financial chart with a black background displaying data visualization. Features include bar graphs, candlestick charts, and ascending teal and red trend lines, indicating upward market trends. The background has a faint world map, suggesting global market analysis. Numbers along the axes represent data values, while various chart elements signify different data metrics. These visuals are typically used for stock market analysis and financial forecasting.
Exclusively on Dreamstime
- ?
$62.50USD
$150.00USD
$250.00USD
Size MAX
8200x8200px •
27.3" x 27.3" • @300dpi •
4.6MB • jpg
Author credit line
Image keywords
More similar stock illustrations


