This media is no longer available.
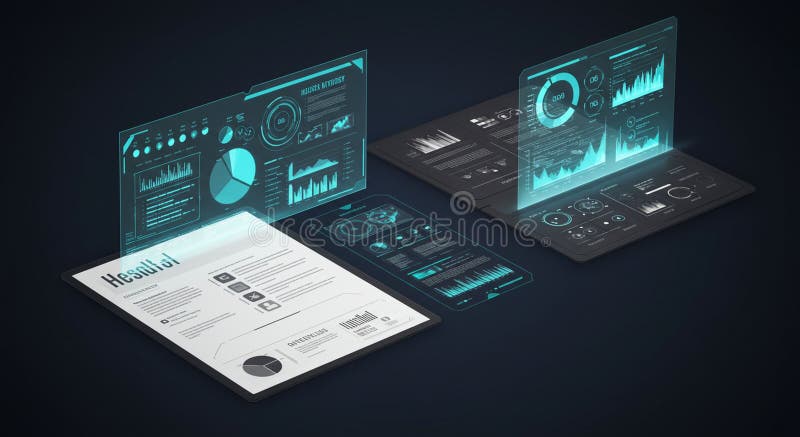
Digital interface displaying assorted data visualizations, including bar graphs, line charts, and pie charts set against a dark background. Global map highlights geographic data distribution. Blue neon hues and geometric graphics convey a futuristic technology theme. Various charts show analytics with percentage values and numerical indicators. This screens likely represent data analysis or technological monitoring used in professional or research contexts, reflecting complex data analysis systems.
Exclusively on Dreamstime
- ?
$62.50USD
$150.00USD
$250.00USD
Size MAX
10000x5455px •
33.3" x 18.2" • @300dpi •
5.3MB • jpg
Author credit line

Image keywords
Related searches
Here are some similar media files that might interest you: