Royalty-Free AI generated

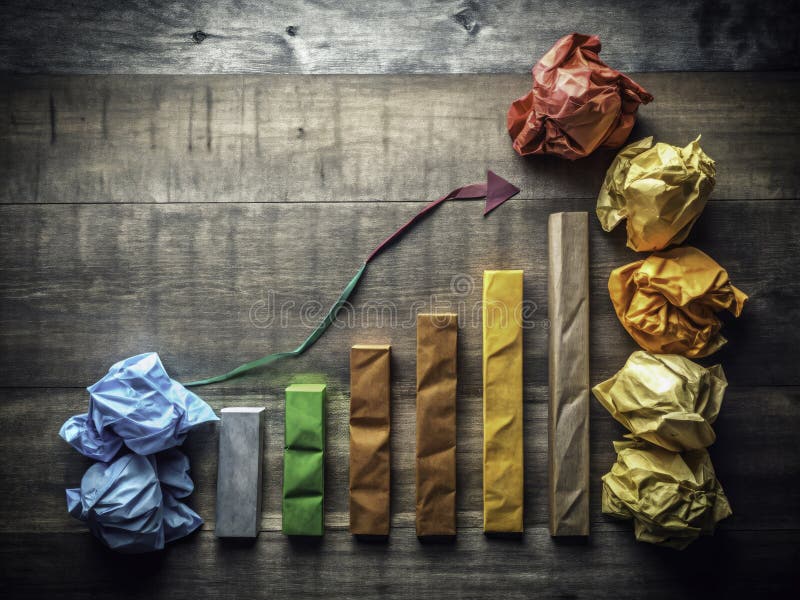
Visualizing Economic Growth A Chalkboard Chart of Financial Market Trends and Business Performance. This engaging chalkboard graph provides a dynamic visualization of key economic indicators. The chart effectively displays financial business growth, market trend analysis, and economic data, offering a clear overview of market performance. From stock market trends to overall economic stability, this visual representation makes complex data accessible and understandable. Whether you're an
- ?
$62.50USD
$150.00USD
$250.00USD
Size MAX
7280x4096px •
24.3" x 13.7" • @300dpi •
18.4MB • jpg
Author credit line

Image keywords
Related searches
More similar stock illustrations


More stock photos from Kaitisak Sansukho's portfolio