Free with trial Act now versus do nothing on a switch, with switch in act now position, white background. immediate action opportunity concept. Actionable illustrations Act now versus do nothing
Free with trial Vector concept illustrating the idea of analytics; depicting how raw data is processed to produce actionable information. Actionable vectors Data Analytics. Vector concept illustrating the idea of analytics; depicting how raw data is processed to produce actionable information
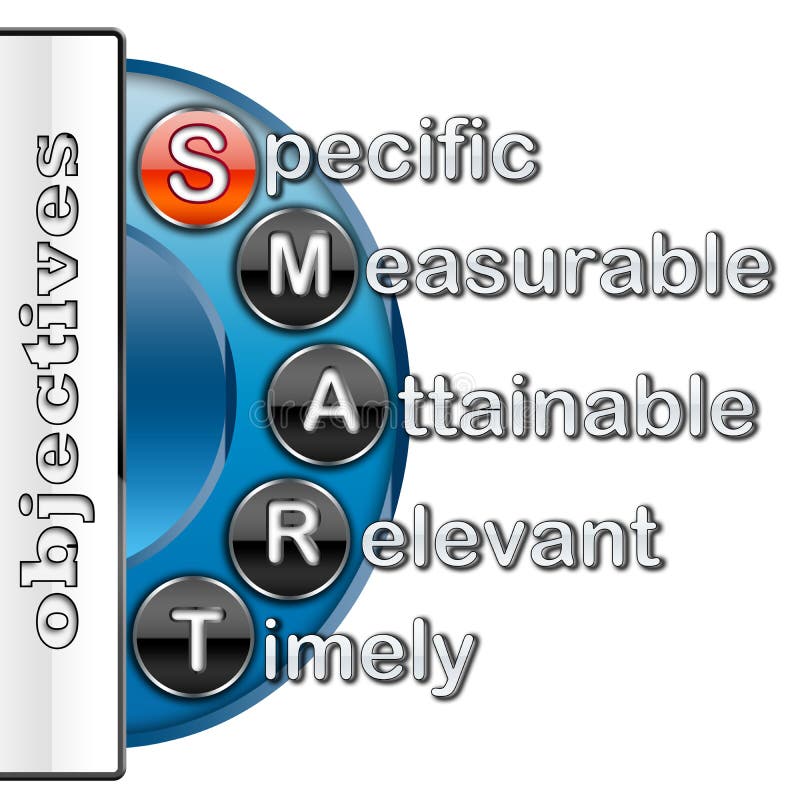
Free with trial Smart objectives template: specific mesurable attainable relevant and timely. Actionable illustrations Smart objectives
Free with trial Now word on clock dial white background, concept of immediate actionable item in business or personal life. Actionable illustrations Now is the time. Now word on clock dial white background, concept of immediate actionable item in business or personal life
Free with trial Vector concept illustrating the idea of analytics; depicting how raw data is processed to produce actionable information. Actionable vectors Data analytics. Vector concept illustrating the idea of analytics; depicting how raw data is processed to produce actionable information
Free with trial Radial lines comics books. Flash ray blast glow boom speed burst action effect bang explosion power ray motion vector background. Actionable vectors Radial lines comics books. Flash ray blast glow boom speed burst action effect bang explosion power motion background
Free with trial Vector illustration of Hand drawn concept whiteboard drawing - actionable data and analytics cycle. Actionable vectors Hand drawn concept whiteboard drawing - actionable data and anal
Free with trial Actionable insight button on white background. Actionable illustrations Actionable insight button on white
Free with trial Analyzing predictive kpi dashboard on laptop for actionable business growth insights, Generated by AI. Actionable illustrations Analyzing predictive kpi dashboard on laptop for actionable business growth insights
Free with trial AI-Driven Social Media Analytics abstract concept vector illustration. AI monitors social media trends and suggests actionable marketing strategies. abstract metaphor. Actionable vectors AI-Driven Social Media Analytics abstract concept vector illustration.
Free with trial Progress starts with a single step on blue background. Actionable illustrations Progress starts with a single step on blue
Free with trial 3d render illustration of block banner design for word text CTA acronym abbreviation of Call To Action. Actionable illustrations 3d render illustration of word text CTA acronym abbreviation of Call To Action. 3d render illustration of block banner design for word text CTA acronym abbreviation of Call To Action
Free with trial What should i do on blue background. Actionable illustrations What should i do on blue
Free with trial Share your insight on white paper background. Actionable illustrations Share your insight on white paper
Free with trial Movie production clapper board on a white background. Actionable illustrations Movie production clapper board
Free with trial Movie production clapper board on a blue background. Actionable illustrations Movie production clapper board
Free with trial Realization concept line icon. Simple element illustration. realization concept outline symbol. Actionable vectors Realization concept line icon. Simple
Free with trial Illegal rubber stamp. Grunge design with dust scratches. Effects can be easily removed for a clean, crisp look. Color is easily changed. Actionable vectors Illegal rubber stamp
Free with trial Illegal rubber stamp. Grunge design with dust scratches. Effects can be easily removed for a clean, crisp look. Color is easily changed. Actionable vectors Illegal rubber stamp
Free with trial Logistics analyst examining logistics data chart, Supply chain optimization and evaluating logistical information for operational efficiency goals and risk mitigation, Approach for logistical. Actionable illustrations Logistics analyst
Free with trial Transform raw data into actionable insights with this visually compelling data analysis. Designed for maximum clarity and impact, the charts feature crisp line graphs and robust bar charts presented on a clean white background. Ideal for business reports, presentations, and dashboards, this meticulously crafted design ensures your data is easily understood and your message resonates effectively. Actionable illustrations Visualizing Business Insights: Clear, Concise Data Analysis with Line and Bar Charts for Powerful. Transform raw data into actionable insights with this visually compelling data analysis. Designed for maximum clarity and impact, the charts feature crisp line graphs and robust bar charts presented on a clean white background. Ideal for business reports, presentations, and dashboards, this meticulously crafted design ensures your data is easily understood and your message resonates effectively
Free with trial Martin Luther King Jr. Day Poster with American Colors. Actionable vectors Graphic Design Celebrating MLK Day and Equality. Martin Luther King Jr. Day Poster with American Colors
Free with trial Streamline your workflow and unlock powerful insights with a modern spreadsheet application on your laptop. This image showcases the essential tools for efficient data management, analysis, and presentation. From detailed tables and formulas to charts and graphs, this digital workspace empowers users to transform raw data into actionable intelligence. Whether you're a small business owner, a. Actionable illustrations Boosting Business Productivity with Spreadsheet Software on a Modern Laptop A Comprehensive Guide to Data Analysis and. Streamline your workflow and unlock powerful insights with a modern spreadsheet application on your laptop. This image showcases the essential tools for efficient data management, analysis, and presentation. From detailed tables and formulas to charts and graphs, this digital workspace empowers users to transform raw data into actionable intelligence. Whether you're a small business owner, a
Free with trial Visualize your building's roof from a unique perspective with our professional drone inspection services. Our aerial roof photography provides detailed, comprehensive images of every rooftop surface, capturing intricate details and potential issues that might be missed from ground-level. This advanced aerial imaging technology enables swift and accurate identification of problems like leaks,. Actionable illustrations Capture Comprehensive Building Roof Inspections with Aerial Drone Photography HighQuality Images for Effective. Visualize your building's roof from a unique perspective with our professional drone inspection services. Our aerial roof photography provides detailed, comprehensive images of every rooftop surface, capturing intricate details and potential issues that might be missed from ground-level. This advanced aerial imaging technology enables swift and accurate identification of problems like leaks,
Free with trial Two women discussing ideas in a collaborative setting, surrounded by symbolic creative elements. Actionable illustrations Creative brainstorming session between two colleagues collaborating on ideas. Two women discussing ideas in a collaborative setting, surrounded by symbolic creative elements
Free with trial Career readiness program concept icon. Actionable career plans development abstract idea thin line illustration. College graduates preparation. Vector isolated outline color drawing. Editable stroke. Actionable vectors Career readiness program concept icon
Free with trial Data analysis linear icons set. Analytics, Big data, Insights, Metrics, Visualization, Dashboards, Statistics line vector and concept signs. Mining,Patterns,Predictions outline illustrations. Actionable vectors Data analysis linear icons set. Analytics, Big data, Insights, Metrics, Visualization, Dashboards, Statistics vector. Data analysis linear icons set. Analytics, Big data, Insights, Metrics, Visualization, Dashboards, Statistics line vector and concept signs. Mining,Patterns,Predictions outline illustrations
Free with trial Quick tips text on speech bubble with blue background. 3d render. Actionable illustrations Quick tips text on speech bubble with blue background.
Free with trial This icon embodies the power of text analytics, which allows businesses to extract valuable insights from customer feedback and conversations. With this tool, companies can understand customer sentiment, identify trending topics and improve their overall customer experience. The icon symbolizes the ability to turn data into actionable insights, providing a competitive advantage in today's market. Actionable illustrations A Text analytics icon representing the analysis of text data to understand customer sentiment and created with Generative AI. This icon embodies the power of text analytics, which allows businesses to extract valuable insights from customer feedback and conversations. With this tool, companies can understand customer sentiment, identify trending topics and improve their overall customer experience. The icon symbolizes the ability to turn data into actionable insights, providing a competitive advantage in today's market.
Free with trial Customer feedback loops strategy infographic diagram presentation banner template has ask, collect, analyse and plan, implement and notify. Business vector. Products and services improvement concepts. Actionable vectors Customer feedback loops strategy infographic diagram presentation banner template has ask, collect, analyse and plan, implement
Free with trial Generated with the use of AI. Data Analyst Activating Business Intelligence (BI) Virtual Dashboard for Data-Driven Decision Making and Performance Metrics. Actionable illustrations Data Analyst Activating Business Intelligence BI Virtual Dashboard for Data-Driven Decision Making and Performance Metrics. Generated with the use of AI. Data Analyst Activating Business Intelligence (BI) Virtual Dashboard for Data-Driven Decision Making and Performance Metrics
Free with trial This photo depicts a Real Estate Metrics Dashboard that showcases data-driven insights for digital marketing and home sales evaluation. This mobile app concept is designed for real estate professionals and provides a comprehensive overview of key metrics that help in tracking and analyzing the performance of online marketing campaigns and home sales. The dashboard is visually appealing and easy to navigate, providing real-time data and actionable insights to help real estate agents make informed decisions. This image conveys the importance of data-driven decision-making in the real estate industry and the need for advanced technological solutions to improve performance and efficiency. Actionable illustrations Real Estate Metrics Dashboard for Digital Marketing and Home Sales Evaluation - Mobile App Concept. This photo depicts a Real Estate Metrics Dashboard that showcases data-driven insights for digital marketing and home sales evaluation. This mobile app concept is designed for real estate professionals and provides a comprehensive overview of key metrics that help in tracking and analyzing the performance of online marketing campaigns and home sales. The dashboard is visually appealing and easy to navigate, providing real-time data and actionable insights to help real estate agents make informed decisions. This image conveys the importance of data-driven decision-making in the real estate industry and the need for advanced technological solutions to improve performance and efficiency.
Free with trial Customer analytics outline icons collection. Segmentation, Demographics, Persona, Acquisition, Retention, Loyalty. Actionable vectors Customer analytics line icons collection. Segmentation, Demographics, Persona, Acquisition, Retention, Loyalty
Free with trial Membership line icons collection. Metrics, KPIs, Evaluation, Analytics, Scorecards, Benchmarking, Efficiency vector and. Actionable vectors Membership line icons collection. Metrics, KPIs, Evaluation, Analytics, Scorecards, Benchmarking, Efficiency vector and
Free with trial Data analytics linear icons set. Insight, Visualization, Trends, Dashboards, Algorithms, Business Intelligence, Predictions vector symbols and line concept signs. Metrics,Reports,Analysis illustration. Actionable vectors Data analytics linear icons set. Insight, Visualization, Trends, Dashboards, Algorithms, Business Intelligence
Free with trial Performance measures line icons collection. Metrics, KPIs, Evaluation, Analytics, Scorecards, Benchmarking, Efficiency. Actionable vectors Performance measures line icons collection. Metrics, KPIs, Evaluation, Analytics, Scorecards, Benchmarking, Efficiency
Free with trial Business analytics linear icons set. Data-driven, Insights, Intelligence, Metrics, Analysis, Optimization, Predictive line vector and concept signs. Decision-making,Visualization,Performance outline illustrations. Actionable vectors Business analytics linear icons set. Data-driven, Insights, Intelligence, Metrics, Analysis, Optimization, Predictive
Free with trial Life coaching, helping to identify goals, overcome obstacles, and create actionable strategies to achieve personal or professional success. Infographics sketch. Actionable illustrations Life coaching, helping to identify goals, overcome obstacles, and create actionable strategies
Free with trial Actionable multi color concept icon. Project management, checklist audit. Workflow structure. Round shape line illustration. Abstract idea. Graphic design. Easy to use in presentation, brochure. Actionable vectors Actionable multi color concept icon
Free with trial Actionable blue gradient concept icon. Project management, checklist audit. Workflow structure. Round shape line illustration. Abstract idea. Graphic design. Easy to use in presentation, brochure. Actionable vectors Actionable blue gradient concept icon. Project management, checklist audit. Workflow structure. Round shape line illustration. Abstract idea. Graphic design
Free with trial Flowing digital streams merge into a dynamic representation of data processing. Vibrant lines in blue, purple, and pink converge, guiding numerical data in bright gold on a dark background. This illustrates the concept of transforming data into insightful business intelligence, emphasizing the dynamic journey from raw data to actionable insights. The visual metaphor highlights information processing, with lines symbolizing the systematic organization and analysis involved in business analytics. Actionable illustrations Transforming Raw Data into Actionable Business Intelligence for Strategic Growth. Flowing digital streams merge into a dynamic representation of data processing. Vibrant lines in blue, purple, and pink converge, guiding numerical data in bright gold on a dark background. This illustrates the concept of transforming data into insightful business intelligence, emphasizing the dynamic journey from raw data to actionable insights. The visual metaphor highlights information processing, with lines symbolizing the systematic organization and analysis involved in business analytics.
Free with trial This clear, black and white infographic illustrates the Internet of Things (IoT) data processing pipeline. It begins with a sensor collecting data, which is then transmitted via a gateway to a cloud platform for storage and processing. The data undergoes thorough analysis to extract meaningful insights, which are finally delivered as actionable information on a mobile application. This diagram is ideal for explaining smart technology, data analytics, and digital transformation concepts in presentations, articles, or educational materials, showcasing the journey from raw data to informed decisions. Actionable vectors IoT Data Flow Diagram: From Sensor to Actionable Insight on Mobile App. This clear, black and white infographic illustrates the Internet of Things (IoT) data processing pipeline. It begins with a sensor collecting data, which is then transmitted via a gateway to a cloud platform for storage and processing. The data undergoes thorough analysis to extract meaningful insights, which are finally delivered as actionable information on a mobile application. This diagram is ideal for explaining smart technology, data analytics, and digital transformation concepts in presentations, articles, or educational materials, showcasing the journey from raw data to informed decisions.
Free with trial Life coaching, helping to identify goals, overcome obstacles, and create actionable strategies to achieve personal or professional success. Infographics sketch. Actionable illustrations Life coaching, helping to identify goals, overcome obstacles, and create actionable strategies
Free with trial Actionable insight button on white background. Actionable illustrations Actionable insight button on white
Free with trial Rich analytics board visual for team decision support, designed to show clear signals, priorities, and actionable business insight. Actionable illustrations Actionable Analytics Board For Teams. Rich analytics board visual for team decision support, designed to show clear signals, priorities, and actionable business insight
Free with trial Specific measurable actionable realistic timebound on blue background. Actionable illustrations Specific measurable actionable realistic timebound on blue
Free with trial Visual representation of industry report highlights, showcasing data trends, findings, and actionable insights for business strategy. Actionable vectors Industry report highlight featuring key findings and actionable insights. Visual representation of industry report highlights, showcasing data trends, findings, and actionable insights for business strategy
Free with trial Conceptual illustration depicting the transformation of data into actionable insight. Central image of a brain-like circuit, representing processes such as data, wisdom, insight, context, and application. Surrounding icons include a book for information, a light bulb for ideas, a globe with a magnifying glass for data analysis, and gears with a bar graph for application. Labels highlight stages like synthesis and transformation, outlining a flow from information to actionable insight. Actionable illustrations Achieve Total Comprehension: A Conceptual Illustration Showing the Process of Transforming Data into Actionable Insight Through. Conceptual illustration depicting the transformation of data into actionable insight. Central image of a brain-like circuit, representing processes such as data, wisdom, insight, context, and application. Surrounding icons include a book for information, a light bulb for ideas, a globe with a magnifying glass for data analysis, and gears with a bar graph for application. Labels highlight stages like synthesis and transformation, outlining a flow from information to actionable insight.
Free with trial Explore a vibrant and futuristic concept featuring AI-driven robotics designed to generate actionable insights and transform technology. Actionable illustrations Futuristic AI Driven Robotics Generating Actionable Insights in a Vibrant Color Palette. Explore a vibrant and futuristic concept featuring AI-driven robotics designed to generate actionable insights and transform technology
Free with trial A retrospective poster filled with actionable items generated by the team focusing on what went well what didnt and potential improvements. Actionable vectors A retrospective poster filled with actionable items generated by the team focusing on what went well what didnt and
Free with trial In today's business landscape, a computer monitor on a desk represents the vital connection between data and actionable insights. With the right analytics tools, organizations can innovate and make strategic decisions driven by solid information processes, unleashing their true potential. Actionable illustrations Transforming Raw Information into Actionable Insights Using Advanced Data Analytics and Modern Technology Solutions. In today's business landscape, a computer monitor on a desk represents the vital connection between data and actionable insights. With the right analytics tools, organizations can innovate and make strategic decisions driven by solid information processes, unleashing their true potential
Free with trial Business Intelligence Tools: Transforming Data into Actionable Insights with Business Intelligence Tools, Enabling Real-Time Reporting, Data Analysis, and Forecasting for Smarter Decision-Making. Actionable illustrations Business Intelligence Tools Transforming Datinto Actionable Insights with Business Intelligence Tools, Enabling Real-Time. Business Intelligence Tools: Transforming Data into Actionable Insights with Business Intelligence Tools, Enabling Real-Time Reporting, Data Analysis, and Forecasting for Smarter Decision-Making
Free with trial Business Intelligence Tools: Transforming Data into Actionable Insights with Business Intelligence Tools, Enabling Real-Time Reporting, Data Analysis, and Forecasting for Smarter Decision-Making. Actionable illustrations Business Intelligence Tools Transforming Datinto Actionable Insights with Business Intelligence Tools, Enabling Real-Time. Business Intelligence Tools: Transforming Data into Actionable Insights with Business Intelligence Tools, Enabling Real-Time Reporting, Data Analysis, and Forecasting for Smarter Decision-Making
Free with trial Business Intelligence Tools: Transforming Data into Actionable Insights with Business Intelligence Tools, Enabling Real-Time Reporting, Data Analysis, and Forecasting for Smarter Decision-Making. Actionable illustrations Business Intelligence Tools Transforming Datinto Actionable Insights with Business Intelligence Tools, Enabling Real-Time. Business Intelligence Tools: Transforming Data into Actionable Insights with Business Intelligence Tools, Enabling Real-Time Reporting, Data Analysis, and Forecasting for Smarter Decision-Making
Free with trial Evocative abstract digital brain illustration representing artificial intelligence, actionable insights, and data processing. The design visualizes neural network connectivity, innovation, and futuristic technology. Ideal for illustrating concepts related to machine learning, AI-driven solutions, data analysis, strategic thinking, and the power of connected intelligence in modern computing and. Actionable illustrations Abstract digital brain illustration for actionable insights representing artificial intelligence connectivity and data processing. Evocative abstract digital brain illustration representing artificial intelligence, actionable insights, and data processing. The design visualizes neural network connectivity, innovation, and futuristic technology. Ideal for illustrating concepts related to machine learning, AI-driven solutions, data analysis, strategic thinking, and the power of connected intelligence in modern computing and
Free with trial Preventative Strategies An illustration of a checklist labeled Preventative Strategies filled with actionable items like screenings lifestyle changes that are informed by genomic. Actionable vectors Preventative Strategies An illustration of a checklist labeled Preventative Strategies filled with actionable items like
Free with trial Unlock the power of data to drive strategic success! This plan guides you to leverage actionable insights from data analytics to achieve your goals Learn how to transform data into a powerful tool for informed decision-making and impactful results AI Generative. Actionable illustrations Data-Driven Improvement Plan How to Leverage Insights for Strategic Success, Achieve Your Goals with Actionable Data Analytics. Unlock the power of data to drive strategic success! This plan guides you to leverage actionable insights from data analytics to achieve your goals Learn how to transform data into a powerful tool for informed decision-making and impactful results AI Generative
Free with trial Metrics actionable data illustration visualization patterns, strategies optimization, clarity organization metrics actionable data. Actionable illustrations Metrics actionable data
Free with trial Actionable Analytics is the process behind moving customer behavior analytics from purely informational to actionable, text concept on notepad. Actionable illustrations Actionable Analytics is the process behind moving customer behavior analytics from purely informational to actionable, text
Free with trial Cloud Analytics Actionable Insights Anywhere, 3d text isolated on white background - 3d rendering. Actionable illustrations Cloud Analytics Actionable Insights Anywhere, 3d text
Free with trial A vintage metal key rests on an old, textured map. To the left, a compass points north. Above the key, two holographic projections display icons: a hammer labeled "ACTIONABLE STEP" and a magnifying glass with a checklist icon, also labeled "ACTIONABLE STEP". Rays of light and dust particles create a mystical atmosphere. Actionable illustrations Vintage Key on Map with Compass and Actionable Steps. A vintage metal key rests on an old, textured map. To the left, a compass points north. Above the key, two holographic projections display icons: a hammer labeled "ACTIONABLE STEP" and a magnifying glass with a checklist icon, also labeled "ACTIONABLE STEP". Rays of light and dust particles create a mystical atmosphere
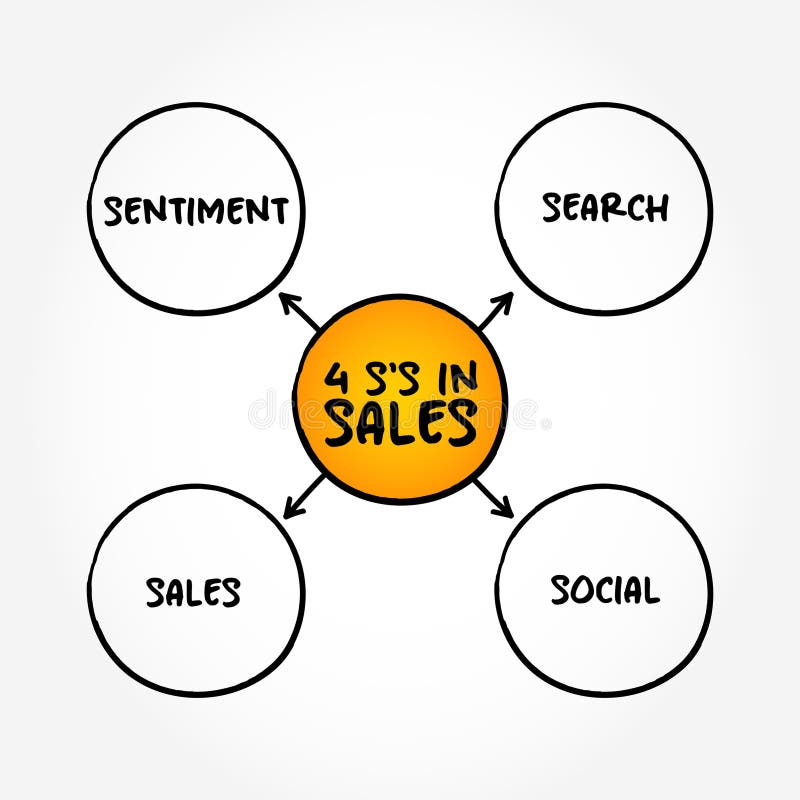
Free with trial 4 S's in Sales - unlock valuable, actionable insights for marketers, mind map concept background. Actionable illustrations 4 S\'s in Sales - unlock valuable, actionable insights for marketers, mind map concept background
Free with trial 4 S's in Sales - unlock valuable, actionable insights for marketers, mind map concept background. Actionable illustrations 4 S\'s in Sales - unlock valuable, actionable insights for marketers, mind map concept background
Free with trial Mobile and Cloud Computing, Transforming Data into Actionable Insights. Actionable illustrations Mobile and Cloud Computing, Transforming Data into Actionable Insights
Free with trial In the heart of a stylish white office featuring a sleek curved desk and a contemporary round chair, data, analytics, and business create a synergy. These interconnected pillars empower organizations to convert vast amounts of raw information into actionable insights, fueling smarter decision-making and driving innovation for strategic growth and success. Actionable illustrations Transforming Raw Information into Actionable Insights in a Modern White Office Setup. In the heart of a stylish white office featuring a sleek curved desk and a contemporary round chair, data, analytics, and business create a synergy. These interconnected pillars empower organizations to convert vast amounts of raw information into actionable insights, fueling smarter decision-making and driving innovation for strategic growth and success
Free with trial In today's competitive landscape, the synergy of data, analytics, and business is vital. A large screen displaying a comprehensive map exemplifies how information can be translated into actionable insights, fostering smarter decisions and innovation, ultimately driving strategic growth for organizations. Actionable illustrations Transforming Raw Data into Actionable Insights through Analytics on a Large Screen Map. In today's competitive landscape, the synergy of data, analytics, and business is vital. A large screen displaying a comprehensive map exemplifies how information can be translated into actionable insights, fostering smarter decisions and innovation, ultimately driving strategic growth for organizations
Free with trial Analyzing predictive kpi dashboard on laptop for actionable insights driving business growth, Generated by AI. Actionable illustrations Analyzing predictive kpi dashboard on laptop for actionable insights driving business growth
Free with trial In today's fast-paced business environment, a modern office with a large glass wall reflects transparency and collaboration. Data, analytics, and business strategies work together as interconnected pillars to turn raw information into actionable insights, fostering smarter decisions and driving innovation for strategic growth. Actionable illustrations Transforming Data and Analytics into Actionable Insights in a Modern Office with a Glass Wall. In today's fast-paced business environment, a modern office with a large glass wall reflects transparency and collaboration. Data, analytics, and business strategies work together as interconnected pillars to turn raw information into actionable insights, fostering smarter decisions and driving innovation for strategic growth
Free with trial This image illustrates a tablet displaying an advanced website design. It highlights how data, analytics, and business strategies are essential for transforming raw information into actionable insights, fostering innovation and strategic growth in modern organizations. A perfect example of technology driving smarter decisions in the digital age. Actionable illustrations Transforming Raw Data Into Actionable Insights Through Innovative Website Design on a Tablet. This image illustrates a tablet displaying an advanced website design. It highlights how data, analytics, and business strategies are essential for transforming raw information into actionable insights, fostering innovation and strategic growth in modern organizations. A perfect example of technology driving smarter decisions in the digital age
Free with trial A realistic image of a large digital funnel overflowing with online data and actionable insights. , Generated by AI. Actionable illustrations A realistic image of a large digital funnel overflowing with online data and actionable insights.
Free with trial Realistic image of a digital funnel overflowing with big data and actionable insights technology, Generated by AI. Actionable illustrations Realistic image of a digital funnel overflowing with big data and actionable insights technology
Free with trial In today's business landscape, the integration of data analytics and technology in workspace environments is crucial. A room equipped with a desk and a computer represents the nexus of information processing, fostering innovation and strategic growth through actionable insights drawn from raw data. Actionable illustrations Transforming Raw Data into Actionable Insights in a Modern Business Environment with Technology. In today's business landscape, the integration of data analytics and technology in workspace environments is crucial. A room equipped with a desk and a computer represents the nexus of information processing, fostering innovation and strategic growth through actionable insights drawn from raw data
Free with trial In today's fast-paced business landscape, data analytics serves as a critical pillar for organizations. The long white wall symbolizes the unbounded potential that data holds. By transforming raw information into actionable insights, businesses can foster innovation, drive strategic growth, and make smarter decisions. Embracing analytics is now essential for success. Actionable illustrations Transforming Raw Data into Actionable Insights Along the Long White Wall of Business Intelligence. In today's fast-paced business landscape, data analytics serves as a critical pillar for organizations. The long white wall symbolizes the unbounded potential that data holds. By transforming raw information into actionable insights, businesses can foster innovation, drive strategic growth, and make smarter decisions. Embracing analytics is now essential for success
Free with trial Explore how data, analytics, and business serve as interconnected pillars that enable organizations to transform raw data into actionable insights. This synergy drives smarter decision-making and fuels innovation and strategic growth in the contemporary corporate landscape, all while reflecting on the elegance of glass top tables. Actionable illustrations Transforming Data and Analytics into Actionable Insights with Business Innovation on Glass Tables. Explore how data, analytics, and business serve as interconnected pillars that enable organizations to transform raw data into actionable insights. This synergy drives smarter decision-making and fuels innovation and strategic growth in the contemporary corporate landscape, all while reflecting on the elegance of glass top tables
Free with trial Artistic depiction of a digital funnel illustrating big data from collection to actionable insights, Generated by AI. Actionable illustrations Artistic depiction of a digital funnel illustrating big data from collection to actionable insights
Free with trial In this modern white office, a large screen displays vital data analytics that interconnects various business pillars. This environment fosters innovation and strategic growth, helping organizations turn raw information into actionable insights for smarter decisions. Actionable illustrations Transforming Data into Actionable Insights in a Modern White Office Environment with Business Analytics. In this modern white office, a large screen displays vital data analytics that interconnects various business pillars. This environment fosters innovation and strategic growth, helping organizations turn raw information into actionable insights for smarter decisions
Free with trial This compelling infographic distills key performance indicators (KPIs) from a detailed business analytics report, offering actionable insights for strategic decision-making. A clear and engaging bar graph visualizes crucial data points like sales figures and customer acquisition costs, revealing trends, patterns, and outliers. The meticulously crafted chart design effectively communicates. Actionable illustrations Unlock Business Growth Actionable Insights from Comprehensive Business Analytics Report Visualized with a Clear Bar. This compelling infographic distills key performance indicators (KPIs) from a detailed business analytics report, offering actionable insights for strategic decision-making. A clear and engaging bar graph visualizes crucial data points like sales figures and customer acquisition costs, revealing trends, patterns, and outliers. The meticulously crafted chart design effectively communicates
Free with trial Decision support tools By analyzing multiple data points and providing actionable insights these apps can serve as powerful decision support tools helping farmers make informed. Vector. Actionable vectors Decision support tools By analyzing multiple data points and providing actionable insights these apps can serve as