Free with trial Six colorful science icons isolated on a black background. Analysis circular vectors Colorful science icons. Six colorful science icons isolated on a black background. Six colorful science icons isolated on a black background.
Free with trial Six sigma diagram scheme concept. Analysis circular vectors Six sigma diagram scheme concept. Vector Six sigma diagram scheme concept
Free with trial Futuristic concept HUD, GUI style. Screen Dashboard, Futuristic Circle, Space Elements, Infographics Vector Elements Set for HUD Sci Fi Interfaces. Hi tech future design. Sky fi for VR and App. Analysis circular vectors Futuristic concept HUD, GUI style. Screen VR. Futuristic concept HUD, GUI style. Screen Dashboard, Futuristic Circle, Space Elements, Infographics Vector. Futuristic concept HUD, GUI style. Screen Dashboard, Futuristic Circle, Space Elements, Infographics Vector Elements Set for HUD Sci Fi Interfaces. Hi tech future design. Sky fi for VR and App.
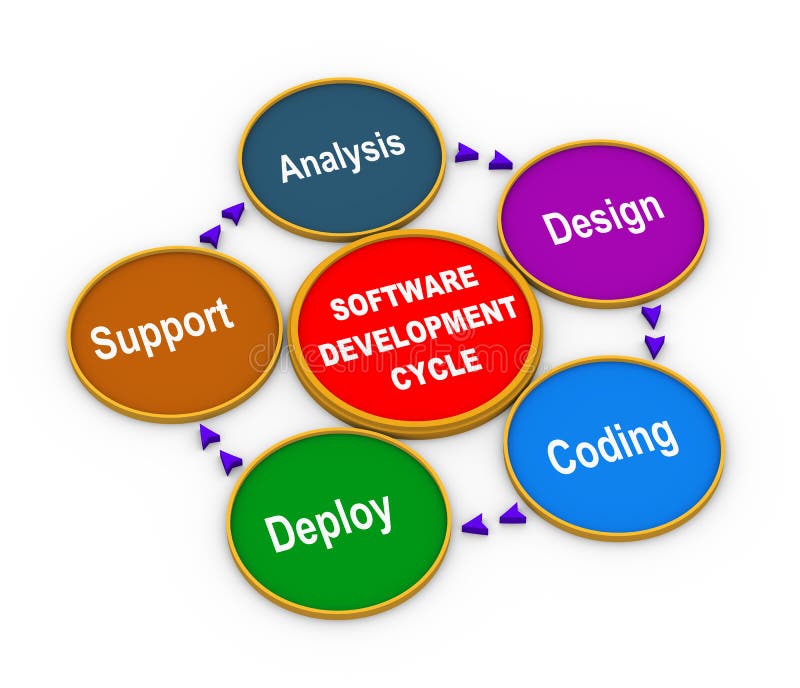
Free with trial 3d illustration of circular flow chart of life cycle of software development process. Analysis circular illustrations 3d process of software development. 3d illustration of circular flow chart of life cycle of software development process. 3d illustration of circular flow chart of life cycle of software development process.
Free with trial Core concept. Cross section of white sphere with red one inside isolated on white background. Analysis circular vectors Core concept. Cross section of white sphere with red one inside isolated on white background. Core concept
Free with trial Vector process diagram. Process diagram, vector clip art. Analysis circular vectors Vector process diagram. Process diagram, vector clip art
Free with trial Colored Human Body Anatomy Infographic Design on Blue Green Background. Analysis circular vectors Human Body Anatomy Infographic Design. Colored Human Body Anatomy Infographic Design on Blue Green Background. Colored Human Body Anatomy Infographic Design on Blue Green Background.
Free with trial 3d colorful flow chart diagram of seo plan (search engine optimization). Analysis circular illustrations 3d seo plan flowchart. 3d colorful flow chart diagram of seo plan (search engine optimization. 3d colorful flow chart diagram of seo plan (search engine optimization)
Free with trial Light Six sigma diagram scheme concept. Analysis circular vectors Light Six sigma diagram scheme concept. Vector Light Six sigma diagram scheme concept
Free with trial Abstract set of 3 HUD elements icon hi tech object design. Eps 10 vector. Analysis circular vectors Abstract set of 3 HUD elements icon hi tech object design. Eps 10 vector
Free with trial Collection of flat colorful diagram, bar and line graph, pie chart elements. Statistical data visualization concept. Simple infographic design template. Vector illustration for report, brochure. Analysis circular vectors Collection of flat colorful diagram, bar and line graph, pie chart elements. Statistical data visualization concept. Simple infographic design template. Vector
Free with trial Circular rack of test tubes. Circular rack of analysis test tubes, blue liquid. Analysis circular illustrations Circular rack of test tubes. Circular rack of analysis test tubes, blue liquid
Free with trial Infographic circular chart divided into 6 parts. Step-by step cycle diagram with six options designed for report, presentation, data visualization. Analysis circular vectors Infographic circular chart divided into 6 parts. Step-by step cycle diagram with six options. Infographic circular chart divided into 6 parts. Step-by step. Infographic circular chart divided into 6 parts. Step-by step cycle diagram with six options designed for report, presentation, data visualization.
Free with trial Vector Circular Infographics BIG collection for your graphs, product ranking, items classification, business presentation, high tech flyers or brochures. Analysis circular vectors Vector Circular Infographics BIG collection for your graphs. Product ranking, items classification, business presentation, high tech flyers or brochures
Free with trial Infographic circular chart divided into 10 parts. Step-by step cycle diagram with ten options designed for report, presentation, data visualization. Analysis circular vectors Infographic circular chart divided into 10 parts. Step-by step cycle diagram with ten options. Infographic circular chart divided into 10 parts. Step-by step. Infographic circular chart divided into 10 parts. Step-by step cycle diagram with ten options designed for report, presentation, data visualization.
Free with trial SWOT Analysis Diagram. SWOT analysis, circle diagram, infographic template. Analysis circular vectors SWOT Analysis Diagram. SWOT analysis, circle diagram, infographic template
Free with trial Vector Circular Infographics BIG collection for your graphs, product ranking, items classification, business presentation, high tech flyers or brochures. Analysis circular vectors Vector Circular Infographics BIG collection for your graphs. Product ranking, items classification, business presentation, high tech flyers or brochures
Free with trial Infographic design template with circular elements, 5 steps to success business concept. Project management and strategy planning visualization. Vector illustration for website, header, presentation. Analysis circular vectors Infographic design template with circular elements, 5 steps to success business concept. Project management and strategy planning visualization. Vector
Free with trial Advanced analysis big dat base symbol. Development of artificial intelligence sign. Abstract innovative high tech logo template. Colorful round icon from circles. Smart computer, machine learning. Analysis circular vectors Advanced analysis big dat base symbol. Development of artificial intelligence sign. Abstract innovative high tech logo. Template. Colorful round icon from. Advanced analysis big dat base symbol. Development of artificial intelligence sign. Abstract innovative high tech logo template. Colorful round icon from circles. Smart computer, machine learning
Free with trial Round shape, abstract vector dots logo. Unusual circles sign set. Biology virus, innovation technology icon. Circular isolated sun. Isolated circle orange symbol collection. Analysis circular vectors Round shape, abstract vector dots logo. Unusual circles sign set. Biology virus, innovation technology icon. Circular. Isolated sun. Isolated circle orange
Free with trial Four colorful elements with text inside placed around circle. Concept of SWOT-analysis template or strategic planning technique. Infographic design template. Vector illustration. Analysis circular vectors Four colorful elements with text inside placed around circle. Concept of SWOT-analysis template or strategic planning technique. Infographic design template
Free with trial Circular rack of test tubes, green liquid. Analysis circular illustrations Circular rack of test tubes. Green liquid
Free with trial 3d illustration of businessman presenting circular flow chart of life cycle of software development process. Analysis circular illustrations 3d man presenting software development process. 3d illustration of businessman presenting circular flow chart of life cycle of software development process. 3d illustration of businessman presenting circular flow chart of life cycle of software development process.
Free with trial Process diagram. Pattern of the process, information flow. Analysis circular illustrations Process diagram. Pattern of the process, information flow
Free with trial Process diagram. Pattern of the process, information flow. Analysis circular illustrations Process diagram. Pattern of the process, information flow
Free with trial Process diagram. Circle pattern of the process, information flow. Analysis circular illustrations Process diagram. Circle pattern of the process, information flow
Free with trial Process diagram. Pattern of the process, information flow. Analysis circular illustrations Process diagram. Pattern of the process, information flow
Free with trial Process diagram. Pattern of the process, information flow. Analysis circular illustrations Process diagram. Pattern of the process, information flow
Free with trial Process diagram. Pattern of the process, information flow. Analysis circular illustrations Process diagram. Pattern of the process, information flow
Free with trial Process diagram, vector clip art. Analysis circular vectors Process diagram. Vector clip art
Free with trial 3d render of pie arrow chart. Analysis circular illustrations 3d pie arrow chart. 3d render of pie arrow chart. 3d render of pie arrow chart.
Free with trial Three dimensional illustration of pie chart and rising graph with different colored sections, isolated on white background. Analysis circular vectors Pie chart and graph. Three dimensional illustration of pie chart and rising graph with different colored sections, isolated on white background. Three dimensional illustration of pie chart and rising graph with different colored sections, isolated on white background.
Free with trial Four part cycle diagram. On white background. Analysis circular vectors Four part cycle diagram. On white background
Free with trial Colourful business wheel chart. Design template of a colourful business wheel chart with seven segments or components and a central figure of a businessman. Analysis circular vectors Colourful business wheel chart. Design template of a colourful business wheel chart with seven segments or components and a central figure of a businessman
Free with trial Floral diagram presentation template with eight petals in differing colours each with space for headers and text around a central circle entitled Online Marketing. Analysis circular vectors Floral diagram presentation template. With eight petals in differing colours each with space for headers and text around a central circle entitled Online
Free with trial Four parts business diagram template. With arrows and a cyclic arrow in the middle. Analysis circular vectors Four parts business diagram template. With arrows and a cyclic arrow in the middle
Free with trial Big data analytics background concept. Blue circles and bubbles as illustration. Analysis circular vectors Big data analytics background concept. Blue circles and bubbles as illustration
Free with trial Cross section of white sphere with red core inside. 3d. Analysis circular illustrations Cross section of white sphere with red core inside. 3d
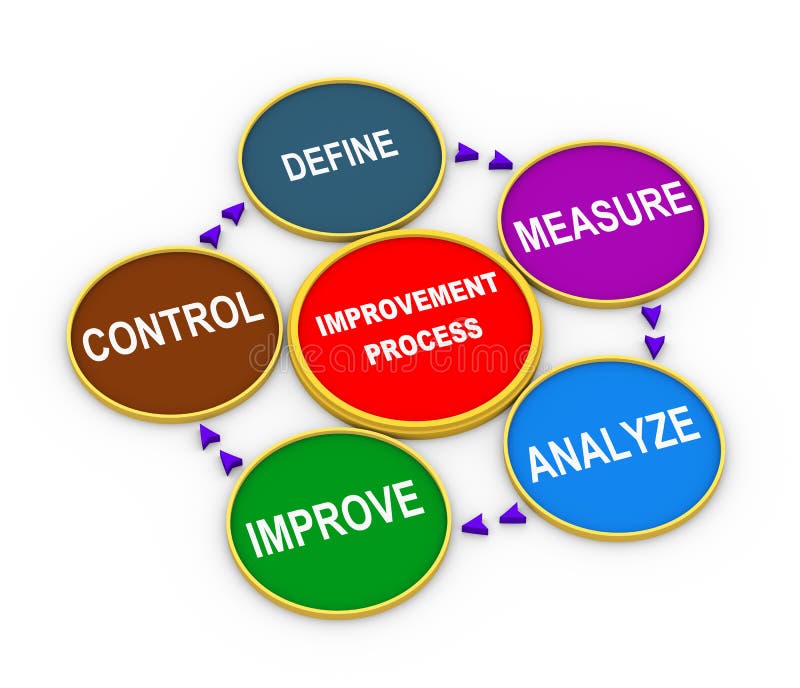
Free with trial 3d Illustration of chart life cycle of improvement process concept. Analysis circular illustrations 3d improvement process cycle. 3d Illustration of chart life cycle of improvement process concept. 3d Illustration of chart life cycle of improvement process concept.
Free with trial 3d illustration of man standing with circular arrow chart of concept of improvement process. 3d human person character and white people. Analysis circular illustrations 3d man with six sigma concept. 3d illustration of man standing with circular arrow chart of concept of improvement process. 3d human person character and white. 3d illustration of man standing with circular arrow chart of concept of improvement process. 3d human person character and white people
Free with trial Three part round diagram. S set. Analysis circular vectors Three part round diagram. S set
Free with trial Abstract set of 3 HUD UI icon innovation concept elements design on white background. Eps 10 vector. Analysis circular vectors Abstract set of 3 HUD UI icon innovation concept elements design on white background. Eps 10 vector
Free with trial Chart and graphic isometric, business diagram data finance, graph report, information data statistic, infographic. Analysis tools illustration. Analysis circular vectors Chart and graphic isometric, business diagram data finance, graph report, information data statistic, infographic. Analysis tools illustration
Free with trial Heptagon infographic. Chart, diagram with 7 steps, options, parts, processes. Vector design element. eps 10. Analysis circular vectors Heptagon infographic. Chart, diagram with 7 steps, options, parts, processes. Vector design element. Eps 10
Free with trial Large set of colored pie charts. 2,3,4,5,6,8 sections. Flat icons. For infographics in web design. vector illustration isolated on white background. Analysis circular vectors Large set of colored pie charts. 2,3,4,5,6,8 sections. Flat icons. For infographics in web design. vector illustration isolated on white background
Free with trial Abstract technology ui futuristic concept hud health interface hologram elements of digital data chart,communication, Brain,DNA,circle percent vitality innovation on hi tech future design background. Analysis circular vectors Abstract technology ui futuristic concept hud health interface h. Ologram elements of digital data chart,communication, Brain,DNA,circle percent vitality. Abstract technology ui futuristic concept hud health interface hologram elements of digital data chart,communication, Brain,DNA,circle percent vitality innovation on hi tech future design background
Free with trial Abstract technology ui futuristic concept human digital DNA health care of hud interface hologram elements of digital data chart, communication,innovation on hi tech future design background. Analysis circular vectors Abstract technology ui futuristic concept human digital DNA heal. Th care of hud interface hologram elements of digital data chart, communication,innovation on. Abstract technology ui futuristic concept human digital DNA health care of hud interface hologram elements of digital data chart, communication,innovation on hi tech future design background
Free with trial Vector techno background with crcular sound vibration. Resonance. Pulse. cardiogram. Analysis circular vectors Vector techno background with crcular sound vibration. Resonance. Pulse. cardiogram
Free with trial Abstract technology ui futuristic concept hud interface hologram elements of digital data chart, communication, computing and circle percent vitality innovation on hi tech future design background. Analysis circular vectors Abstract technology ui futuristic concept hud interface. Hologram elements of digital data chart, communication, computing and circle percent vitality. Abstract technology ui futuristic concept hud interface hologram elements of digital data chart, communication, computing and circle percent vitality innovation on hi tech future design background
Free with trial Pie chart set. Colorful diagram collection with 2,3,4,5,6 sections or steps. Circle icons for infographic, UI, web design, business presentation. Vector illustration. Analysis circular vectors Pie chart set. Colorful diagram collection with 2,3,4,5,6 sections or steps. Circle icons for infographic, UI, web design. Business presentation. Vector
Free with trial Pie circle chart. 12 section. Vector circle graph for infographic. Twelve flat cyrcle diagram. 1, 2, 3 4 5 6 7 8 9 10 11 12 steps or processes. Analysis circular vectors Pie circle chart. 12 section. Vector circle graph for infographic. Twelve flat cyrcle diagram. 1, 2, 3 4 5 6 7 8 9 10 11 12 steps or processes
Free with trial Set pie charts, graphs in 2,3,4,5,6 segments. Segmented circles. Colorful icons. - Royalty free vector illustration. Analysis circular vectors Set pie charts, graphs in 2,3,4,5,6 segments. Segmented circles. Colorful icons. - Royalty free vector illustration
Free with trial Creative vector illustration of business presentation slide template circle venn diagram isolated on transparent background. Art design infographic diagram chart. Abstract concept graphic element. Analysis circular vectors Creative vector illustration of business presentation slide template circle venn diagram isolated on transparent. Background. Art design infographic diagram. Creative vector illustration of business presentation slide template circle venn diagram isolated on transparent background. Art design infographic diagram chart. Abstract concept graphic element.
Free with trial Futuristic interface hud design, infographic elements like scanning graph or waves, Sci-fi futuristic hud dashboard. Display virtual reality technology screen e. Analysis circular vectors Futuristic interface hud design, infographic elements like scanning graph or waves, Sci-fi futuristic hud dashboard. Display virtual reality technology screen e
Free with trial Data analytics circular illustration - vector modern creative financial analysis or statistics concept symbol on dark background. Analysis circular vectors Data analytics circular illustration. Vector modern creative financial analysis or statistics concept symbol on dark background
Free with trial Statistics and data analysis colorful illustration - vector circular sign with graphs and diagrams. Analysis circular vectors Statistics and data analysis colorful illustration. Vector circular sign with graphs and diagrams
Free with trial 3d illustration of man with magnifier analysing circular flow chart of life cycle of software development process. 3d rendering of human people character. Analysis circular illustrations 3d man software development analysis. 3d illustration of man with magnifier analysing circular flow chart of life cycle of software development process. 3d. 3d illustration of man with magnifier analysing circular flow chart of life cycle of software development process. 3d rendering of human people character.
Free with trial Infographic semi circular chart divided into 3 parts. Step-by step diagram with three options designed for report, presentation, data visualization. Analysis circular vectors Infographic semi circular chart divided into 3 parts. Step-by step diagram with three options. Infographic semi circular chart divided into 3 parts. Step-by. Infographic semi circular chart divided into 3 parts. Step-by step diagram with three options designed for report, presentation, data visualization.
Free with trial Circular economy word cloud concept. On white background. Analysis circular illustrations Circular economy word cloud concept. On white background
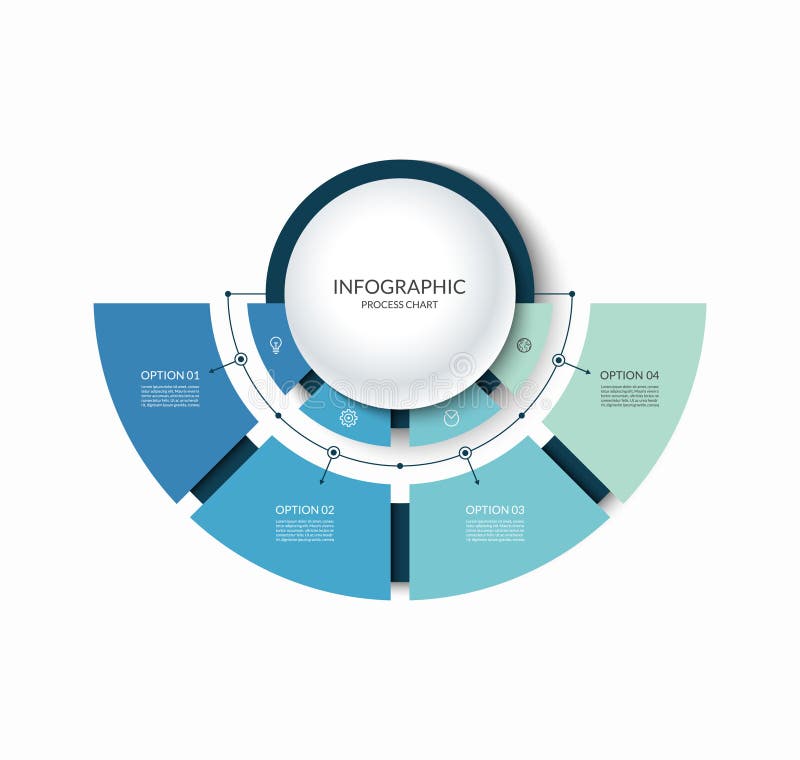
Free with trial Infographic semi circular chart divided into 4 parts. Step-by step diagram with four options designed for report, presentation, data visualization. Analysis circular vectors Infographic semi circular chart divided into 4 parts. Step-by step diagram with four options. Infographic semi circular chart divided into 4 parts. Step-by step. Infographic semi circular chart divided into 4 parts. Step-by step diagram with four options designed for report, presentation, data visualization.
Free with trial SWOT analysis circle diagram infographic template. Analysis circular vectors SWOT Analysis Diagram. SWOT analysis circle diagram infographic template. SWOT analysis circle diagram infographic template
Free with trial Infographic semi circular chart divided into 3 parts. Step-by step diagram with three options designed for report, presentation, data visualization. Analysis circular vectors Infographic semi circular chart divided into 3 parts. Step-by step diagram with three options. Infographic semi circular chart divided into 3 parts. Step-by. Infographic semi circular chart divided into 3 parts. Step-by step diagram with three options designed for report, presentation, data visualization.
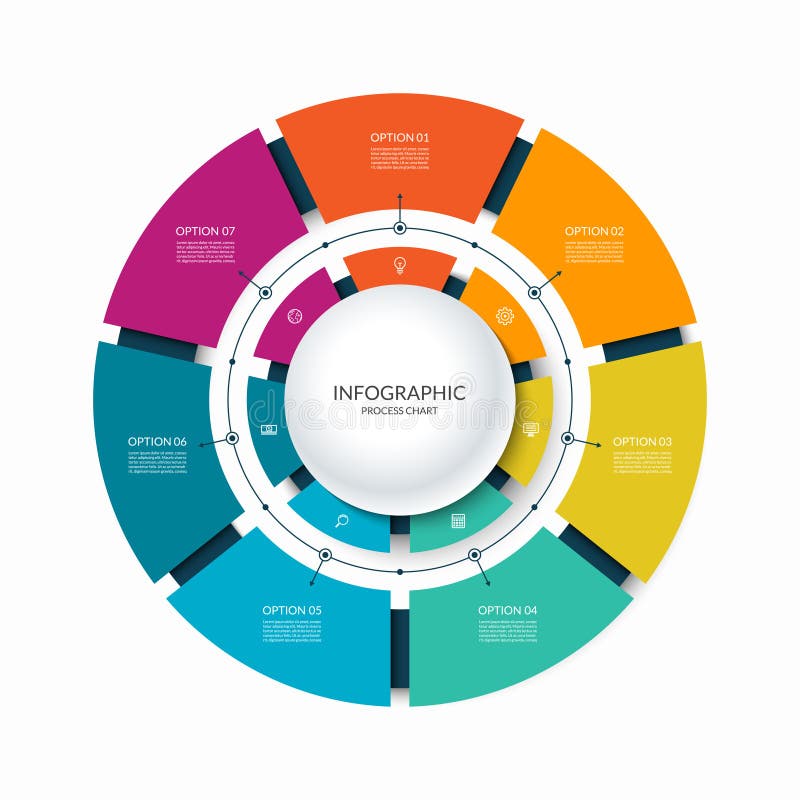
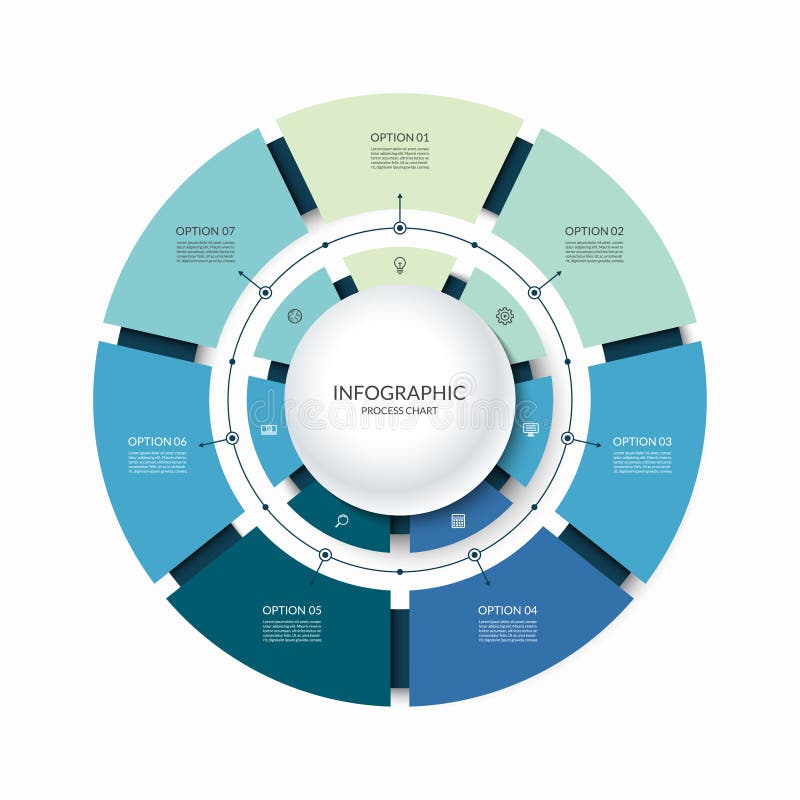
Free with trial Infographic circular chart divided into 7 parts. Step-by step cycle diagram with seven options designed for report, presentation, data visualization. Analysis circular vectors Infographic circular chart divided into 7 parts. Step-by step cycle diagram with seven options. Infographic circular chart divided into 7 parts. Step-by step. Infographic circular chart divided into 7 parts. Step-by step cycle diagram with seven options designed for report, presentation, data visualization.
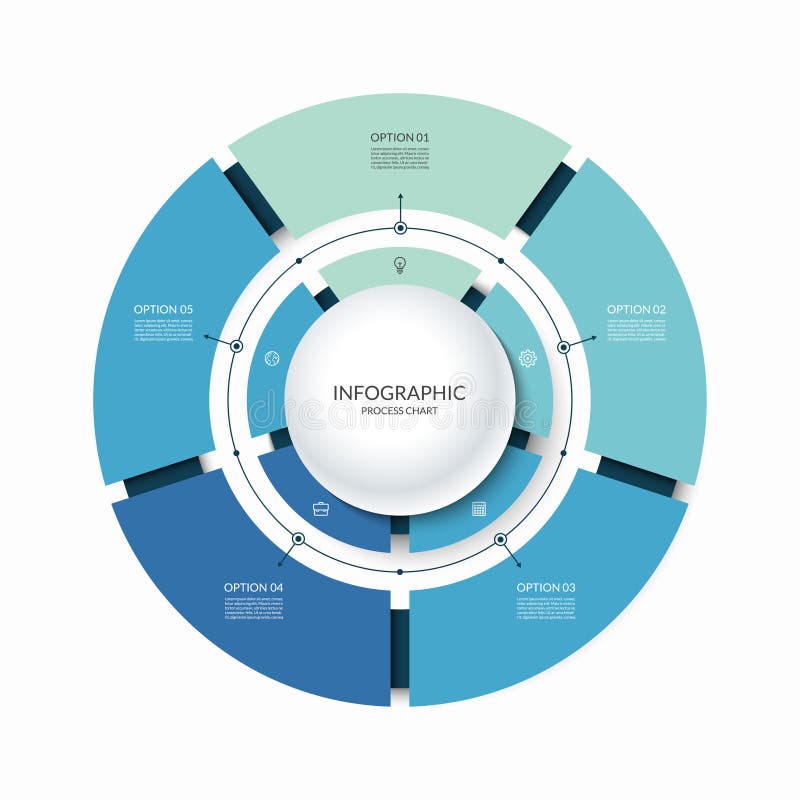
Free with trial Infographic circular chart divided into 5 parts. Step-by step cycle diagram with five options designed for report, presentation, data visualization. Analysis circular vectors Infographic circular chart divided into 5 parts. Step-by step cycle diagram with five options. Infographic circular chart divided into 5 parts. Step-by step. Infographic circular chart divided into 5 parts. Step-by step cycle diagram with five options designed for report, presentation, data visualization.
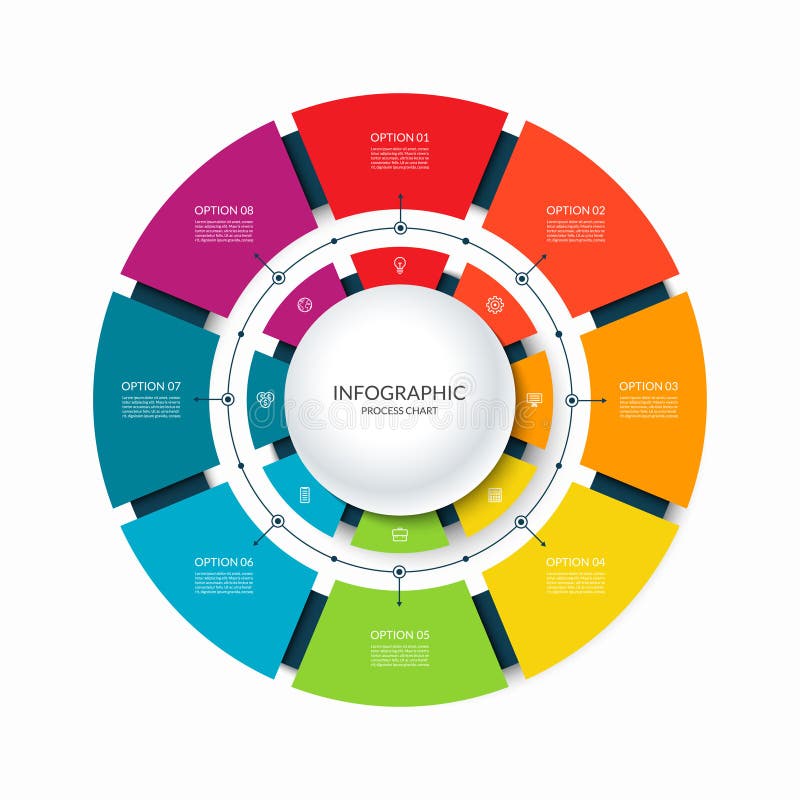
Free with trial Infographic circular chart divided into 8 parts. Step-by step cycle diagram with eight options designed for report, presentation, data visualization. Analysis circular vectors Infographic circular chart divided into 8 parts. Step-by step cycle diagram with eight options. Infographic circular chart divided into 8 parts. Step-by step. Infographic circular chart divided into 8 parts. Step-by step cycle diagram with eight options designed for report, presentation, data visualization.
Free with trial Infographic circular chart divided into 10 parts. Step-by step cycle diagram with ten options designed for report, presentation, data visualization. Analysis circular vectors Infographic circular chart divided into 10 parts. Step-by step cycle diagram with ten options. Infographic circular chart divided into 10 parts. Step-by step. Infographic circular chart divided into 10 parts. Step-by step cycle diagram with ten options designed for report, presentation, data visualization.
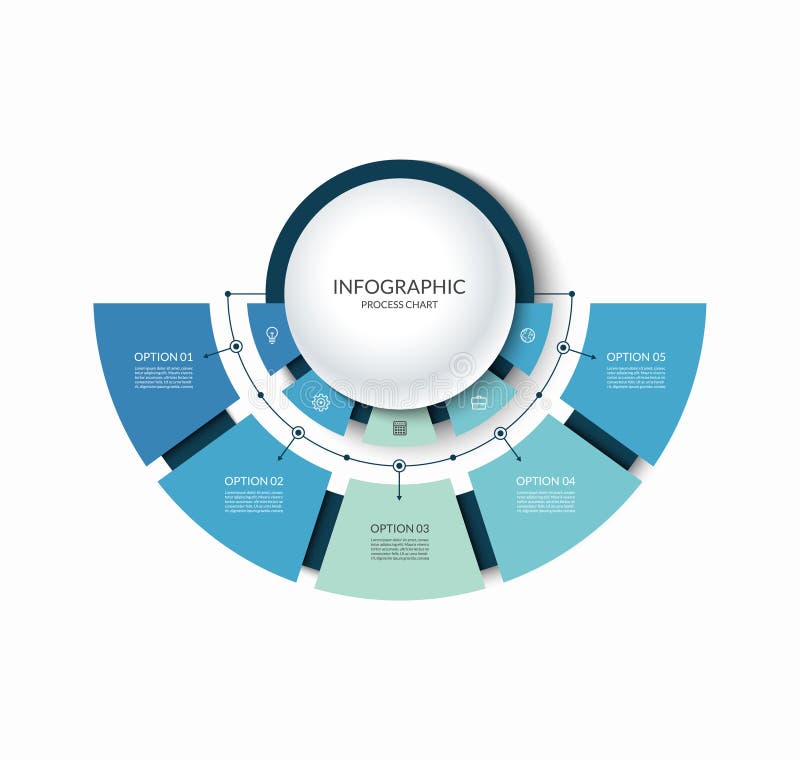
Free with trial Infographic semi circular chart divided into 5 parts. Step-by step diagram with five options designed for report, presentation, data visualization. Analysis circular vectors Infographic semi circular chart divided into 5 parts. Step-by step diagram with five options. Infographic semi circular chart divided into 5 parts. Step-by step. Infographic semi circular chart divided into 5 parts. Step-by step diagram with five options designed for report, presentation, data visualization.
Free with trial Infographic circular chart divided into 7 parts. Step-by step cycle diagram with seven options designed for report, presentation, data visualization. Analysis circular vectors Infographic circular chart divided into 7 parts. Step-by step cycle diagram with seven options. Infographic circular chart divided into 7 parts. Step-by step. Infographic circular chart divided into 7 parts. Step-by step cycle diagram with seven options designed for report, presentation, data visualization.
Free with trial Circular arrows for infographics. Chart, graph, diagram with 6 steps, options, parts. Vector business template. eps 10. Analysis circular vectors Circular arrows for infographics. Chart, graph, diagram with 6 steps, options, parts. Vector business template. Eps 10
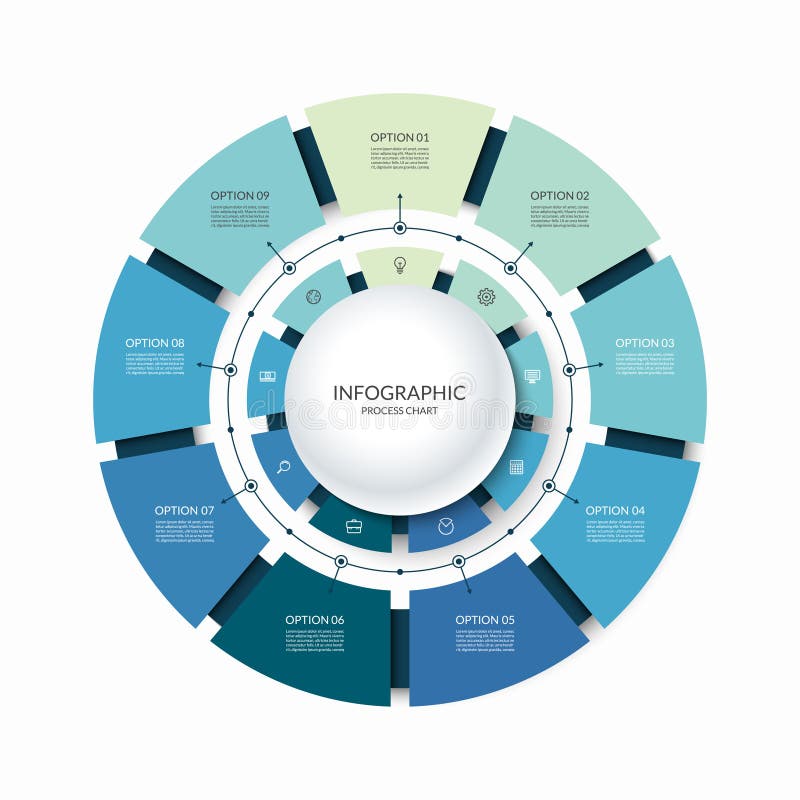
Free with trial Infographic circular chart divided into 9 parts. Step-by step cycle diagram with nine options designed for report, presentation, data visualization. Analysis circular vectors Infographic circular chart divided into 9 parts. Step-by step cycle diagram with nine options. Infographic circular chart divided into 9 parts. Step-by step. Infographic circular chart divided into 9 parts. Step-by step cycle diagram with nine options designed for report, presentation, data visualization.
Free with trial Circular economy and life cycle assessment with recycling outline diagram. Material resources reusage as continuous manufacturing without pollution vector illustration. Sustainable garbage management. Analysis circular vectors Circular economy and life cycle assessment with recycling outline diagram. Material resources reusage as continuous manufacturing without pollution vector
Free with trial SWOT Analysis. Infographic with four steps. Vector. Illustration. Analysis circular vectors SWOT Analysis. Infographic with four steps. Vector. Illustration
Free with trial Four colorful elements with text inside placed around circle. Concept of SWOT-analysis template or strategic planning technique. Infographic design template. Vector illustration. Analysis circular illustrations Four colorful elements with text inside placed around circle. Concept of SWOT-analysis template or strategic planning technique. Infographic design template
Free with trial Circular flexible abstract colorful logo. High tech nano molecular sparkling circles sign. Unusual wave vector icon. Round fireworks logotype. Analysis circular vectors Circular flexible abstract colorful logo. High tech nano molecular sparkling circles sign. Unusual wave vector icon. Round fireworks logotype
Free with trial Analytics colorful round illustration - vector analysis or statistics circular sign on dark background. Analysis circular vectors Analytics colorful round illustration. Vector analysis or statistics circular sign on dark background
Free with trial Human microbiota circular vector red outline illustration. Human microbiota circular vector red illustration in outline style on white background. Analysis circular vectors Human microbiota circular vector red outline illustration. Human microbiota circular vector red illustration in outline style on white background
Free with trial Vector 3d echo audio circular wavefrom spectrum. Abstract music waves oscillation graph. Futuristic sound wave visualization. Colorful glowing impulse pattern. Synthetic music technology sample. Analysis circular vectors Vector 3d echo audio circular wavefrom spectrum. Abstract music waves oscillation graph. Futuristic sound wave. Visualization. Colorful glowing impulse pattern. Vector 3d echo audio circular wavefrom spectrum. Abstract music waves oscillation graph. Futuristic sound wave visualization. Colorful glowing impulse pattern. Synthetic music technology sample
Free with trial Vector 3d echo audio circular wavefrom spectrum. Abstract music waves oscillation graph. Futuristic sound wave visualization. Glowing impulse pattern. Synthetic music technology sample. Analysis circular vectors Vector 3d echo audio circular wavefrom spectrum. Abstract music waves oscillation graph. Futuristic sound wave. Visualization. Glowing impulse pattern. Vector 3d echo audio circular wavefrom spectrum. Abstract music waves oscillation graph. Futuristic sound wave visualization. Glowing impulse pattern. Synthetic music technology sample
Free with trial Circular chart. 3d rendered pie chart on white background. Analysis circular illustrations Circular chart. 3d rendered pie chart on white background
Free with trial Circular rack of test tubes. Circular rack of empty test tubes. Analysis circular illustrations Circular rack of test tubes. Circular rack of empty test tubes
 Sign in