Free with trial A close-up view of a hand holding a magnifying glass over a business graph, emphasizing the analysis of data trends and performance insights. Analysis decrease illustrations Analysis of Data Trends with Magnifying Glass on Business Graph for Detailed Observation. A close-up view of a hand holding a magnifying glass over a business graph, emphasizing the analysis of data trends and performance insights
Free with trial Descending Graph Depicts a Clear Downward Trend in Business Financial Analysis and Loss Indicating Recession. Analysis decrease vectors Descending Graph Depicts a Clear Downward Trend in Business Financial Analysis and Loss Indicating Recession
Free with trial Crisis concept. Bankruptcy with falling down profit graph and money decrease. flat vector modern illustration. Analysis decrease vectors Crisis concept. Bankruptcy with falling down profit graph and money decrease.
Free with trial Vibrant Digital Financial Analysis With Colorful Graphs And Data Visualization On Screen. Generative AI. Analysis decrease illustrations Vibrant Digital Financial Analysis With Colorful Graphs And Data Visualization On Screen
Free with trial A visual representation of declining data points connected by a red line. This graphic effectively illustrates a negative trend or decrease over time, suitable for financial or performance reports. Analysis decrease illustrations Data trend analysis showing downward trajectory with red dots and connecting line vector. A visual representation of declining data points connected by a red line. This graphic effectively illustrates a negative trend or decrease over time, suitable for financial or performance reports
Free with trial A collection of icons Decrease, Intersection graph, decrease, Intersect graph, Connection network, Hierarchy structure, icon. Analysis decrease vectors Decrease, Intersection graph, decrease, Intersect graph, Connection network, Hierarchy structure, icon
Free with trial Creative collage illustration picture standing young woman arrow upwards arrow downwards symbol progress decrease achieve template. Analysis decrease illustrations Creative collage illustration picture standing young woman arrow upwards arrow downwards symbol progress decrease
Free with trial Financial chart displaying a series of candlestick patterns on a digital screen, used for stock data analysis. The chart features vertical bars in orange against a blue background with grid lines. Each candlestick represents price movements within a specific time frame, showcasing market trends. The background includes a blurred assortment of lights and other graphical elements, indicating a financial data interface, likely used for investment portfolio analysis and trading activities. Analysis decrease illustrations Financial Chart And Stock Data Analysis For Investment Portfolio. Candle Stick Graph For Trade. Financial chart displaying a series of candlestick patterns on a digital screen, used for stock data analysis. The chart features vertical bars in orange against a blue background with grid lines. Each candlestick represents price movements within a specific time frame, showcasing market trends. The background includes a blurred assortment of lights and other graphical elements, indicating a financial data interface, likely used for investment portfolio analysis and trading activities.
Free with trial A 3D rendered graphic depicts a bar chart with three vertical bars of varying heights: two blue bars flanking a taller yellow bar. At the top of the yellow bar, a central yellow sphere is connected by white rods to two smaller blue spheres, resembling a molecular structure or a network. The entire graphic is isolated on a white background, suggesting concepts of data analysis, growth, and. Analysis decrease illustrations 3D Rendered Bar Chart with Connecting Spheres Representing Data Analysis graph statistics. A 3D rendered graphic depicts a bar chart with three vertical bars of varying heights: two blue bars flanking a taller yellow bar. At the top of the yellow bar, a central yellow sphere is connected by white rods to two smaller blue spheres, resembling a molecular structure or a network. The entire graphic is isolated on a white background, suggesting concepts of data analysis, growth, and
Free with trial A financial chart displaying market analysis and business growth with increasing and decreasing trends. Analysis decrease illustrations Financial chart showing growth and market analysis data isolated on transparent background. A financial chart displaying market analysis and business growth with increasing and decreasing trends.
Free with trial 3D Colorful Charts Magnifier Analysis, Data Visualization, Market Research ,chart,magnifying glass , This photo was created using generative AI. Analysis decrease illustrations 3D Colorful Charts Magnifier Analysis, Data Visualization, Market Research ,chart,magnifying glass
Free with trial Illuminated red financial chart depicting vibrant stock market trends, showcasing upward and downward movements. ideal for financial reports, analysis, and investment presentations in the stock market domain. Generative AI. Analysis decrease illustrations Dynamic Red Financial Data Chart with Glowing Lights for Stock Market Analysis Generative AI. Illuminated red financial chart depicting vibrant stock market trends, showcasing upward and downward movements. ideal for financial reports, analysis, and investment presentations in the stock market domain. Generative AI
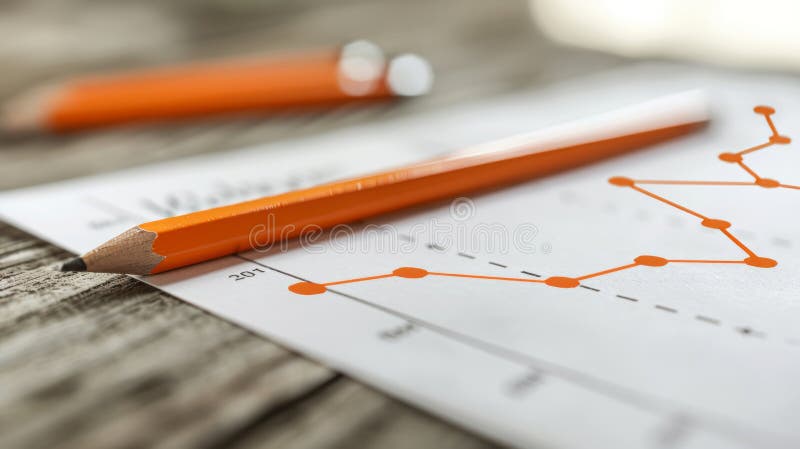
Free with trial Orange Pencil on Paper with Fluctuating Line Graph Representing Business Trends and Analysis, Generated by AI. Analysis decrease illustrations Orange Pencil on Paper with Fluctuating Line Graph Representing Business Trends and Analysis
Free with trial Business chart icon set with graph, statistic, line and bar diagram for finance or analysis. Pie graphics with horizontal and donut layout for data growth. Vector report for trend or economy by pictogram scheme. Analysis decrease vectors Business chart icon set with graph, statistic, line and bar diagram for finance or analysis. Pie graphics with
Free with trial Downward arrows set. Financial decline percent. Economic crisis concept. Vector business analysis. EPS 10. Analysis decrease vectors Downward arrows set. Financial decline percent. Economic crisis concept. Vector business analysis.
Free with trial 3d bar chart illustrating growth, analysis, and business progress with colorful visual representation of data ,Generative ai. Analysis decrease illustrations 3d bar chart, visualizing growth, data analysis, and business progress for effective communication. 3d bar chart illustrating growth, analysis, and business progress with colorful visual representation of data ,Generative ai
Free with trial A character is grasping a big red arrow that points downward, symbolizing decline or decrease against a plain white backdrop. Analysis decrease illustrations Character Holding a Large Red Downward Arrow on a White Background Indicating Decline or Decrease. A character is grasping a big red arrow that points downward, symbolizing decline or decrease against a plain white backdrop
Free with trial The energy and down arrow. Decrease in energy, tension. Vector linear icon isolated on white background. Analysis decrease illustrations Energy and down arrow. Decrease in energy, tension. Vector linear icon isolated on white background
Free with trial Blue folder with chart, business organization, data analysis, and report presentation concept. streamline your workflow ,Generative ai. Analysis decrease illustrations Blue folder with chart, streamlining business data analysis and report presentation for enhanced workflow. Blue folder with chart, business organization, data analysis, and report presentation concept. streamline your workflow ,Generative ai
Free with trial Decrease in investment concept. Coin stack grows smaller and hand drawing white arrow pointing down, symbol of loss. Bearish stock and cryptocurrency trading on red grid background. Analysis decrease illustrations Decrease in investment concept. Coin stack grows smaller and hand drawing white arrow pointing down, symbol of loss
Free with trial A laptop computer showing various graphs and charts representing trend analysis for website traffic, Incorporate trend analysis for website traffic fluctuations. Analysis decrease illustrations A laptop computer showing various graphs and charts representing trend analysis for website traffic, Incorporate trend analysis
Free with trial A detailed financial chart showing business data analysis and market trend with upward arrow sign. Analysis decrease illustrations Financial chart business data analysis and market trend view isolated on transparent background. a detailed financial chart showing business data analysis and market trend with upward arrow sign
Free with trial This image shows a falling graph behind a diamond, representing the decrease in the value of precious stones. It's suitable for illustrating financial losses. Analysis decrease vectors Illustration of a falling graph behind a diamond, symbolizing a decrease in the value of precious stones. This image shows a falling graph behind a diamond, representing the decrease in the value of precious stones. It's suitable for illustrating financial losses
Free with trial Next economic recession forecast or prediction, stock market decline or revenue decrease, low performance or GDP falling down concept, businessman investor look through telescope to see despair graph. Analysis decrease vectors Next economic recession forecast or prediction, stock market decline or revenue decrease, low performance or GDP falling down
Free with trial Next economic recession forecast or prediction, stock market decline or revenue decrease, low performance or GDP falling down concept, businesswoman investor look through telescope to see despair graph. Analysis decrease vectors Next economic recession forecast or prediction, stock market decline or revenue decrease, low performance or GDP falling down
Free with trial Stock market trading technical analysis bar chart fall. Business candlestick graph exchange down trend. Crisis economy and investment loss graph. Trader financial index crash concept. Eps banner. Analysis decrease vectors Stock market trading technical analysis bar chart fall. Business candlestick graph exchange down trend. Crisis economy
Free with trial Stock market trading technical analysis bar chart fall. Business candlestick graph exchange down trend. Crisis economy and investment loss graph. Trader financial index crash concept. Money losing eps. Analysis decrease vectors Stock market trading technical analysis bar chart fall. Business candlestick graph exchange down trend. Crisis economy
Free with trial Tariffs word with downward arrows showing falling trade taxes decrease. Tariffs background. Analysis decrease vectors Tariffs word with downward arrows showing falling trade taxes decrease. Green background. Tariffs word with downward arrows showing falling trade taxes decrease. Tariffs word with downward arrows showing falling trade taxes decrease. Tariffs background. Tariffs word with downward arrows showing falling trade taxes decrease. Tariffs background
Free with trial A set of black and white icons representing stock market data analysis and financial growth. 94. Analysis decrease vectors Stock market data analysis charts and graphs business finance and investment vector icon set design 100. a set of black and white icons representing stock market data analysis and financial growth. 94
Free with trial Set Financial growth, decrease, Binary code, Cloud download and upload, Folder lock, Server and icon. Vector. Analysis decrease illustrations Set Financial growth, decrease, Binary code, Cloud download and upload, Folder lock, Server and icon. Vector
Free with trial Stock market chart analysis displayed on computer screen showing growth and performance ,Generative ai. Analysis decrease illustrations Stock market analysis chart displayed on computer screen showing growth and investment performance. Stock market chart analysis displayed on computer screen showing growth and performance ,Generative ai
Free with trial Magnifying glass over bar graph, symbolizes research, analysis, insights, growth, and strategy. Can be used for display or montage your products. Empty Space for display your products, copy space ,banner, advertising. Generative AI. Analysis decrease illustrations Data Analysis and Market Research Magnifying glass over bar graph symbolizes research analysis insights growth and strategy. Magnifying glass over bar graph, symbolizes research, analysis, insights, growth, and strategy. Can be used for display or montage your products. Empty Space for display your products, copy space ,banner, advertising. Generative AI
Free with trial Chart icons for data analysis vector art design, Minimalist business charts icons bar graphs, line graphs, and pie charts vector illustration on white background the image is generated using AI. Analysis decrease vectors Chart icons for data analysis vector art design, Minimalist business charts icons bar graphs, line graphs, and pie charts vector
Free with trial Business Analytics And Data Visualization Line Icon Set. Financial Growth, Market Trends, And Performance Analysis Outline Symbol Collection. Editable Stroke. Isolated Vector Illustration. Analysis decrease vectors Business Analytics And Data Visualization Line Icon Set. Financial Growth, Market Trends, And Performance Analysis
Free with trial Stock market chart displaying a transition from a downturn to a bullish trend. Red candlesticks indicate a declining phase, followed by green candlesticks showing upward movement. The grid and digital interface feature blue and orange function buttons surrounding the chart. The setup appears designed for financial analysis, illustrating market behavior for reports or presentations. Analysis decrease illustrations Dynamic stock market chart showing bullish trend after downturn for financial analysis reports and presentations. Stock market chart displaying a transition from a downturn to a bullish trend. Red candlesticks indicate a declining phase, followed by green candlesticks showing upward movement. The grid and digital interface feature blue and orange function buttons surrounding the chart. The setup appears designed for financial analysis, illustrating market behavior for reports or presentations.
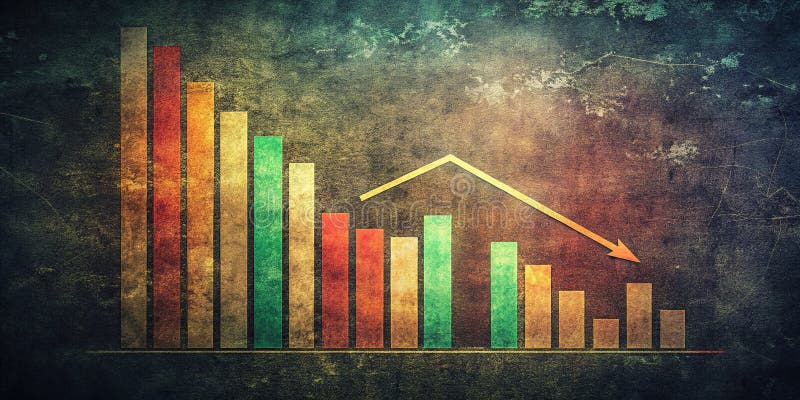
Free with trial This striking vintage-style bar graph, set against a dramatic dark background, visually represents a consistent downward trend in financial data. The muted colors and grainy texture add an authentic, analog feel to the digital visualization, emphasizing the impactful nature of the decline. Ideal for business presentations, financial reports, or investment analysis, this image powerfully. Analysis decrease illustrations Vintage Bar Graph Depicts Consistent Market Decline A Financial Data Visualization for Trend Analysis. This striking vintage-style bar graph, set against a dramatic dark background, visually represents a consistent downward trend in financial data. The muted colors and grainy texture add an authentic, analog feel to the digital visualization, emphasizing the impactful nature of the decline. Ideal for business presentations, financial reports, or investment analysis, this image powerfully
Free with trial Set line Financial growth decrease, Binary code and icon. Vector. Analysis decrease illustrations Set line Financial growth decrease, Binary code and icon. Vector
Free with trial Illustration of a graph showing the growth of the indian rupee in the stock market. the image represents investment, financial analysis and currency exchange rates in the indian economy. the graph shows an upward trend. Analysis decrease illustrations Indian rupee stock market investment graph chart financial growth and currency exchange rate analysis. illustration of a graph showing the growth of the indian rupee in the stock market. the image represents investment, financial analysis and currency exchange rates in the indian economy. the graph shows an upward trend.
Free with trial A digital representation of quality and cost metrics in the business world, emphasizing strategy and analysis through upward and downward arrows in a modern setting. Qubit. Analysis decrease illustrations Digital hand showcasing quality and cost metrics with upward and downward arrows, representing analysis, strategy, and. A digital representation of quality and cost metrics in the business world, emphasizing strategy and analysis through upward and downward arrows in a modern setting. Qubit
Free with trial A red stock market crash chart showing a significant financial downturn. This image represents a recession, bear market, and investment losses, highlighting a negative trend analysis. Analysis decrease illustrations Stock market crash chart red background financial crisis recession bear market investment loss trend analysis. A red stock market crash chart showing a significant financial downturn. This image represents a recession, bear market, and investment losses, highlighting a negative trend analysis.
Free with trial Set line Graph chart infographic Server Data Browser window Financial growth decrease Laptop with browser Cloud technology data transfer and Secure your site HTTPS SSL icon. Vector. Analysis decrease illustrations Set line Graph chart infographic, Server, Data, Browser window, Financial growth decrease, Laptop with browser, Cloud. Set line Graph chart infographic Server Data Browser window Financial growth decrease Laptop with browser Cloud technology data transfer and Secure your site HTTPS SSL icon. Vector.
Free with trial Colorful Bar Graph Showing Decrease with a Yellow Arrow Signifying a Downward Trend in Financial Performance. Analysis decrease vectors Colorful Bar Graph Showing Decrease with a Yellow Arrow Signifying a Downward Trend in Financial Performance
Free with trial Bar Chart Growth And Decline Line And Solid Icon Set. Financial Performance, Economic Trends, Business Analysis Symbol Collection. Data Visualization And Market Trends. Isolated Vector Illustration. Analysis decrease vectors Bar Chart Growth And Decline Line And Solid Icon Set. Financial Performance, Economic Trends, Business Analysis Symbol
Free with trial Minimalist graph icon showing growth and fluctuation. Perfect for finance, business reports, market analysis, and data presentation projects. Analysis decrease vectors Minimalist graph icon showing growth and fluctuation. Perfect for finance, business reports, market analysis, and data
Free with trial Market crash analysis, businessman analyst using magnifying glass to look at red arrow on crash chart. Analysis decrease vectors Market crash analysis, businessman analyst using magnifying glass to look at red arrow on crash chart
Free with trial Line Graph Chart Solid Icon. Data Analysis, Trend Visualization, And Statistical Representation Silhouette Symbol. Business And Financial Insights. Isolated Vector Illustration. Analysis decrease vectors Line Graph Chart Solid Icon. Data Analysis, Trend Visualization, And Statistical Representation Silhouette Symbol
Free with trial Bar Chart With Downward Trend Line Icon. Financial Decline, Economic Recession, And Market Analysis Outline Symbol. Business Performance Tracking. Editable Stroke. Isolated Vector Illustration. Analysis decrease vectors Bar Chart With Downward Trend Line Icon. Financial Decline, Economic Recession, And Market Analysis Outline Symbol
Free with trial Crisis chart and graph. Economic downturn with Increase and decrease arrow on the top of wooden blocks steps on desk, eco style. The business volatility trend process, finance, and economic concept , Generative Ai. Analysis decrease illustrations Crisis chart and graph. Economic downturn with Increase and decrease arrow on the top of wooden blocks steps on desk, eco style.
Free with trial Crisis chart and graph. Economic downturn with Increase and decrease arrow on the top of wooden blocks steps on desk, eco style. The business volatility trend process, finance, and economic concept , Generative Ai. Analysis decrease illustrations Crisis chart and graph. Economic downturn with Increase and decrease arrow on the top of wooden blocks steps on desk, eco style.
Free with trial Set Pie chart infographic, Financial growth decrease, and icon. Vector. Analysis decrease illustrations Set Pie chart infographic, Financial growth decrease, and icon. Vector
Free with trial Bar Chart With Arrows Line And Solid Icon Set. Data Analysis, Trend Indication, Business Performance Tracking Symbols. Visual Representation Of Growth And Decline. Isolated Vector Illustration. Analysis decrease vectors Bar Chart With Arrows Line And Solid Icon Set. Data Analysis, Trend Indication, Business Performance Tracking Symbols
Free with trial Bar Chart With Downward Trend Line Solid Icon. Financial Decline, Economic Downturn, And Market Analysis Silhouette Symbol. Business Performance Tracking. Isolated Vector Illustration. Analysis decrease vectors Bar Chart With Downward Trend Line Solid Icon. Financial Decline, Economic Downturn, And Market Analysis Silhouette
Free with trial This vibrant illustration depicts a coin with a dollar sign and a downward arrow, symbolizing a decrease in value. It is perfect for financial or economic themes. Analysis decrease vectors Illustration of a coin with a dollar sign and a downward arrow, , symbolizing a decrease in value or a price reduction. This vibrant illustration depicts a coin with a dollar sign and a downward arrow, symbolizing a decrease in value. It is perfect for financial or economic themes
Free with trial An upward trending stock market graph shows business finance investment growth and success. The red arrow indicates positive data analysis and economic trending up. A strong future ahead!. Analysis decrease illustrations Stock market growth chart business finance investment graph arrow up trending data analysis success economy. An upward trending stock market graph shows business finance investment growth and success. The red arrow indicates positive data analysis and economic trending up. A strong future ahead!
Free with trial A futuristic robotic hand reaches towards interactive financial charts, showcasing cutting-edge technology in data analysis and stock market trends with vivid color accents. Scalp. Analysis decrease illustrations Advanced robotic hand interacting with dynamic financial charts and graphs, artificial intelligence analysis, stock. A futuristic robotic hand reaches towards interactive financial charts, showcasing cutting-edge technology in data analysis and stock market trends with vivid color accents. Scalp
Free with trial 3D render of red and white candlestick chart with percentage symbols, symbolizing financial market analysis, stock trading, cryptocurrency, and investment trends in a modern style. Analysis decrease illustrations 3D render of red and white candlestick chart with percentage symbols, symbolizing financial market analysis, stock trading
Free with trial Set Financial growth decrease and Sales funnel with chart icon. Vector. Analysis decrease illustrations Set Financial growth, decrease and Sales funnel with chart icon. Vector
Free with trial Market trend icon in comic style. Decline arrow with magnifier cartoon vector illustration on isolated background. Decrease splash effect business concept. Analysis decrease vectors Market trend icon in comic style. Decline arrow with magnifier cartoon vector illustration on isolated background. Decrease splash
Free with trial Crisis concept. Bankruptcy with falling down profit graph and money decrease. flat vector modern illustration. Analysis decrease vectors Crisis concept. Bankruptcy with falling down profit graph and money decrease.
Free with trial Decreasing bar graph illustration simple hand drawn financial decline, negative trend analysis chart with arrow axes, AI. Analysis decrease vectors Decreasing bar graph illustration simple hand drawn financial decline, negative trend analysis chart with arrow axes, AI
Free with trial Hand interacting with a declining chart, symbolizing market trends and financial analysis ,Generative ai. Analysis decrease illustrations Declining chart and hand interaction, visualizing market trends financial analysis for strategic decisionmaking. Hand interacting with a declining chart, symbolizing market trends and financial analysis ,Generative ai
Free with trial This vector illustration depicts a descending bar graph, representing decline and negative trends. It is suitable for financial reports, business analysis, and presentations. Analysis decrease vectors Illustration of a descending bar graph, , representing decline, decrease, and negative trends in business or finance. This vector illustration depicts a descending bar graph, representing decline and negative trends. It is suitable for financial reports, business analysis, and presentations
Free with trial Set line Browser window, Online shopping on screen, Financial growth decrease, with shield, setting and icon. Vector. Analysis decrease vectors Set line Browser window, Online shopping on screen, Financial growth decrease, with shield, setting and icon. Vector
Free with trial A captivating stock market analysis chart that visualizes financial data and business growth. The blue background enhances the modern design, perfect for illustrating investment trends and economic reports. Analysis decrease illustrations Stock market analysis chart financial data graph business investment growth blue background vector illustration. a captivating stock market analysis chart that visualizes financial data and business growth. The blue background enhances the modern design, perfect for illustrating investment trends and economic reports.
Free with trial Real estate market analysis. Graphical representation of property value trends, growth patterns. Small house model with increasing bar chart in front of financial data diagram. Analysis decrease illustrations Real estate market analysis. Graphical representation of property value trends, growth patterns. Small house model with
Free with trial A dynamic image showcasing digital financial data and fluctuating stock market graphs. the red lines suggest market volatility, providing a powerful visual for economic analysis, investment strategies, or financial presentations. Generative AI. Analysis decrease illustrations Stock Market Volatility Concept with Digital Financial Data and Graph Displays for Economic Analysis Generative AI. A dynamic image showcasing digital financial data and fluctuating stock market graphs. the red lines suggest market volatility, providing a powerful visual for economic analysis, investment strategies, or financial presentations. Generative AI
Free with trial BSC Balanced Scorecard infographic template with round vertical box container gradually decrease on right column dark background style with 4 point for slide presentation vector. Analysis decrease illustrations BSC Balanced Scorecard infographic template with round vertical box container gradually decrease on right column dark background
Free with trial A set of hand-drawn financial graph and chart icons. These icons are suitable for business analysis, investment strategies, and economic growth presentations. Analysis decrease vectors Vector art of hand drawn financial graph and chart icons for business analysis, investment, and economic growth in vector format. A set of hand-drawn financial graph and chart icons. These icons are suitable for business analysis, investment strategies, and economic growth presentations
Free with trial Set Financial growth decrease Magnifying glass with check mark Graph chart infographic Search engine Website stocks market Browser shield window and Mobile phone icon. Vector. Analysis decrease illustrations Set Financial growth decrease, Magnifying glass with check mark, Graph chart infographic, Search engine, Website stocks. Set Financial growth decrease Magnifying glass with check mark Graph chart infographic Search engine Website stocks market Browser shield window and Mobile phone icon. Vector.
Free with trial A financial report with bar graph and line chart is a visual tool for business data analysis, offering insights for presentation, review, and strategic decision-making. Analysis decrease vectors Vector art of financial report with bar graph and line chart, showing business data and analysis for presentation and review. A financial report with bar graph and line chart is a visual tool for business data analysis, offering insights for presentation, review, and strategic decision-making
Free with trial A set of line art icons illustrating financial growth, investment strategies, and market analysis, perfect for business presentations and reports with clean design. Analysis decrease vectors Vector art of line art icons depicting financial growth, investment strategies, and market analysis, ideal for illustrating. A set of line art icons illustrating financial growth, investment strategies, and market analysis, perfect for business presentations and reports with clean design
Free with trial Set line Financial growth decrease Cloud computing lock and Pie chart infographic with long shadow. Red square button. Vector. Analysis decrease vectors Set line Financial growth, decrease, Cloud computing lock and Pie chart infographic with long shadow. Red square button
Free with trial Line Graph Chart Icon. Data Analysis, Business Growth, And Statistical Trends Outline Symbol. Financial Performance Tracking. Editable Stroke. Isolated Vector Illustration. Analysis decrease vectors Line Graph Chart Icon. Data Analysis, Business Growth, And Statistical Trends Outline Symbol. Financial Performance
Free with trial Digital tablet displaying real-time gold price chart with line graphs, market indicators. Investment analysis, financial market data, trading concept. Tablet is on gold bars financial. Analysis decrease illustrations Digital tablet displaying real-time gold price chart with line graphs, market indicators. Investment analysis, financial market
Free with trial 3D Illustration Business Graph Chart Growth Success Analysis Finance Investment Strategy Data Market Stock Economy Trading Financial Progress Report. Analysis decrease illustrations 3D Illustration Business Graph Chart Growth Success Analysis Finance Investment Strategy Data Market Stock Economy Trading
Free with trial Red bear market illustration financial downturn. Bear character sitting near chart, graph, showing decrease. Concept of economic crisis, stock market crash, financial losses trading. Analysis decrease illustrations Red bear market illustration financial downturn. Bear character sitting near chart, graph, showing decrease. Concept of economic
Free with trial Watercolor illustration of business growth. Orange bar, pie charts on aged paper show data analysis, market trends, financial progress. Visuals represent success, planning strategic. Analysis decrease illustrations Watercolor illustration of business growth. Orange bar, pie charts on aged paper show data analysis, market trends, financial
Free with trial Closeup view of a pen resting on graph, suggesting data analysis or business planning ,Generative AI. Analysis decrease illustrations Detailed view of a pen placed on graph, depicting financial analysis, business planning, and data interpretation for strategic. Closeup view of a pen resting on graph, suggesting data analysis or business planning ,Generative AI
Free with trial A business professional is seen working with a laptop and analyzing data charts to optimize performance The image showcases the concepts of quality improvement cost reduction strategic planning and target achievement highlighting the importance of data analysis and technology in modern business. Analysis decrease illustrations Business professional optimizes performance with technology achieving quality improvement and cost reduction with data analysis. A business professional is seen working with a laptop and analyzing data charts to optimize performance The image showcases the concepts of quality improvement cost reduction strategic planning and target achievement highlighting the importance of data analysis and technology in modern business
Free with trial Set Isometric Server security with padlock, Financial growth decrease, and icon. Vector. Analysis decrease illustrations Set Isometric Server security with padlock, Financial growth decrease, and icon. Vector