Free with trial Trend chart icons. Rising and falling bars. Arrow and bar graph. Economic data symbols. EPS 10. Analysis financial growth decrease vectors Trend chart icons. Rising and falling bars. Arrow and bar graph. Economic data symbols. EPS 10
Free with trial Analyzing Dynamic Stock Market Trends with Red Graph Lines on Black Background. Generative AI. Analysis financial growth decrease illustrations Analyzing Dynamic Stock Market Trends with Red Graph Lines on Black Background. Generative AI
Free with trial Percentage symbol icon in circle shape abstract concept for discount or finance. AI generated. Analysis financial growth decrease vectors Percentage symbol icon in circle shape abstract concept for discount or finance. AI generated
Free with trial Graph going Up and Down with red arrows vector. Blue chart bar vector illustration concept of sales bar chart symbol icon with arrow moving down and sales bar chart with arrow moving up. Analysis financial growth decrease vectors Graph going Up and Down with red arrows vector. Blue chart bar vector illustration concept of sales bar chart symbol icon. Graph going Up and Down with red. Graph going Up and Down with red arrows vector. Blue chart bar vector illustration concept of sales bar chart symbol icon with arrow moving down and sales bar chart with arrow moving up.
Free with trial A collection of hand-drawn style charts and diagrams that can be used to display data and analyze progress, ideal for business presentations, reports, or data visualizations. Analysis financial growth decrease illustrations Hand-Drawn Collection of Statistical Charts and Diagrams for Business Analytics. A collection of hand-drawn style charts and diagrams that can be used to display. A collection of hand-drawn style charts and diagrams that can be used to display data and analyze progress, ideal for business presentations, reports, or data visualizations
Free with trial Digital globe with rising and falling stock market trends, represented by red and blue lines, symbolizing global financial fluctuations and economic uncertainty in a high-tech, futuristic style. Analysis financial growth decrease illustrations Global Market Fluctuations: A Digital Earth with Rising and Falling Stock Trends. Digital globe with rising and falling stock market trends, represented by red. Digital globe with rising and falling stock market trends, represented by red and blue lines, symbolizing global financial fluctuations and economic uncertainty in a high-tech, futuristic style
Free with trial Red market decline graph on desk, glasses, tablet showing losses, office background, detailed background Generative AI. Analysis financial growth decrease illustrations Red market decline graph on desk, glasses, tablet showing losses, office background. Detailed background Generative AI
Free with trial View Two golden bull figurines face each other, placed on a wooden surface in a trading workspace A stock market chart with green and red lines indicates market fluctuations Vertical Mobile Wallpaper. Analysis financial growth decrease illustrations Two golden bull figurines face each other on wood, symbolizing market fluctuations. View Two golden bull figurines face each other, placed on a wooden surface in. view Two golden bull figurines face each other, placed on a wooden surface in a trading workspace A stock market chart with green and red lines indicates market fluctuations Vertical Mobile Wallpaper
Free with trial Line graph up and down icon vector. Outline bar chart with arrow symbol. Analytics concept. Analysis financial growth decrease vectors Line graph up and down icon. Outline bar chart with arrow symbol. Analytics concept. Line graph up and down icon vector. Outline bar chart with arrow symbol. Line graph up and down icon vector. Outline bar chart with arrow symbol. Analytics concept
Free with trial Stock market bear market. Downward tread chart on the investment. Bear trader wearing eyeglasses sitting at office monitoring stock market. Generative Ai. Analysis financial growth decrease illustrations Bull trader wearing eyeglasses sitting at office monitoring stock market. Generative Ai. Stock market bear market. Downward tread chart on the investment. Bear. Stock market bear market. Downward tread chart on the investment. Bear trader wearing eyeglasses sitting at office monitoring stock market. Generative Ai
Free with trial 3D infographics analyze trade deficits? impact on imports, exports, and economy. Analysis financial growth decrease illustrations Analyzing economic effects of trade deficits with 3D infographics on imports and exports. 3D infographics analyze trade deficits? impact on imports, exports, and. 3D infographics analyze trade deficits? impact on imports, exports, and economy
Free with trial Rise vs Risk symbol. Turned wooden cubes with words Risk vs Rise. Businessman hand. Business and Rise vs Risk concept. Copy space. 3D rendering on blue background. Analysis financial growth decrease illustrations Rise vs Risk symbol. Turned wooden cubes with words Risk vs Rise. Businessman hand. Business and Rise vs Risk concept. Copy space.3D rendering on blue
Free with trial Red graph shows plummeting house prices scattered coins coin scatter investment strategy Vector illustration. Analysis financial growth decrease illustrations Red graph shows plummeting house prices; scattered coins , coin scatter, investment strategy. Red graph shows plummeting house prices scattered coins coin. Red graph shows plummeting house prices scattered coins coin scatter investment strategy Vector illustration.
Free with trial Outline bar chart icon vector with upward and downward trend arrow. Uptrend and downtrend business graph symbol in black circle. Analysis financial growth decrease vectors Outline bar chart icon with upward and downward trend arrow. Uptrend and downtrend business graph symbol in black circle. Outline bar chart icon vector with. Outline bar chart icon vector with upward and downward trend arrow. Uptrend and downtrend business graph symbol in black circle
Free with trial Cost reduction concept on wooden cube, Expenses and saving money, Business strategy and project management, cost reduction, efficient business and budget cutting. Analysis financial growth decrease illustrations Cost reduction concept on wooden cube, Expenses and saving money, Business strategy and project management, cost reduction,. Efficient business and budget
Free with trial A modern smartphone displays a stock market candlestick chart with a downward-trending red arrow indicating a significant loss. Several gold coins with dollar signs are scattered around the phone, and a red bell icon with an exclamation mark hovers above, suggesting an alert or warning. A label on the arrow reads "LOSS. Analysis financial growth decrease illustrations Smartphone Displaying Stock Market Chart with Falling Red Arrow and Gold Coins mobile trading. A modern smartphone displays a stock market candlestick chart with. A modern smartphone displays a stock market candlestick chart with a downward-trending red arrow indicating a significant loss. Several gold coins with dollar signs are scattered around the phone, and a red bell icon with an exclamation mark hovers above, suggesting an alert or warning. A label on the arrow reads "LOSS
Free with trial Colorful bar graph showing data and trends, perfect for business, finance, or analytics presentations. EPS 10. Analysis financial growth decrease vectors Colorful bar graph showing data and trends, perfect for business, finance, or analytics presentations. EPS 10
Free with trial The Red Bear on Mother Board for Business concept 3d Rendering. Analysis financial growth decrease illustrations The Red Bear on Mother Board for Business concept 3d Rendering. Red Bear on Mother Board for Business concept 3d Rendering
Free with trial The Cost reduction and coins for Business concept 3d rendering. Analysis financial growth decrease illustrations The Cost reduction and coins for Business concept 3d rendering. Cost reduction and coins for Business concept 3d rendering
Free with trial The Cost reduction and coins for Business concept 3d rendering. Analysis financial growth decrease illustrations The Cost reduction and coins for Business concept 3d rendering. Cost reduction and coins for Business concept 3d rendering
Free with trial The Cost reduction and coins for Business concept 3d rendering. Analysis financial growth decrease illustrations The Cost reduction and coins for Business concept 3d rendering. Cost reduction and coins for Business concept 3d rendering
Free with trial The Cost reduction and coins for Business concept 3d rendering. Analysis financial growth decrease illustrations The Cost reduction and coins for Business concept 3d rendering. Cost reduction and coins for Business concept 3d rendering
Free with trial The Red Bear on Mother Board for Business concept 3d Rendering. Analysis financial growth decrease illustrations The Red Bear on Mother Board for Business concept 3d Rendering. Red Bear on Mother Board for Business concept 3d Rendering
Free with trial The Red Bear on Mother Board for Business concept 3d Rendering. Analysis financial growth decrease illustrations The Red Bear on Mother Board for Business concept 3d Rendering. Red Bear on Mother Board for Business concept 3d Rendering
Free with trial Interest rate concept percent sign with coins and graph arrow. Generative AI. Analysis financial growth decrease illustrations Interest rate concept percent sign with coins and graph arrow. Generative AI
Free with trial Interest rate concept percent sign with coins and graph arrow. Generative AI. Analysis financial growth decrease illustrations Interest rate concept percent sign with coins and graph arrow. Generative AI
Free with trial Interest rate concept percent sign with coins and graph arrow. Generative AI. Analysis financial growth decrease illustrations Interest rate concept percent sign with coins and graph arrow. Generative AI
Free with trial Eight circular icons with black backgrounds each feature a different chart or graph symbol. The frames are bordered by a sequence of colorful lines: red, green, blue, and yellow. The icons include bar graphs, line graphs, a pie chart, and scatter plots, all depicted in white. Each symbol includes axes and grid patterns, indicating statistical or financial data representation. The arrangement is in two rows of four, emphasizing symmetry and variety in chart types. A i Generated. Analysis financial growth decrease vectors Collection of eight different chart and graph icons displayed in circular black frames with colorful borders. Eight circular icons with black backgrounds each. Eight circular icons with black backgrounds each feature a different chart or graph symbol. The frames are bordered by a sequence of colorful lines: red, green, blue, and yellow. The icons include bar graphs, line graphs, a pie chart, and scatter plots, all depicted in white. Each symbol includes axes and grid patterns, indicating statistical or financial data representation. The arrangement is in two rows of four, emphasizing symmetry and variety in chart types. A i Generated
Free with trial A bar chart with a downward-pointing red arrow and decreasing black bars symbolizing loss and failure. Finance, business, and economics concept. Analysis financial growth decrease illustrations A bar chart with a downward-pointing red arrow and decreasing black bars symbolizing loss and failure. Finance, business, and. Economics concept
Free with trial Row of gray houses with garages. Real estate market with moderate housing prices. Perfect suburban neighborhood with landscaped front yards green trees under cloudy sky. Homes. Analysis financial growth decrease illustrations Row of gray houses with garages. Real estate market with moderate housing prices. Perfect suburban neighborhood with landscaped. Front yards green trees under
Free with trial Abstract red line chart graphic shows market decline. Digital data screen displays, finance failure. Economy drops down. Background bokeh lights. Analysis financial growth decrease illustrations Abstract red line chart graphic shows market decline. Digital data screen displays finance failure. Economy drops down. Abstract red line chart graphic shows. Abstract red line chart graphic shows market decline. Digital data screen displays, finance failure. Economy drops down. Background bokeh lights.
Free with trial This compelling data visualization showcases a clear downward trend, perfect for illustrating declining performance, market share, or other metrics. The dark background provides a striking contrast to the graph's lines, emphasizing the trend's trajectory. The visual clarity makes it an excellent tool for conveying complex information effectively, whether for internal reports, presentations to. Analysis financial growth decrease illustrations Visualizing Declining Trends A Dark Night Graph Depicts a Downward Trajectory in Data Ideal for Reports Presentations. This compelling data visualization. This compelling data visualization showcases a clear downward trend, perfect for illustrating declining performance, market share, or other metrics. The dark background provides a striking contrast to the graph's lines, emphasizing the trend's trajectory. The visual clarity makes it an excellent tool for conveying complex information effectively, whether for internal reports, presentations to
Free with trial This flat vector graphic depicts a financial concept featuring two national flags with downward pointing red arrows. In the center, a stack of various coins and paper money sits beneath a downward trending line graph. The overall composition uses a clean, minimalist style to represent economic volatility and market fluctuations between different monetary systems. Analysis financial growth decrease vectors A conceptual illustration showing a decline in international currency exchange rates. This flat vector graphic depicts a financial concept featuring two national. This flat vector graphic depicts a financial concept featuring two national flags with downward pointing red arrows. In the center, a stack of various coins and paper money sits beneath a downward trending line graph. The overall composition uses a clean, minimalist style to represent economic volatility and market fluctuations between different monetary systems
Free with trial Pink and green graph. Motion. Cartoon animation with graphs with a white dot moving to the left. High quality 4k footage. Analysis financial growth decrease illustrations Pink and green graph. Motion.Cartoon animation with graphs with a white dot moving to the left. High quality 4k footage
Free with trial Pink and green graph. Motion. Cartoon animation with graphs with a white dot moving to the left. High quality 4k footage. Analysis financial growth decrease illustrations Pink and green graph. Motion.Cartoon animation with graphs with a white dot moving to the left. High quality 4k footage
Free with trial Fuel oil crisis affects supply and prices at gas stations in cities. Trends show rising fuel prices at gas stations due. Analysis financial growth decrease illustrations Fuel oil crisis affects supply and prices at gas stations in cities. Trends show rising fuel prices at gas stations due
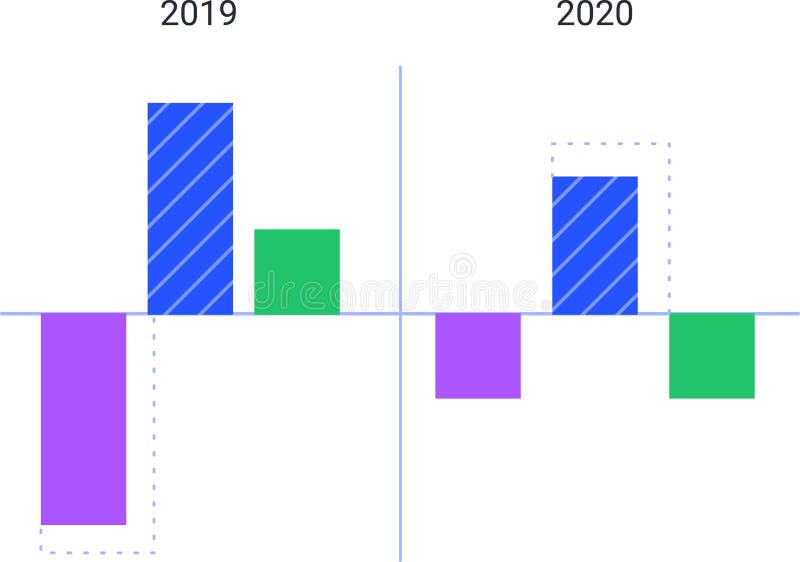
Free with trial Colorful bar charts are comparing data from 2019 and 2020, visualizing trends and statistics with positive and negative values represented by upward and downward bars. Analysis financial growth decrease vectors Colorful bar charts are comparing data from 2019 and 2020, visualizing trends and statistics with positive and negative. Values represented by upward and
Free with trial Colorful bar charts are comparing data from 2019 and 2020, visualizing trends and statistics with positive and negative values represented by upward and downward bars. Analysis financial growth decrease illustrations Colorful bar charts are comparing data from 2019 and 2020, visualizing trends and statistics with positive and negative. Values represented by upward and
Free with trial China Lost Decade is often used to describe a period of significant economic, social, and political stagnation or challenges that China might face or has faced over a specific decade. Analysis financial growth decrease illustrations The gold text on china flag for lost decade or business image 3d. China Lost Decade is often used to describe a period of significant economic, social, and. China Lost Decade is often used to describe a period of significant economic, social, and political stagnation or challenges that China might face or has faced over a specific decade
Free with trial China Lost Decade is often used to describe a period of significant economic, social, and political stagnation or challenges that China might face or has faced over a specific decade. Analysis financial growth decrease illustrations The gold text on china flag for lost decade or business image 3d. China Lost Decade is often used to describe a period of significant economic, social, and. China Lost Decade is often used to describe a period of significant economic, social, and political stagnation or challenges that China might face or has faced over a specific decade
Free with trial China Lost Decade is often used to describe a period of significant economic, social, and political stagnation or challenges that China might face or has faced over a specific decade. Analysis financial growth decrease illustrations The gold text on china flag for lost decade or business image 3d. China Lost Decade is often used to describe a period of significant economic, social, and. China Lost Decade is often used to describe a period of significant economic, social, and political stagnation or challenges that China might face or has faced over a specific decade
Free with trial China Lost Decade is often used to describe a period of significant economic, social, and political stagnation or challenges that China might face or has faced over a specific decade. Analysis financial growth decrease illustrations The gold text on china flag for lost decade or business image 3d. China Lost Decade is often used to describe a period of significant economic, social, and. China Lost Decade is often used to describe a period of significant economic, social, and political stagnation or challenges that China might face or has faced over a specific decade
Free with trial A hand is shown adjusting wooden blocks that display the numbers '2022' and a falling '6%' symbol. This imagery strongly suggests a change in economic conditions, potentially a decrease in interest rates or a recession. Analysis financial growth decrease illustrations Wooden blocks form 2022 and 6% falling suggesting economic downturn or rate change. A hand is shown adjusting wooden blocks that display the numbers '2022' and a. A hand is shown adjusting wooden blocks that display the numbers '2022' and a falling '6%' symbol. This imagery strongly suggests a change in economic conditions, potentially a decrease in interest rates or a recession
Free with trial The image shows a declining stock market graph overlaid with the Chinese flag suggesting economic downturn in China. Analysis financial growth decrease illustrations Chinese Flag Overlays A Negative Stock Market Graph. The image shows a declining stock market graph overlaid with the Chinese flag suggesting economic downturn. The image shows a declining stock market graph overlaid with the Chinese flag suggesting economic downturn in China
Free with trial A digital graphic with a percent symbols in red next to an American flag, depicting data or economic trends or tariffs. Analysis financial growth decrease illustrations A digital graphic with a percent symbols in red next to an American flag, depicting data or economic trends or tariffs.
Free with trial A digital graphic with a percent symbols in red next to an American flag, depicting data or economic trends or tariffs. Analysis financial growth decrease illustrations A digital graphic with a percent symbols in red next to an American flag, depicting data or economic trends or tariffs.
Free with trial A digital graphic with a percent symbols in red next to an American flag, depicting data or economic trends or tariffs. Analysis financial growth decrease illustrations A digital graphic with a percent symbols in red next to an American flag, depicting data or economic trends or tariffs.
Free with trial A digital graphic with a percent symbols in red next to an American flag, depicting data or economic trends or tariffs. Analysis financial growth decrease illustrations A digital graphic with a percent symbols in red next to an American flag, depicting data or economic trends or tariffs.
Free with trial Economic Recession of United Kingdom with waving flag in the background and red graph going down. UK Recession concept backdrop. Analysis financial growth decrease illustrations Economic Recession of United Kingdom with waving flag in the background and red graph going down. UK Recession concept backdrop.
Free with trial A leader or businessman tries his best to draw statistics so that they don't collapse and fall. as an illustration of the economic crisis vector illustration suitable for web and more. Analysis financial growth decrease vectors A leader or businessman tries his best to draw statisticst collapse and fall. as an illustration of the economic crisis. A leader or businessman tries his best. a leader or businessman tries his best to draw statistics so that they don't collapse and fall. as an illustration of the economic crisis vector illustration suitable for web and more
Free with trial Set paper cut Financial growth decrease Browser with stocks market Data analysis and icon. Paper art style. Vector. Analysis financial growth decrease vectors Set paper cut Financial growth decrease, Browser with stocks market, Data analysis and icon. Paper art style. Vector. Set paper cut Financial growth decrease. Set paper cut Financial growth decrease Browser with stocks market Data analysis and icon. Paper art style. Vector.
Free with trial Set line Financial growth decrease Data analysis Pie chart infographic Search cloud computing Mind map and Cloud download and upload icon. Vector. Analysis financial growth decrease vectors Set line Financial growth decrease, Data analysis, Pie chart infographic, Search cloud computing, Mind map and Cloud. Set line Financial growth decrease Data. Set line Financial growth decrease Data analysis Pie chart infographic Search cloud computing Mind map and Cloud download and upload icon. Vector.
Free with trial Set pop art Binary code Financial growth decrease and Data analysis icon. Vector. Analysis financial growth decrease vectors Set pop art Binary code, Financial growth, decrease and Data analysis icon. Vector. Set pop art Binary code Financial growth decrease and Data analysis icon. Set pop art Binary code Financial growth decrease and Data analysis icon. Vector.
Free with trial Set line Browser with exclamation mark Folder and lock Financial growth decrease and Data analysis. Business infographic template. Vector. Analysis financial growth decrease vectors Set line Browser with exclamation mark, Folder and lock, Financial growth decrease and Data analysis. Business. Set line Browser with exclamation mark Folder and. Set line Browser with exclamation mark Folder and lock Financial growth decrease and Data analysis. Business infographic template. Vector.
Free with trial Set Financial growth decrease Data analysis and Coal mine trolley on seamless pattern. Vector. Analysis financial growth decrease illustrations Set Financial growth decrease, Data analysis, and Coal mine trolley on seamless pattern. Vector. Set Financial growth decrease Data analysis and Coal mine. Set Financial growth decrease Data analysis and Coal mine trolley on seamless pattern. Vector.
Free with trial Set Isometric Data analysis Financial growth decrease and Folder and lock icon. Vector. Analysis financial growth decrease vectors Set Isometric Data analysis, Financial growth decrease and Folder and lock icon. Vector. Set Isometric Data analysis Financial growth decrease and Folder and. Set Isometric Data analysis Financial growth decrease and Folder and lock icon. Vector.
Free with trial Set line Financial growth decrease Calculator and Search data analysis. Glowing neon icon. Vector. Analysis financial growth decrease vectors Set line Financial growth, decrease, Calculator and Search data analysis. Glowing neon icon. Vector. Set line Financial growth decrease Calculator and Search. Set line Financial growth decrease Calculator and Search data analysis. Glowing neon icon. Vector.
Free with trial Set Financial growth decrease Data analysis and Binary code. Business infographic template. Vector. Analysis financial growth decrease illustrations Set Financial growth decrease, Data analysis and Binary code. Business infographic template. Vector. Set Financial growth decrease Data analysis and Binary code. Set Financial growth decrease Data analysis and Binary code. Business infographic template. Vector.
Free with trial Set line Data analysis Financial growth decrease and Sales funnel with chart on black and white. Vector. Analysis financial growth decrease vectors Set line Data analysis, Financial growth, decrease and Sales funnel with chart on black and white. Vector. Set line Data analysis Financial growth decrease and. Set line Data analysis Financial growth decrease and Sales funnel with chart on black and white. Vector.
Free with trial Set Financial growth decrease Data analysis and icon. Vector. Analysis financial growth decrease vectors Set Financial growth decrease, Data analysis and icon. Vector. Set Financial growth decrease Data analysis and icon. Vector. Set Financial growth decrease Data analysis and icon. Vector.
Free with trial Set Isometric line Data analysis Cloud and shield Financial growth decrease and Folder lock icon. Vector. Analysis financial growth decrease vectors Set Isometric line Data analysis, Cloud and shield, Financial growth decrease and Folder lock icon. Vector. Set Isometric line Data analysis Cloud and shield. Set Isometric line Data analysis Cloud and shield Financial growth decrease and Folder lock icon. Vector.
Free with trial Set line Data analysis Financial growth decrease and Mind map infographic on seamless pattern. Vector. Analysis financial growth decrease vectors Set line Data analysis, Financial growth decrease and Mind map infographic on seamless pattern. Vector. Set line Data analysis Financial growth decrease and Mind. Set line Data analysis Financial growth decrease and Mind map infographic on seamless pattern. Vector.
Free with trial Set Isometric Financial growth decrease Coal mine trolley and Data analysis icon. Vector. Analysis financial growth decrease vectors Set Isometric Financial growth decrease, Coal mine trolley and Data analysis icon. Vector. Set Isometric Financial growth decrease Coal mine trolley and Data. Set Isometric Financial growth decrease Coal mine trolley and Data analysis icon. Vector.
Free with trial Set line Pie chart infographic Financial growth decrease Data analysis and Sales funnel with. Business infographic template. Vector. Analysis financial growth decrease vectors Set line Pie chart infographic, Financial growth decrease, Data analysis and Sales funnel with. Business infographic. Set line Pie chart infographic Financial. Set line Pie chart infographic Financial growth decrease Data analysis and Sales funnel with. Business infographic template. Vector.
Free with trial Set Financial growth Data analysis Sales funnel with chart Server security padlock decrease Search data and icon. Vector. Analysis financial growth decrease vectors Set Financial growth, Data analysis, Sales funnel with chart, Server security padlock, decrease, Search data and icon. Set Financial growth Data analysis Sales. Set Financial growth Data analysis Sales funnel with chart Server security padlock decrease Search data and icon. Vector.
Free with trial Set Isometric line Pie chart infographic Data analysis Financial growth decrease and Server icon. Vector. Analysis financial growth decrease illustrations Set Isometric line Pie chart infographic, Data analysis, Financial growth decrease and Server icon. Vector. Set Isometric line Pie chart infographic Data. Set Isometric line Pie chart infographic Data analysis Financial growth decrease and Server icon. Vector.
Free with trial Set paper cut Document with graph chart Data analysis Financial growth decrease and icon. Paper art style. Vector. Analysis financial growth decrease vectors Set paper cut Document with graph chart, Data analysis, Financial growth decrease and icon. Paper art style. Vector. Set paper cut Document with graph chart Data. Set paper cut Document with graph chart Data analysis Financial growth decrease and icon. Paper art style. Vector.
Free with trial Set line Data analysis Calculator Pie chart infographic Server Cloud and shield Financial growth decrease and Browser with exclamation mark icon. Vector. Analysis financial growth decrease vectors Set line Data analysis, Calculator, Pie chart infographic, Server, Cloud and shield, Financial growth decrease and. Set line Data analysis Calculator Pie chart. Set line Data analysis Calculator Pie chart infographic Server Cloud and shield Financial growth decrease and Browser with exclamation mark icon. Vector.
Free with trial Set Financial growth Data analysis decrease and Server icon. Vector. Analysis financial growth decrease illustrations Set Financial growth, Data analysis, decrease and Server icon. Vector. Set Financial growth Data analysis decrease and Server icon. Vector. Set Financial growth Data analysis decrease and Server icon. Vector.
Free with trial Set Isometric Data analysis Browser with exclamation mark Financial growth decrease and Server icon. Vector. Analysis financial growth decrease illustrations Set Isometric Data analysis, Browser with exclamation mark, Financial growth decrease and Server icon. Vector. Set Isometric Data analysis Browser with. Set Isometric Data analysis Browser with exclamation mark Financial growth decrease and Server icon. Vector.
Free with trial Set Data analysis Financial growth decrease Network cloud connection Pie chart infographic and icon. Vector. Analysis financial growth decrease illustrations Set Data analysis, Financial growth decrease, Network cloud connection, Pie chart infographic, and icon. Vector. Set Data analysis Financial growth decrease. Set Data analysis Financial growth decrease Network cloud connection Pie chart infographic and icon. Vector.
Free with trial Set Search cloud computing Financial growth decrease Browser with stocks market and Data analysis. Business infographic template. Vector. Analysis financial growth decrease vectors Set Search cloud computing, Financial growth decrease, Browser with stocks market and Data analysis. Business. Set Search cloud computing Financial growth. Set Search cloud computing Financial growth decrease Browser with stocks market and Data analysis. Business infographic template. Vector.
Free with trial Set pop art Financial growth decrease Data analysis and icon. Vector. Analysis financial growth decrease illustrations Set pop art Financial growth, decrease, Data analysis and icon. Vector. Set pop art Financial growth decrease Data analysis and icon. Vector. Set pop art Financial growth decrease Data analysis and icon. Vector.
Free with trial Set Server Financial growth Folder and lock decrease Pie chart infographic and Search data analysis icon. Vector. Analysis financial growth decrease vectors Set Server, Financial growth, Folder and lock, decrease, Pie chart infographic and Search data analysis icon. Vector. Set Server Financial growth Folder and lock. Set Server Financial growth Folder and lock decrease Pie chart infographic and Search data analysis icon. Vector.
Free with trial Set line Financial growth Processor CPU Data analysis Search data decrease Browser with stocks market and Network cloud connection icon. Vector. Analysis financial growth decrease vectors Set line Financial growth, Processor CPU, Data analysis, Search data, decrease, Browser with stocks market, and Network. Set line Financial growth Processor CPU. Set line Financial growth Processor CPU Data analysis Search data decrease Browser with stocks market and Network cloud connection icon. Vector.
Free with trial Set line Data analysis Pie chart infographic Financial growth decrease and Sales funnel with with long shadow. Red square button. Vector. Analysis financial growth decrease vectors Set line Data analysis, Pie chart infographic, Financial growth decrease and Sales funnel with with long shadow. Red. Set line Data analysis Pie chart. Set line Data analysis Pie chart infographic Financial growth decrease and Sales funnel with with long shadow. Red square button. Vector.
Free with trial Set Network cloud connection Search data analysis Financial growth decrease and Data. Business infographic template. Vector. Analysis financial growth decrease illustrations Set Network cloud connection, Search data analysis, Financial growth decrease and Data. Business infographic template. Set Network cloud connection Search data. Set Network cloud connection Search data analysis Financial growth decrease and Data. Business infographic template. Vector.
Free with trial Set line Pie chart infographic Server Financial growth decrease Search globe Data analysis Browser with stocks market and Document icon. Vector. Analysis financial growth decrease illustrations Set line Pie chart infographic, Server, Financial growth decrease, Search globe, Data analysis, Browser with stocks. Set line Pie chart infographic Server. Set line Pie chart infographic Server Financial growth decrease Search globe Data analysis Browser with stocks market and Document icon. Vector.
Free with trial Set Pie chart infographic Data analysis Financial growth decrease Browser with stocks market and Document icon. Vector. Analysis financial growth decrease illustrations Set Pie chart infographic, Data analysis, Financial growth decrease, Browser with stocks market and Document icon. Set Pie chart infographic Data analysis. Set Pie chart infographic Data analysis Financial growth decrease Browser with stocks market and Document icon. Vector.
Free with trial Set line Data analysis Pie chart infographic Search globe Financial growth decrease Sales funnel with and icon. Vector. Analysis financial growth decrease illustrations Set line Data analysis, Pie chart infographic, Search globe, Financial growth decrease, Sales funnel with, and icon. Set line Data analysis Pie chart infographic. Set line Data analysis Pie chart infographic Search globe Financial growth decrease Sales funnel with and icon. Vector.
 Sign in