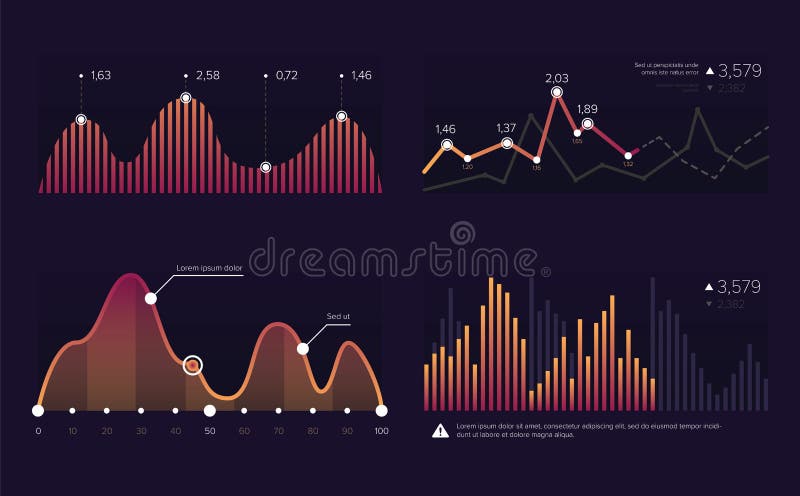
Free with trial Financial market analysis vector. Graphics. Analysis financial growth decrease vectors Financial market analysis vector. Graphics
Free with trial Financial market analysis vector. Graphics. Analysis financial growth decrease vectors Financial market analysis vector. Graphics
Free with trial Financial market analysis vector. Graphics. Analysis financial growth decrease vectors Financial market analysis vector. Graphics
Free with trial Financial market analysis vector. Graphics. Analysis financial growth decrease vectors Financial market analysis vector. Graphics
Free with trial Financial market analysis vector. Graphics. Analysis financial growth decrease vectors Financial market analysis vector. Graphics
Free with trial Financial market analysis vector. Graphics. Analysis financial growth decrease vectors Financial market analysis vector. Graphics
Free with trial Bangkok thailand city isometric financial economy condition concept for describe cities growth expand - vector. Illustration. Analysis financial growth decrease illustrations Bangkok thailand city isometric financial economy condition concept for describe cities growth expand - vector. Illustration
Free with trial Financial market analysis vector. Graphics. Analysis financial growth decrease vectors Financial market analysis vector. Graphics
Free with trial Liberia isometric financial economy condition concept for describe country growth expand - vector. Illustration. Analysis financial growth decrease illustrations Liberia isometric financial economy condition concept for describe country growth expand - vector. Illustration
Free with trial Busan pusan city isometric financial economy condition concept for describe cities growth expand - vector. Illustration. Analysis financial growth decrease illustrations Busan pusan city isometric financial economy condition concept for describe cities growth expand - vector. Illustration
Free with trial Togolese isometric financial economy condition concept for describe country growth expand - vector. Illustration. Analysis financial growth decrease illustrations Togolese isometric financial economy condition concept for describe country growth expand - vector. Illustration
Free with trial Infographics business graphics charts arrow. Financial analysis data graphs and diagram, marketing statistic modern business presentation elements vector investment progress icon set. Analysis financial growth decrease vectors Infographics arrow, Arrow Business, Financial analysis data graphic object elemeent arrow profit. Infographics business graphics charts arrow. Financial analysis. Infographics business graphics charts arrow. Financial analysis data graphs and diagram, marketing statistic modern business presentation elements vector investment progress icon set.
Free with trial Madagascar isometric financial economy condition concept for describe country growth expand - vector. Illustration. Analysis financial growth decrease illustrations Madagascar isometric financial economy condition concept for describe country growth expand - vector. Illustration
Free with trial Berlin german city isometric financial economy condition concept for describe cities growth expand - vector. Illustration. Analysis financial growth decrease illustrations Berlin german city isometric financial economy condition concept for describe cities growth expand - vector. Illustration
Free with trial Calcutta india city isometric financial economy condition concept for describe cities growth expand - vector. Illustration. Analysis financial growth decrease illustrations Calcutta india city isometric financial economy condition concept for describe cities growth expand - vector. Illustration
Free with trial Chengdu city isometric financial economy condition concept for describe cities growth expand - vector. Illustration. Analysis financial growth decrease illustrations Chengdu city isometric financial economy condition concept for describe cities growth expand - vector. Illustration
Free with trial Toronto ontario city isometric financial economy condition concept for describe cities growth expand - vector. Illustration. Analysis financial growth decrease illustrations Toronto ontario city isometric financial economy condition concept for describe cities growth expand - vector. Illustration
Free with trial Santiago city in philippines city isometric financial economy condition concept for describe cities growth expand - vector. Illustration. Analysis financial growth decrease illustrations Santiago city in philippines city isometric financial economy condition concept for describe cities growth expand - vector. Illustration
Free with trial Addis ababa city isometric financial economy condition concept for describe cities growth expand - vector. Illustration. Analysis financial growth decrease illustrations Addis ababa city isometric financial economy condition concept for describe cities growth expand - vector. Illustration
Free with trial New york united states usa city isometric financial economy condition concept for describe cities growth expand - vector. Illustration. Analysis financial growth decrease illustrations New york united states usa city isometric financial economy condition concept for describe cities growth expand - vector. Illustration
Free with trial Financial crisis, stock market crash, disappointed businessmen. market growth, happy investor standing near green growth trading arrow. crisis and marlet growth backgrounds. Analysis financial growth decrease vectors Financial crisis, stock market crash, disappointed businessmen. market growth, happy investor standing near green growth. Trading arrow. crisis and marlet
Free with trial Dalian china city isometric financial economy condition concept for describe cities growth expand - vector. Illustration. Analysis financial growth decrease illustrations Dalian china city isometric financial economy condition concept for describe cities growth expand - vector. Illustration
Free with trial Harbin china city isometric financial economy condition concept for describe cities growth expand - vector. Illustration. Analysis financial growth decrease illustrations Harbin china city isometric financial economy condition concept for describe cities growth expand - vector. Illustration
Free with trial Tashkent uzbekistan city isometric financial economy condition concept for describe cities growth expand - vector. Illustration. Analysis financial growth decrease illustrations Tashkent uzbekistan city isometric financial economy condition concept for describe cities growth expand - vector. Illustration
Free with trial Shenyang northeast liaoning city isometric financial economy condition concept for describe cities growth expand - vector. Illustration. Analysis financial growth decrease illustrations Shenyang northeast liaoning city isometric financial economy condition concept for describe cities growth expand - vector. Illustration
Free with trial Central african republic isometric financial economy condition concept for describe country growth expand - vector. Illustration. Analysis financial growth decrease illustrations Central african republic isometric financial economy condition concept for describe country growth expand - vector. Illustration
Free with trial Pyongyang north korea city isometric financial economy condition concept for describe cities growth expand - vector. Illustration. Analysis financial growth decrease illustrations Pyongyang north korea city isometric financial economy condition concept for describe cities growth expand - vector. Illustration
Free with trial Medan indonesia city isometric financial economy condition concept for describe cities growth expand - vector. Illustration. Analysis financial growth decrease illustrations Medan indonesia city isometric financial economy condition concept for describe cities growth expand - vector. Illustration
Free with trial Set line Cloud download and upload Browser with stocks market Data analysis exclamation Pie chart infographic Financial growth decrease Mind map and icon. Vector. Analysis financial growth decrease vectors Set line Cloud download and upload, Browser with stocks market, Data analysis, exclamation, Pie chart infographic. Set line Cloud download and upload Browser. Set line Cloud download and upload Browser with stocks market Data analysis exclamation Pie chart infographic Financial growth decrease Mind map and icon. Vector.
Free with trial Faisalabad pakistan city isometric financial economy condition concept for describe cities growth expand - vector. Illustration. Analysis financial growth decrease illustrations Faisalabad pakistan city isometric financial economy condition concept for describe cities growth expand - vector. Illustration
Free with trial Taiyun shanxi china city isometric financial economy condition concept for describe cities growth expand - vector. Illustration. Analysis financial growth decrease illustrations Taiyun shanxi china city isometric financial economy condition concept for describe cities growth expand - vector. Illustration
Free with trial Set Sales funnel with chart Binary code Server security padlock Browser stocks market Financial growth Data analysis Pie infographic and icon. Vector. Analysis financial growth decrease vectors Set Sales funnel with chart, Binary code, Server security padlock, Browser stocks market, Financial growth, Data. Set Sales funnel with chart Binary code Server. Set Sales funnel with chart Binary code Server security padlock Browser stocks market Financial growth Data analysis Pie infographic and icon. Vector.
Free with trial A dynamic abstract financial graph with peaks in neon colors against a dark, gradient background, depicting growth and decline. Trends. Minimalism. Analysis financial growth decrease illustrations A dynamic abstract financial graph with peaks in neon colors against a dark, gradient background, depicting growth and decline. Trends. Minimalism
Free with trial Xian shaanxi province city isometric financial economy condition concept for describe cities growth expand - vector. Illustration. Analysis financial growth decrease illustrations Xian shaanxi province city isometric financial economy condition concept for describe cities growth expand - vector. Illustration
Free with trial Los angeles california city isometric financial economy condition concept for describe cities growth expand - vector. Illustration. Analysis financial growth decrease illustrations Los angeles california city isometric financial economy condition concept for describe cities growth expand - vector. Illustration
Free with trial Mumbai or bombay india city isometric financial economy condition concept for describe cities growth expand - vector. Illustration. Analysis financial growth decrease illustrations Mumbai or bombay india city isometric financial economy condition concept for describe cities growth expand - vector. Illustration
Free with trial Growth chart, Data analysis and Trade infochart minimal line icons. Neon laser 3d lights. Dot plot icons. For web, application, printing. Upper arrows, Magnifying glass, Business analysis. Vector. Analysis financial growth decrease vectors Growth chart, Data analysis and Trade infochart minimal line icons. For web application, printing Vector. Growth chart, Data analysis and Trade infochart minimal. Growth chart, Data analysis and Trade infochart minimal line icons. Neon laser 3d lights. Dot plot icons. For web, application, printing. Upper arrows, Magnifying glass, Business analysis. Vector
Free with trial Outline set of Growth chart, Stock analysis and Report document line icons for web application. Phone ui interface. Include Column diagram, Loan percent, Line chart icons. Vector. Analysis financial growth decrease vectors Outline set of Growth chart, Stock analysis and Report document line icons for web application. For design. Vector. Outline set of Growth chart, Stock analysis. Outline set of Growth chart, Stock analysis and Report document line icons for web application. Phone ui interface. Include Column diagram, Loan percent, Line chart icons. Vector
Free with trial Badge red arrow on computer monitor. Infographics concept for presentation or financial report. Increase and decrease of indicators in graphic diagram. Analysis financial growth decrease illustrations Badge red arrow on computer monitor. Infographics concept for presentation or financial report. Increase and decrease. Of indicators in graphic diagram
Free with trial Image charts and diagrams for presentation or financial report. Infographics concept. Increase and decrease of indicators in graphic diagram. Colorful illustration illustration. Analysis financial growth decrease illustrations Image charts and diagrams for presentation or financial report. Infographics concept.Increase and decrease of. Indicators in graphic diagram. Colorful. image charts and diagrams for presentation or financial report. Infographics concept.Increase and decrease of indicators in graphic diagram. Colorful illustration illustration
Free with trial Set line Cloud download Online shopping on screen Browser window upload Laptop with browser Financial growth decrease Graph chart infographic and icon. Vector. Analysis financial growth decrease vectors Set line Cloud download, Online shopping on screen, Browser window, upload, Laptop with browser, Financial growth. Set line Cloud download Online shopping on. Set line Cloud download Online shopping on screen Browser window upload Laptop with browser Financial growth decrease Graph chart infographic and icon. Vector.
Free with trial Set Calculator Server Pie chart infographic Coal mine trolley Binary code Search cloud computing Data analysis and Financial growth decrease icon. Vector. Analysis financial growth decrease vectors Set Calculator, Server, Pie chart infographic, Coal mine trolley, Binary code, Search cloud computing, Data analysis and. Set Calculator Server Pie chart. Set Calculator Server Pie chart infographic Coal mine trolley Binary code Search cloud computing Data analysis and Financial growth decrease icon. Vector.
Free with trial Set Browser with stocks market Search cloud computing Folder and lock Coal mine trolley folder Financial growth decrease and Server icon. Vector. Analysis financial growth decrease vectors Set Browser with stocks market, Search cloud computing, Folder and lock, Coal mine trolley, folder, Financial growth. Set Browser with stocks market Search cloud. Set Browser with stocks market Search cloud computing Folder and lock Coal mine trolley folder Financial growth decrease and Server icon. Vector.
Free with trial Set line Data analysis Network cloud connection Sales funnel with chart Search folder Cloud download and upload Financial growth decrease and Pie infographic icon. Vector. Analysis financial growth decrease illustrations Set line Data analysis, Network cloud connection, Sales funnel with chart, Search folder, Cloud download and upload. Set line Data analysis Network cloud. Set line Data analysis Network cloud connection Sales funnel with chart Search folder Cloud download and upload Financial growth decrease and Pie infographic icon. Vector.
Free with trial Set line Search cloud computing Data analysis data Browser with exclamation mark Coal mine trolley Sales funnel chart and Financial growth decrease icon. Vector. Analysis financial growth decrease vectors Set line Search cloud computing, Data analysis, data, Browser with exclamation mark, Coal mine trolley, Sales funnel. Set line Search cloud computing Data. Set line Search cloud computing Data analysis data Browser with exclamation mark Coal mine trolley Sales funnel chart and Financial growth decrease icon. Vector.
Free with trial Set line Browser with stocks market Processor CPU Data analysis Calculator Pie chart infographic Binary code Financial growth decrease and Network cloud connection icon. Vector. Analysis financial growth decrease vectors Set line Browser with stocks market, Processor CPU, Data analysis, Calculator, Pie chart infographic, Binary code. Set line Browser with stocks market Processor. Set line Browser with stocks market Processor CPU Data analysis Calculator Pie chart infographic Binary code Financial growth decrease and Network cloud connection icon. Vector.
Free with trial Set Pie chart infographic Folder and lock Server security with padlock Cloud shield Financial growth and decrease icon. Vector. Analysis financial growth decrease vectors Set Pie chart infographic, Folder and lock, Server security with padlock, Cloud shield, Financial growth and decrease. Set Pie chart infographic Folder and lock. Set Pie chart infographic Folder and lock Server security with padlock Cloud shield Financial growth and decrease icon. Vector.
Free with trial Set line Magnifying glass with check mark Browser window Search engine Website stocks market Financial growth decrease incognito and Cloud technology data transfer icon. Vector. Analysis financial growth decrease vectors Set line Magnifying glass with check mark, Browser window, Search engine, Website stocks market, Financial growth. Set line Magnifying glass with check mark. Set line Magnifying glass with check mark Browser window Search engine Website stocks market Financial growth decrease incognito and Cloud technology data transfer icon. Vector.
Free with trial Set line Browser window Search engine setting Cloud download Magnifying glass with check mark Financial growth decrease and icon. Vector. Analysis financial growth decrease vectors Set line Browser window, Search engine, setting, Cloud download, Magnifying glass with check mark, Financial growth. Set line Browser window Search engine. Set line Browser window Search engine setting Cloud download Magnifying glass with check mark Financial growth decrease and icon. Vector.
Free with trial Set Pie chart infographic Arrow Graph chart diagram Financial growth and icon. Vector. Analysis financial growth decrease vectors Set Pie chart infographic, Arrow, Graph, chart, diagram, Financial growth, and icon. Vector. Set Pie chart infographic Arrow Graph chart diagram Financial growth. Set Pie chart infographic Arrow Graph chart diagram Financial growth and icon. Vector.
Free with trial Crypto Analysis Growth Composition. Isometric business analyst professional composition with conceptual financial analysis icons and people vector illustration. Analysis financial growth decrease vectors Crypto Analysis Growth Composition. Isometric business analyst professional composition with conceptual financial analysis icons and people vector illustration
Free with trial Money loss and economic crisis, money market crash and global financial downturn, vector line icons. Economic crisis icons of bankruptcy, price decrease with money inflation and unemployment growth. Analysis financial growth decrease vectors Money loss and economic crisis, money market crash. And global financial downturn, vector line icons. Economic crisis icons of bankruptcy, price decrease with. Money loss and economic crisis, money market crash and global financial downturn, vector line icons. Economic crisis icons of bankruptcy, price decrease with money inflation and unemployment growth
Free with trial Money loss and economic crisis, money market crash and global financial downturn, vector line icons. Economic crisis icons of bankruptcy, price decrease with money inflation and unemployment growth. Analysis financial growth decrease vectors Money loss and economic crisis, money market crash. And global financial downturn, vector line icons. Economic crisis icons of bankruptcy, price decrease with. Money loss and economic crisis, money market crash and global financial downturn, vector line icons. Economic crisis icons of bankruptcy, price decrease with money inflation and unemployment growth
Free with trial Finance decrease and crisis graph. Financial crisis, economic recession concept. Employees trying to support falling. Arrows. Analysis financial growth decrease vectors Finance decrease and crisis graph. Financial crisis, economic recession concept. Employees trying to support falling. Arrows
Free with trial Chart graph. Black Icon growth and downward with arrow isolated on background. Hologram positive, fall percentage. Design business concept direction growth, recession. Analysis. Vector illustration. Analysis financial growth decrease vectors Chart graph. Black Icon growth and downward with arrow isolated on background. Hologram positive, fall percentage. Design business. Concept direction growth. Chart graph. Black Icon growth and downward with arrow isolated on background. Hologram positive, fall percentage. Design business concept direction growth, recession. Analysis. Vector illustration
Free with trial Risk Minimization spotlighted. Professionals navigate financial charts, with rising arrows denoting growth. Compass points to reduced risk. Safety and strategy emphasized. Flat vector illustration. Analysis financial growth decrease vectors Risk Minimization spotlighted. Professionals navigate financial charts,. With rising arrows denoting growth. Compass points to reduced risk. Safety and strategy. Risk Minimization spotlighted. Professionals navigate financial charts, with rising arrows denoting growth. Compass points to reduced risk. Safety and strategy emphasized. Flat vector illustration.
Free with trial Risk Minimization spotlighted dark or night mode web, landing. Professionals navigate financial charts, with rising arrows denoting growth. Compass points to reduced risk. Flat vector illustration. Analysis financial growth decrease vectors Risk Minimization spotlighted. Professionals navigate financial charts. Risk Minimization spotlighted dark or night mode web, landing. Professionals navigate. Risk Minimization spotlighted dark or night mode web, landing. Professionals navigate financial charts, with rising arrows denoting growth. Compass points to reduced risk. Flat vector illustration.
Free with trial Stock market trading technical analysis bar chart fall. Business candlestick graph exchange down trend. Crisis economy and investment loss graph. Trader financial index crash concept. Money losing eps. Analysis financial growth decrease vectors Stock market trading technical analysis bar chart fall. Business candlestick graph exchange down trend. Crisis economy. And investment loss graph. Trader. Stock market trading technical analysis bar chart fall. Business candlestick graph exchange down trend. Crisis economy and investment loss graph. Trader financial index crash concept. Money losing eps
Free with trial Data analysis, Document and Graph chart line icons set. Infographic timeline. Cashback sign. Magnifying glass, File with diagram, Growth report. Financial transfer. Finance set. Vector. Analysis financial growth decrease vectors Data analysis, Document and Graph chart icons set. Cashback sign. Vector. Data analysis, Document and Graph chart line icons set. Infographic timeline. Cashback. Data analysis, Document and Graph chart line icons set. Infographic timeline. Cashback sign. Magnifying glass, File with diagram, Growth report. Financial transfer. Finance set. Vector
Free with trial Set of Science icons, such as Financial diagram, Report timer, Recovery hdd symbols. Mobile screen mockup banners. Graph laptop line icons. Candlestick chart, Growth chart, Backup info. Vector. Analysis financial growth decrease vectors Set of Science icons, such as Financial diagram, Report timer, Recovery hdd symbols. Graph laptop line icons. Vector. Set of Science icons, such as Financial. Set of Science icons, such as Financial diagram, Report timer, Recovery hdd symbols. Mobile screen mockup banners. Graph laptop line icons. Candlestick chart, Growth chart, Backup info. Vector
Free with trial Word assets on coins. Business concept. Liquidity and value. Financial resources. Return on assets. Economic strategy. Investment balance. Capital value. Budget analysis. 3d render. Analysis financial growth decrease illustrations Word assets on coins. Business concept. Liquidity and value. Financial resources. Return on assets. Economic strategy. Investment balance. Capital value
Free with trial Bitcoin, Income money and Presentation board icons simple set. Timeline infographic. Stock analysis sign. Cryptocurrency coin, Savings, Growth chart. Business trade. Finance set. Vector. Analysis financial growth decrease vectors Bitcoin, Income money and Presentation board icons set. Stock analysis sign. Vector. Bitcoin, Income money and Presentation board icons simple set. Timeline. Bitcoin, Income money and Presentation board icons simple set. Timeline infographic. Stock analysis sign. Cryptocurrency coin, Savings, Growth chart. Business trade. Finance set. Vector
Free with trial Bitcoin, Income money and Presentation board icons simple set. Button with halftone dots. Stock analysis sign. Cryptocurrency coin, Savings, Growth chart. Business trade. Finance set. Vector. Analysis financial growth decrease vectors Bitcoin, Income money and Presentation board icons set. Stock analysis sign. Vector. Bitcoin, Income money and Presentation board icons simple set. Button with. Bitcoin, Income money and Presentation board icons simple set. Button with halftone dots. Stock analysis sign. Cryptocurrency coin, Savings, Growth chart. Business trade. Finance set. Vector
Free with trial Dot plot, Air balloon and Pyramid chart icons simple set. Financial documents sign. Presentation graph, Sky travelling, Report analysis. Check docs. Education set. Linear dot plot icon. Vector. Analysis financial growth decrease vectors Dot plot, Air balloon and Pyramid chart icons set. Financial documents sign. Vector. Dot plot, Air balloon and Pyramid chart icons simple set. Financial. Dot plot, Air balloon and Pyramid chart icons simple set. Financial documents sign. Presentation graph, Sky travelling, Report analysis. Check docs. Education set. Linear dot plot icon. Vector
Free with trial Graph or block diagram shows the increase or decrease of shares, which means financial loss or gain. Ai generated. Analysis financial growth decrease illustrations Graph or block diagram shows the increase or decrease of shares, which means financial loss or gain. Ai generated
Free with trial Dot plot, Air balloon and Pyramid chart icons simple set. Infographic timeline. Financial documents sign. Presentation graph, Sky travelling, Report analysis. Check docs. Education set. Vector. Analysis financial growth decrease vectors Dot plot, Air balloon and Pyramid chart icons set. Financial documents sign. Vector. Dot plot, Air balloon and Pyramid chart icons simple set. Infographic. Dot plot, Air balloon and Pyramid chart icons simple set. Infographic timeline. Financial documents sign. Presentation graph, Sky travelling, Report analysis. Check docs. Education set. Vector
Free with trial Cashback sign. Diploma certificate, save planet chat bubbles. Data analysis, Document and Graph chart line icons set. Magnifying glass, File with diagram, Growth report. Financial transfer. Vector. Analysis financial growth decrease vectors Data analysis, Document and Graph chart icons set. Cashback sign. Vector. Cashback sign. Diploma certificate, save planet chat bubbles. Data analysis, Document. Cashback sign. Diploma certificate, save planet chat bubbles. Data analysis, Document and Graph chart line icons set. Magnifying glass, File with diagram, Growth report. Financial transfer. Vector
Free with trial Graph or block diagram shows the increase or decrease of shares, which means financial loss or gain. Ai generated. Analysis financial growth decrease illustrations Graph or block diagram shows the increase or decrease of shares, which means financial loss or gain. Ai generated
Free with trial Graph or block diagram shows the increase or decrease of shares, which means financial loss or gain. Ai generated. Analysis financial growth decrease illustrations Graph or block diagram shows the increase or decrease of shares, which means financial loss or gain. Ai generated
Free with trial Graph or block diagram shows the increase or decrease of shares, which means financial loss or gain. Ai generated. Analysis financial growth decrease illustrations Graph or block diagram shows the increase or decrease of shares, which means financial loss or gain. Ai generated
Free with trial Graph or block diagram shows the increase or decrease of shares, which means financial loss or gain. Ai generated. Analysis financial growth decrease illustrations Graph or block diagram shows the increase or decrease of shares, which means financial loss or gain. Ai generated
Free with trial Graph or block diagram shows the increase or decrease of shares, which means financial loss or gain. Ai generated. Analysis financial growth decrease illustrations Graph or block diagram shows the increase or decrease of shares, which means financial loss or gain. Ai generated
Free with trial Graph or block diagram shows the increase or decrease of shares, which means financial loss or gain. Ai generated. Analysis financial growth decrease illustrations Graph or block diagram shows the increase or decrease of shares, which means financial loss or gain. Ai generated
Free with trial Graph or block diagram shows the increase or decrease of shares, which means financial loss or gain. Ai generated. Analysis financial growth decrease illustrations Graph or block diagram shows the increase or decrease of shares, which means financial loss or gain. Ai generated
Free with trial Graph or block diagram shows the increase or decrease of shares, which means financial loss or gain. Ai generated. Analysis financial growth decrease illustrations Graph or block diagram shows the increase or decrease of shares, which means financial loss or gain. Ai generated
Free with trial Graph or block diagram shows the increase or decrease of shares, which means financial loss or gain. Ai generated. Analysis financial growth decrease illustrations Graph or block diagram shows the increase or decrease of shares, which means financial loss or gain. Ai generated
Free with trial Graph or block diagram shows the increase or decrease of shares, which means financial loss or gain. Ai generated. Analysis financial growth decrease illustrations Graph or block diagram shows the increase or decrease of shares, which means financial loss or gain. Ai generated
Free with trial Graph or block diagram shows the increase or decrease of shares, which means financial loss or gain. Ai generated. Analysis financial growth decrease illustrations Graph or block diagram shows the increase or decrease of shares, which means financial loss or gain. Ai generated
Free with trial Graph or block diagram shows the increase or decrease of shares, which means financial loss or gain. Ai generated. Analysis financial growth decrease illustrations Graph or block diagram shows the increase or decrease of shares, which means financial loss or gain. Ai generated
Free with trial Graph or block diagram shows the increase or decrease of shares, which means financial loss or gain. Ai generated. Analysis financial growth decrease illustrations Graph or block diagram shows the increase or decrease of shares, which means financial loss or gain. Ai generated
 Sign in