Free with trial Green cube with an upward arrow, symbolizing business progress, finance and investment growth. Close-up. Arrow decrease economy illustrations Green cube with an upward arrow, symbolizing business progress, finance and investment growth
Free with trial Red cube with arrow up. Business and market growth concept. Close-up. Arrow decrease economy illustrations Red cube with arrow up. Business and market growth concept
Free with trial A man standing in front of a chart with an arrow pointing to it, analyzing sales growth data, Worker analyzes sales growth graph, Simple and minimalist flat Vector Illustration. Arrow decrease economy vectors A man standing in front of a chart with an arrow pointing to it, analyzing sales growth data, Worker analyzes sales growth graph
Free with trial Composite collage image of inflation recession sad female arrow down investment billboard comics zine minimal. Arrow decrease economy illustrations Composite collage image of inflation recession sad female arrow down investment billboard comics zine minimal
Free with trial Business growth and decline icon set. Up and down trend chart symbol illustration. Increase and decrease bar graph concept. Arrow decrease economy vectors Business growth and decline icon set. Up and down trend chart symbol. Increase and decrease bar graph concept
Free with trial The Red arrow Down on Business background 3d rendering. Arrow decrease economy illustrations The Red arrow Down on Business background 3d rendering
Free with trial The Red arrow Down on Business background 3d rendering. Arrow decrease economy illustrations The Red arrow Down on Business background 3d rendering
Free with trial The Red arrow Down on Business background 3d rendering. Arrow decrease economy illustrations The Red arrow Down on Business background 3d rendering
Free with trial Crystal magic ball and businessman hands with graph up or down inside. Oracle sphere. Investment forecast. Stock exchange volatility. Economy prediction. Financial growth prognosis. Vector concept. Arrow decrease economy vectors Crystal magic ball and businessman hands with graph up or down inside. Investment forecast. Stock exchange volatility. Economy. Crystal magic ball and businessman hands with graph up or down inside. Oracle sphere. Investment forecast. Stock exchange volatility. Economy prediction. Financial growth prognosis. Vector concept
Free with trial Up and down arrow dollar icon on black circle. USD growth and decline sign symbol vector. Arrow decrease economy vectors Up and down arrow dollar icon on black circle. USD growth and decline sign symbol
Free with trial The Red arrow Down on Business background 3d rendering. Arrow decrease economy illustrations The Red arrow Down on Business background 3d rendering
Free with trial Dollar arrow growth and decline icon on black circle. USD up and down sign symbol vector. Arrow decrease economy vectors Dollar arrow growth and decline icon on black circle. USD up and down sign symbol
Free with trial The Red arrow Down on Business background 3d rendering. Arrow decrease economy illustrations The Red arrow Down on Business background 3d rendering
Free with trial The Red arrow Down on Business background 3d rendering. Arrow decrease economy illustrations The Red arrow Down on Business background 3d rendering
Free with trial The Red arrow Down on Business background 3d rendering. Arrow decrease economy illustrations The Red arrow Down on Business background 3d rendering
Free with trial The Red arrow Down on Business background 3d rendering. Arrow decrease economy illustrations The Red arrow Down on Business background 3d rendering
Free with trial Declining bar graph with a downward arrow symbolizing economic recession and financial loss. Arrow decrease economy vectors Declining bar graph with a downward arrow symbolizing economic recession and financial loss
Free with trial Economic recession, business owner seated on a falling down bar graph and a red arrow. Arrow decrease economy vectors Economic recession, business owner seated on a falling down bar graph and a red arrow
Free with trial Bar chart with decreasing orange bars and a downward red arrow illustrating financial decline. Arrow decrease economy vectors Bar chart with decreasing orange bars and a downward red arrow illustrating financial decline
Free with trial Sad businessman sitting on a pile of coins with a downward arrow. Financial Instability concept. trend modern vector flat illustration. Arrow decrease economy vectors Sad businessman sitting on a pile of coins with a downward arrow. Financial Instability concept.
Free with trial Trend chart icon in black circle. Growth and decline symbol. Up and down arrow with bar graph illustration. Arrow decrease economy vectors Trend chart icon in black circle. Growth and decline symbol. Up and down arrow with bar graph
Free with trial A 3D rendered illustration features a large blue downward-pointing arrow positioned diagonally on a white background. Overlapping the arrow is a small pink circle containing a white percentage symbol. This visual effectively communicates concepts such as discounts, sales, price reductions, negative trends, or financial decline. Arrow decrease economy illustrations Blue Downward Arrow with Pink Circle and Percentage Symbol on White Background image photo. A 3D rendered illustration features a large blue downward-pointing arrow positioned diagonally on a white background. Overlapping the arrow is a small pink circle containing a white percentage symbol. This visual effectively communicates concepts such as discounts, sales, price reductions, negative trends, or financial decline
Free with trial A red graph with an arrow pointing downwards, indicating a decline. The graph illustrates a loss or decrease, often used in the context of finance, market trends, or economic recession. Isolated on white. Arrow decrease economy illustrations Red downward graph isolated on white background for economic decline, loss, or recession use. A red graph with an arrow pointing downwards, indicating a decline. The graph illustrates a loss or decrease, often used in the context of finance, market trends, or economic recession. Isolated on white
Free with trial A bold red arrow points downward, symbolizing a negative trend or decline, often associated with financial or performance metrics. This visual representation is commonly used in reports. Arrow decrease economy vectors Red downward arrow indicating decline in trends or performance metrics across data visuals. A bold red arrow points downward, symbolizing a negative trend or decline, often associated with financial or performance metrics. This visual representation is commonly used in reports.
Free with trial Global recession icon showing declining graph and downward arrow with globe and money, line art icon set. Arrow decrease economy vectors Global recession icon showing declining graph and downward arrow with globe and money, line art icon set
Free with trial Decreasing Value: Cartoon Money Sack with Downward Arrow Symbolizes Financial Loss or Decline. Arrow decrease economy vectors Decreasing Value: Cartoon Money Sack with Downward Arrow Symbolizes Financial Loss or Decline
Free with trial Declining bar graph on a trolley, showing a downward arrow, stock market trend, loss illustration. Arrow decrease economy vectors Declining bar graph on a trolley, showing a downward arrow, stock market trend, loss illustration
Free with trial Downward Chart: Declining bar graph with falling arrow indicates losses and economic downturn. Arrow decrease economy vectors Downward Chart: Declining bar graph with falling arrow indicates losses and economic downturn
Free with trial Composite trend artwork sketch image collage of business trader arrow down lose money crisis charts down pile coins young lady sad sit. Arrow decrease economy illustrations Composite trend artwork sketch image collage of business trader arrow down lose money crisis charts down pile coins
Free with trial Image depicting a financial crisis with stacks of gold coins decreasing in size, accompanied by a red downward-pointing arrow symbolizing a market downturn. Arrow decrease economy illustrations Financial Crisis: Decreasing Market Trend Visualized with Gold Coins and a Red Downward Arrow. Image depicting a financial crisis with stacks of gold coins decreasing in size, accompanied by a red downward-pointing arrow symbolizing a market downturn
Free with trial A vibrant red arrow curves downwards, indicating a decline or negative trend, isolated on a clean white background. Arrow decrease economy illustrations Red arrow pointing down isolated on white background. A vibrant red arrow curves downwards, indicating a decline or negative trend, isolated on a clean white background
Free with trial A man's hand in a white shirt sleeve is holding a jagged red arrow pointing downward, representing a drop or decline. The arrow appears three-dimensional and zigzags as it moves lower. Set against a clean white background, the image conveys concepts such as financial loss, market crash, business downturn, or economic crisis. Image created with AI. Arrow decrease economy illustrations Businessman hand holding red descending arrow symbolizing economic decline or financial loss. A man's hand in a white shirt sleeve is holding a jagged red arrow pointing downward, representing a drop or decline. The arrow appears three-dimensional and zigzags as it moves lower. Set against a clean white background, the image conveys concepts such as financial loss, market crash, business downturn, or economic crisis. Image created with AI.
Free with trial Downward trend in global recession icon, financial decline with world map and arrow, line art icon set. Arrow decrease economy vectors Downward trend in global recession icon, financial decline with world map and arrow, line art icon set
Free with trial Set line Contract money and pen, Global economic crisis news, and Dollar rate decrease icon. Vector. Arrow decrease economy vectors Set line Contract money and pen, Global economic crisis news, and Dollar rate decrease icon. Vector
Free with trial Set line Contract money and pen, Dollar rate decrease, Global economic crisis and Money bomb dollar icon. Vector. Arrow decrease economy vectors Set line Contract money and pen, Dollar rate decrease, Global economic crisis and Money bomb dollar icon. Vector
Free with trial In a softly lit setting, a hand holds a translucent card. On the card, a downward-pointing arrow graphic is displayed, symbolizing decline, loss, or negative trend. The color palette is minimal. Arrow decrease economy illustrations A hand delicately holds a card displaying a stark white arrow pointing downwards, indicating loss. In a softly lit setting, a hand holds a translucent card. On the card, a downward-pointing arrow graphic is displayed, symbolizing decline, loss, or negative trend. The color palette is minimal
Free with trial Stylized illustration of houses with a large orange downward arrow, suggesting a decline in the real estate market. Generative AI. Arrow decrease economy illustrations Stylized illustration of houses with a large orange downward arrow, suggesting a decline in the real estate market
Free with trial Hand drawn black and white illustration of a percent sign inside a circular arrow pointing down. Arrow decrease economy vectors Hand drawn black and white illustration of a percent sign inside a circular arrow pointing down
Free with trial Fund investment concept, Interest rate, percentage and arrow investment on coin instead of return return index fund and mutual fund return long term investment retirement fund. Arrow decrease economy illustrations Fund investment concept, Interest rate, percentage and arrow investment on coin instead of return return index fund and mutual
Free with trial A minimalistic illustration features a diminishing stack of coins alongside a downward arrow, representing reduced spending. The design uses clean vector style and balanced white tones for clarity. Arrow decrease economy illustrations Shrinking stack of coins with downward arrow indicating reduced spending and financial decline. A minimalistic illustration features a diminishing stack of coins alongside a downward arrow, representing reduced spending. The design uses clean vector style and balanced white tones for clarity
Free with trial Percentage growth and decline icons. Percent arrow up and down flat style symbols - stock vector. Arrow decrease economy illustrations Percentage growth and decline icons. Percent arrow up and down flat style symbols - stock vector
Free with trial A 3D bar graph with light blue bars of decreasing height, indicating a downward trend. A bright yellow arrow points downwards, crossing over the bars, symbolizing financial decline or economic recession. The background is a soft, muted pink. Arrow decrease economy illustrations Downward Trend Graph with Falling Arrow Illustrating Financial Decline or Economic Recession. A 3D bar graph with light blue bars of decreasing height, indicating a downward trend. A bright yellow arrow points downwards, crossing over the bars, symbolizing financial decline or economic recession. The background is a soft, muted pink
Free with trial Concrete bar graph showing a decline with a downward arrow. Business loss and negative trend concept for financial downturn analysis. Arrow decrease economy illustrations Concrete bar graph showing a decline with a downward arrow. Business loss and negative trend concept
Free with trial Growth and decline percent arrow outline icon on black circle. Percentage up and down sign symbol vector. Arrow decrease economy vectors Growth and decline percent arrow outline icon on black circle. Percentage up and down sign symbol
Free with trial Composite 3D photo collage design trend sketch of young lady wow face stand hand hold scissors cut percent arrow earnings market bank. Arrow decrease economy illustrations Composite 3D photo collage design trend sketch of young lady wow face stand hand hold scissors cut percent arrow
Free with trial A modern smartphone displays a stock market candlestick chart with a downward-trending red arrow indicating a significant loss. Several gold coins with dollar signs are scattered around the phone, and a red bell icon with an exclamation mark hovers above, suggesting an alert or warning. A label on the arrow reads "LOSS. Arrow decrease economy illustrations Smartphone Displaying Stock Market Chart with Falling Red Arrow and Gold Coins mobile trading. A modern smartphone displays a stock market candlestick chart with a downward-trending red arrow indicating a significant loss. Several gold coins with dollar signs are scattered around the phone, and a red bell icon with an exclamation mark hovers above, suggesting an alert or warning. A label on the arrow reads "LOSS
Free with trial A sharp red arrow, indicating a downward trend, is superimposed over a thick stack of green dollar bills. The dollar bills are depicted with a subtle texture and the dollar sign. The image is set against a clean white background, emphasizing the concept of financial decline or loss. Arrow decrease economy illustrations Red Downward Arrow Graph Over a Stack of Green Dollar Bills on White Background money finance. A sharp red arrow, indicating a downward trend, is superimposed over a thick stack of green dollar bills. The dollar bills are depicted with a subtle texture and the dollar sign. The image is set against a clean white background, emphasizing the concept of financial decline or loss
Free with trial A financial illustration shows coins decreasing in size along a horizontal axis, representing devaluation. An upward-pointing arrow indicates increasing inflation percentages, with labels of "4%", "20%", and "50%". The chart is labeled "INFLATION" at the top, with percentages scattered around. Broken pieces from a large coin suggest fragmentation and loss of value. The background features a subtle line graph, reinforcing the economic theme. Arrow decrease economy illustrations Inflation increasing and devaluing money, showing a financial chart with coins and an arrow going up. A financial illustration shows coins decreasing in size along a horizontal axis, representing devaluation. An upward-pointing arrow indicates increasing inflation percentages, with labels of "4%", "20%", and "50%". The chart is labeled "INFLATION" at the top, with percentages scattered around. Broken pieces from a large coin suggest fragmentation and loss of value. The background features a subtle line graph, reinforcing the economic theme.
Free with trial Orange arrow pointing downward through clouds towards earth. Global economic downturn visualization. For market analysis and business decline concept. Arrow decrease economy illustrations Orange arrow pointing downward through clouds towards earth. Global economic downturn visualization. For market analysis and business decline concept
Free with trial Creative composite collage of young businesswoman sit stressed pile coins arrow down down bankruptcy earnings business finance investor. Arrow decrease economy illustrations Creative composite collage of young businesswoman sit stressed pile coins arrow down down bankruptcy earnings business
Free with trial Collage image poster illustration retro young guy holding arrow move up rise success among point down career goal challenge template. Arrow decrease economy illustrations Collage image poster illustration retro young guy holding arrow move up rise success among point down career goal
Free with trial A 3D illustration depicts a large white dollar sign centered on a vibrant purple circle. Two smaller white circles are positioned on either side of the purple circle. A green upward-pointing arrow is in the top right circle, signifying growth or increase, while a red downward-pointing arrow is in the bottom left circle, indicating decline or decrease. The composition is set against a clean white. Arrow decrease economy illustrations 3D Dollar Sign with Up and Down Arrows Indicating Financial Growth and Decline on White Background. A 3D illustration depicts a large white dollar sign centered on a vibrant purple circle. Two smaller white circles are positioned on either side of the purple circle. A green upward-pointing arrow is in the top right circle, signifying growth or increase, while a red downward-pointing arrow is in the bottom left circle, indicating decline or decrease. The composition is set against a clean white
Free with trial Red cube with arrow up. Business and market growth concept. Close-up. Arrow decrease economy illustrations Red cube with arrow up. Business and market growth concept
Free with trial Red cube with arrow up. Business and market growth concept. Close-up. Arrow decrease economy illustrations Red cube with arrow up. Business and market growth concept
Free with trial Red cube with arrow up. Business and market growth concept. Close-up. Arrow decrease economy illustrations Red cube with arrow up. Business and market growth concept
Free with trial Red cube with arrow up. Business and market growth concept. Close-up. Arrow decrease economy illustrations Red cube with arrow up. Business and market growth concept
Free with trial Red cube with arrow up. Business and market growth concept. Close-up. Arrow decrease economy illustrations Red cube with arrow up. Business and market growth concept
Free with trial Red cube with arrow up. Business and market growth concept. Close-up. Arrow decrease economy illustrations Red cube with arrow up. Business and market growth concept
Free with trial Red cube with arrow up. Business and market growth concept. Close-up. Arrow decrease economy illustrations Red cube with arrow up. Business and market growth concept
Free with trial Red glossy 3d arrow going down stock icon on white background. Bankruptcy, financial market crash icon for your web site design, logo, app, UI. graph chart downtrend symbol. chart going down sign. Arrow decrease economy vectors Red glossy 3d arrow going down stock icon on white background. Bankruptcy, financial market crash icon for your web site design
Free with trial Trend artwork banner sketch 3d photo collage of loader truck carry wooden cube dollar currency tower arrow decline problem usa. Arrow decrease economy illustrations Trend artwork banner sketch 3d photo collage of loader truck carry wooden cube dollar currency tower arrow decline
Free with trial Percentage arrow up and down icon on circle line. Percent growth and decline sign symbol vector. Arrow decrease economy vectors Percentage arrow up and down icon on circle line. Percent growth and decline sign symbol
Free with trial A striking illustration of an oil pump with a downward-pointing arrow, symbolizing decreasing oil production and potential challenges in the energy sector. Arrow decrease economy vectors Illustration of an oil pump with a downward arrow, , representing the concept of decreasing oil production. A striking illustration of an oil pump with a downward-pointing arrow, symbolizing decreasing oil production and potential challenges in the energy sector
Free with trial This image shows a falling graph behind a diamond, representing the decrease in the value of precious stones. It's suitable for illustrating financial losses. Arrow decrease economy vectors Illustration of a falling graph behind a diamond, symbolizing a decrease in the value of precious stones. This image shows a falling graph behind a diamond, representing the decrease in the value of precious stones. It's suitable for illustrating financial losses
Free with trial Declining bar chart with downward arrow graphic representing economic downturn and financial loss. Arrow decrease economy vectors Declining bar chart with downward arrow graphic representing economic downturn and financial loss
Free with trial Doodle Art of Declining Bar Chart with Arrow Vector Illustration Concept Showing Financial Crisis. Arrow decrease economy vectors Doodle Art of Declining Bar Chart with Arrow Vector Illustration Concept Showing Financial Crisis
Free with trial Creative collage image young man falling down economy business failure rate inflation currency golden coins drawing background. Arrow decrease economy illustrations Creative collage image young man falling down economy business failure rate inflation currency golden coins drawing
Free with trial 3D collage trend artwork composite poster of bag dept arrow down crisis pile coins human legs sit earnings currency market income budget. Arrow decrease economy illustrations 3D collage trend artwork composite poster of bag dept arrow down crisis pile coins human legs sit earnings currency
Free with trial Percent up and down icon on circle line. Percentage arrow growth and decline sign symbol vector. Arrow decrease economy vectors Percent up and down icon on circle line. Percentage arrow growth and decline sign symbol
Free with trial Photo vertical collage picture person holding two arrows up down percentage balance profit increase decrease stress price. Arrow decrease economy illustrations Photo vertical collage picture person holding two arrows up down percentage balance profit increase decrease stress
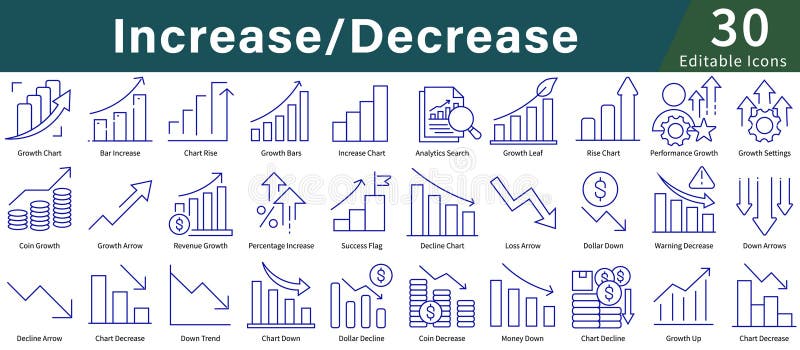
Free with trial Icons illustrating concepts of "Increase Decrease," using simple blue line art. Features include graphs and charts with upward and downward arrows, coins, dollar symbols, and percentage signs. Icons depict growth, decline, analytics, and performance tracking. Suitable for business, finance, or data analysis themes, these icons provide a visual representation of financial trends and statistics, making abstract concepts clear and easily understandable. The design is minimalistic and user-friendly, aimed at enhancing clarity in presentations and reports. Arrow decrease economy vectors Increase Decrease Icon Set in Line Style with Editable Vector for Growth, Analytics, Charts, and Data Visualization. Icons illustrating concepts of "Increase Decrease," using simple blue line art. Features include graphs and charts with upward and downward arrows, coins, dollar symbols, and percentage signs. Icons depict growth, decline, analytics, and performance tracking. Suitable for business, finance, or data analysis themes, these icons provide a visual representation of financial trends and statistics, making abstract concepts clear and easily understandable. The design is minimalistic and user-friendly, aimed at enhancing clarity in presentations and reports.
Free with trial Businessman examines declining company finances using the laptop. Down arrow. Cost Reduction concept. trend modern vector flat illustration. Arrow decrease economy vectors Businessman examines declining company finances using the laptop. Down arrow. Cost Reduction concept.
Free with trial Percent arrow up and down icon on circle line. Percentage growth and decline sign symbol vector. Arrow decrease economy vectors Percent arrow up and down icon on circle line. Percentage growth and decline sign symbol
Free with trial A red graph with a descending arrow. It illustrates decline, loss, or recession. The graph is isolated on a white surface, visually representing negative trends in finance, market, or economy. Perfect for reports. Arrow decrease economy illustrations Red decline graph isolated on white background for financial reports and presentations use cases. A red graph with a descending arrow. It illustrates decline, loss, or recession. The graph is isolated on a white surface, visually representing negative trends in finance, market, or economy. Perfect for reports
Free with trial Stock market trading technical analysis bar chart fall. Business candlestick graph exchange down trend. Crisis economy and investment loss graph. Trader financial index crash concept. Eps banner. Arrow decrease economy vectors Stock market trading technical analysis bar chart fall. Business candlestick graph exchange down trend. Crisis economy
Free with trial Stock market trading technical analysis bar chart fall. Business candlestick graph exchange down trend. Crisis economy and investment loss graph. Trader financial index crash concept. Black background. Arrow decrease economy vectors Stock market trading technical analysis bar chart fall. Business candlestick graph exchange down trend. Crisis economy
Free with trial Stock market trading technical analysis bar chart fall. Business candlestick graph exchange down trend. Crisis economy and investment loss graph. Trader financial index crash concept. Money losing eps. Arrow decrease economy vectors Stock market trading technical analysis bar chart fall. Business candlestick graph exchange down trend. Crisis economy
Free with trial Green cube with arrow up. Business and market growth concept. Close-up. Arrow decrease economy illustrations Green cube with arrow up. Business and market growth concept
Free with trial Green cube with arrow up. Business and market growth concept. Close-up. Arrow decrease economy illustrations Green cube with arrow up. Business and market growth concept
Free with trial Poster sketch image artwork 3D photo collage of worker hr profession business young lady loss money pile coins arrow down reduction crisis. Arrow decrease economy illustrations Poster sketch image artwork 3D photo collage of worker hr profession business young lady loss money pile coins arrow