Free with trial A visual representation of financial decline, economic downturn, or falling percentages. Three green arrows, shaped like a ribbon, are shown descending, each marked with a percentage symbol. The background is a clean, neutral gray, emphasizing the downward trend. Arrow decrease economy illustrations Green arrows with percentage signs pointing downwards symbolizing a decrease in value. A visual representation of financial decline, economic downturn, or falling percentages. Three green arrows, shaped like a ribbon, are shown descending, each marked with a percentage symbol. The background is a clean, neutral gray, emphasizing the downward trend
Free with trial Six red arrows with percent symbols point downward. They are arranged in two rows of three on a white background. Each arrow is three-dimensional, with a bold, white percent sign prominently displayed on the front. The arrows are uniformly spaced, creating a symmetrical and orderly pattern. Arrow decrease economy vectors Six red arrows with percent symbols pointing down on a black background. Six red arrows with percent symbols point downward. They are arranged in two rows of three on a white background. Each arrow is three-dimensional, with a bold, white percent sign prominently displayed on the front. The arrows are uniformly spaced, creating a symmetrical and orderly pattern.
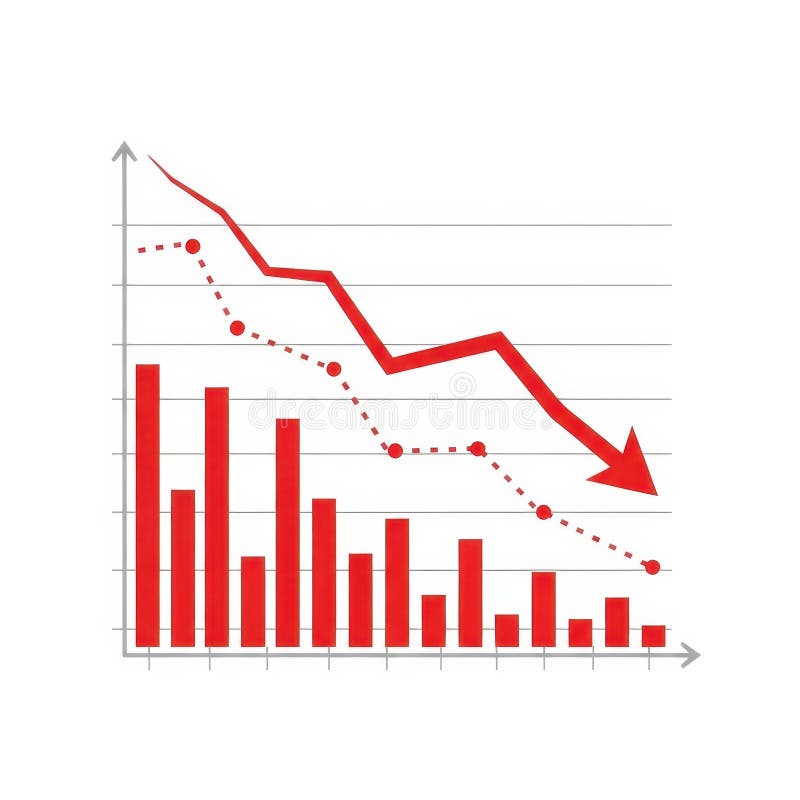
Free with trial Red arrow pointing down and crashing stock market chart representing financial crisis, recession and economic downturn. Arrow decrease economy illustrations Market crash showing economic downturn with falling chart and percentage symbol. Red arrow pointing down and crashing stock market chart representing financial crisis, recession and economic downturn
Free with trial Stock market. The rise and fall of securities. Successful trading. Market trend up green and red down arrows, financial graphs. Business investment growth and loss arrow. Graph going up and down symbol vector illustration. Arrow decrease economy vectors Stock market. The rise and fall of securities. Successful trading. Market trend up green and red down arrows, financial graphs.
Free with trial Stock market. The rise and fall of securities. Successful trading. Market trend up green and red down arrows, financial graphs. Business investment growth and loss arrow. Graph going up and down symbol vector illustration. Arrow decrease economy vectors Stock market. The rise and fall of securities. Successful trading. Market trend up green and red down arrows, financial graphs.
Free with trial Stock market. The rise and fall of securities. Successful trading. Market trend up green and red down arrows, financial graphs. Business investment growth and loss arrow. Graph going up and down symbol vector illustration. Arrow decrease economy vectors Stock market. The rise and fall of securities. Successful trading. Market trend up green and red down arrows, financial graphs.
Free with trial Stock market. The rise and fall of securities. Successful trading. Market trend up green and red down arrows, financial graphs. Business investment growth and loss arrow. Graph going up and down symbol vector illustration. Arrow decrease economy vectors Stock market. The rise and fall of securities. Successful trading. Market trend up green and red down arrows, financial graphs. Business investment growth and
Free with trial Stock market. The rise and fall of securities. Successful trading. Market trend up green and red down arrows, financial graphs. Business investment growth and loss arrow. Graph going up and down symbol vector illustration. Arrow decrease economy vectors Stock market. The rise and fall of securities. Successful trading. Market trend up green and red down arrows, financial graphs.
Free with trial Stock market. The rise and fall of securities. Successful trading. Market trend up green and red down arrows, financial graphs. Business investment growth and loss arrow. Graph going up and down symbol vector illustration. Arrow decrease economy vectors Stock market. The rise and fall of securities. Successful trading. Market trend up green and red down arrows, financial graphs.
Free with trial Wooden blocks spelling COST stand above coins, with white arrows pointing downwards, symbolizing a decrease in expenses. Arrow decrease economy illustrations Cost reduction concept with downward arrows and coins. Wooden blocks spelling COST stand above coins, with white arrows pointing downwards, symbolizing a decrease in expenses
Free with trial This vector illustration shows a set of money bags coins cash and arrows representing finance and business concepts in a simple black style calm professional. Generative AI. Arrow decrease economy vectors Money bag coin stack cash arrow finance business currency icon set vector illustration. This vector illustration shows a set of money bags coins cash and arrows representing finance and business concepts in a simple black style calm professional. Generative AI
Free with trial A downward trending graph line with arrow is featured against a dark night sky filled with stars, suggesting economic downturn. Arrow decrease economy illustrations Decreasing Graph in Night Sky. A downward trending graph line with arrow is featured against a dark night sky filled with stars, suggesting economic downturn
Free with trial A 3D rendering shows a financial graph with a decreasing rate. The pink arrow points downwards, indicating a loss. The bars represent data points in a business or economic context. Arrow decrease economy illustrations Decreasing rate financial graph on white background. A 3D rendering shows a financial graph with a decreasing rate. The pink arrow points downwards, indicating a loss. The bars represent data points in a business or economic context
Free with trial Three stacks of coins, each topped with a wooden block featuring a downward-pointing arrow, illustrating a concept of financial loss, economic downturn, or decreasing value against a blue background. Arrow decrease economy illustrations Decreasing stacks of coins with down arrows symbolizing financial decline. Three stacks of coins, each topped with a wooden block featuring a downward-pointing arrow, illustrating a concept of financial loss, economic downturn, or decreasing value against a blue background
Free with trial A stark visual representation of declining oil prices features several black oil barrels, one of which is tipped over, spilling its dark contents onto a clean white surface. A bold red arrow dramatically descends from the upper left, clearly indicating a downward trend. This composition effectively communicates concepts of economic downturn, market volatility, and financial loss within the energy. Arrow decrease economy illustrations Falling oil prices depicted by spilled oil barrels and a downward trending red arrow on a white background. A stark visual representation of declining oil prices features several black oil barrels, one of which is tipped over, spilling its dark contents onto a clean white surface. A bold red arrow dramatically descends from the upper left, clearly indicating a downward trend. This composition effectively communicates concepts of economic downturn, market volatility, and financial loss within the energy
Free with trial A conceptual image featuring a series of ascending wooden blocks, with a green upward arrow on a lower block and a red downward arrow on a higher block, symbolizing the fluctuating nature of business, market trends, and financial performance. The image conveys concepts of success, failure, progress, and setback in a clear and concise manner. Arrow decrease economy illustrations Wooden Blocks with Up and Down Arrows Representing Business Growth and Decline. A conceptual image featuring a series of ascending wooden blocks, with a green upward arrow on a lower block and a red downward arrow on a higher block, symbolizing the fluctuating nature of business, market trends, and financial performance. The image conveys concepts of success, failure, progress, and setback in a clear and concise manner
Free with trial This vector illustration features a set of two minimalist graphs depicting a significant decline. Each graph includes a downward-sloping line chart with an accompanying filled area, clearly indicating a negative trend. One version is presented in black on a white background, while the other is white on a black background, offering versatile usage. This icon is ideal for illustrating concepts of business loss, economic recession, market downturns, financial crisis, poor performance, or any data showing a decrease. Perfect for presentations, reports, infographics, and web design. Arrow decrease economy vectors Declining Business Graph Icon Set - Negative Trend Chart. This vector illustration features a set of two minimalist graphs depicting a significant decline. Each graph includes a downward-sloping line chart with an accompanying filled area, clearly indicating a negative trend. One version is presented in black on a white background, while the other is white on a black background, offering versatile usage. This icon is ideal for illustrating concepts of business loss, economic recession, market downturns, financial crisis, poor performance, or any data showing a decrease. Perfect for presentations, reports, infographics, and web design.
Free with trial Financial crisis concept. Broken piggy bank and declining chart, loss of money vector concept, bankruptcy, onset of poverty, budget recession, market fall. Bad economy and lower investment costs. Arrow decrease economy vectors Financial crisis concept. Broken piggy bank and declining chart, loss of money vector concept, bankruptcy, onset of
Free with trial This striking image depicts a global oil market decline, featuring barrels and a red arrow, symbolizing economic downturn and financial crisis. Arrow decrease economy illustrations Global oil market decline represented by black barrels and red downward arrow over a world map in dark background. This striking image depicts a global oil market decline, featuring barrels and a red arrow, symbolizing economic downturn and financial crisis
Free with trial A digital illustration representing economic concepts of supply and demand. On the left, a blue arrow points upwards labeled "DEMAND" with a crowd of stylized figures. On the right, a red arrow points downwards labeled "SUPPLY" with another crowd and various business-related icons. The two sides are separated by a glowing energy effect on a dark, futuristic background. Arrow decrease economy illustrations Conceptual illustration of supply and demand with contrasting arrows and crowds. A digital illustration representing economic concepts of supply and demand. On the left, a blue arrow points upwards labeled "DEMAND" with a crowd of stylized figures. On the right, a red arrow points downwards labeled "SUPPLY" with another crowd and various business-related icons. The two sides are separated by a glowing energy effect on a dark, futuristic background
Free with trial Downward arrow, magnifying glass, dollar sign indicate declining trends, financial analysis, revenue downturn. Ideal for business, finance, investment, market trends loss economic study simple. Arrow decrease economy vectors Declining Trends in Business Revenue with Analysis and Financial Focus. Downward arrow, magnifying glass, dollar sign indicate declining trends, financial analysis, revenue downturn. Ideal for business, finance, investment, market trends loss economic study simple
Free with trial Downward arrow, financial document, and money bag with dollar sign highlighting economic loss, cost reduction. Ideal for finance, budgeting, online payment, bankruptcy, savings accounting crisis. Arrow decrease economy vectors Declining Revenue Illustration with Financial Document and Money Bag. Downward arrow, financial document, and money bag with dollar sign highlighting economic loss, cost reduction. Ideal for finance, budgeting, online payment, bankruptcy, savings accounting crisis
Free with trial Paper cutouts Upward red arrow, zigzag green arrow & downward red arrow on pastel background. Arrow decrease economy illustrations Red and green arrows up and. Paper cutouts Upward red arrow, zigzag green arrow & downward red arrow on pastel background
Free with trial Financial stock market chart with falling red arrow and rising green arrow. Business growth and decline concept for economic analysis success failure and investment. Arrow decrease economy vectors Red decreasing and green increasing arrows representing market trend analytics. Financial stock market chart with falling red arrow and rising green arrow. Business growth and decline concept for economic analysis success failure and investment
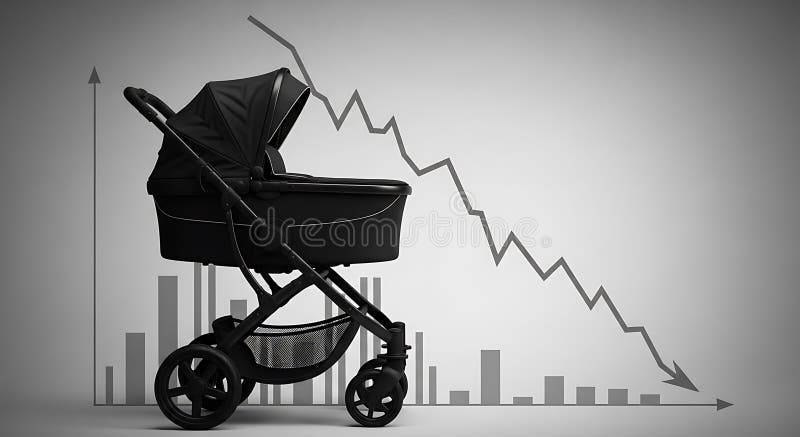
Free with trial A stark visual representation of demographic decline featuring a baby carriage silhouetted against a backdrop of a downward-trending graph and bar charts, symbolizing falling birth rates and. Arrow decrease economy illustrations Demographic Decline Baby Carriage with Downturn Graph and Population Decrease Concept. A stark visual representation of demographic decline featuring a baby carriage silhouetted against a backdrop of a downward-trending graph and bar charts, symbolizing falling birth rates and
Free with trial A conceptual illustration of market analysis featuring a bar chart, magnifying glass, upward and downward arrows, and business icons on white. Arrow decrease economy illustrations Market Analysis Concept with Bar Chart Magnifying Glass and Upward Arrow graph. A conceptual illustration of market analysis featuring a bar chart, magnifying glass, upward and downward arrows, and business icons on white
Free with trial Black and white graph showing a fluctuating trend line with an upward and a downward arrow. Arrow decrease economy illustrations Black and white graph showing fluctuating trend with up and down arrows chart data. Black and white graph showing a fluctuating trend line with an upward and a downward arrow
Free with trial Data Stats Board Display Line Icon Downward Down Trend Statistic Performance Market Decline Economy Downturn Bar Graph Progress Outline Presentation. Arrow decrease economy vectors Data Stats Board Display Line Icon Downward Down Trend Statistic Performance Market Decline Economy Downturn Bar Graph
Free with trial Several white and black arrows point upward at different angles on a light background. One black arrow in the upper right hand corner points downward. Arrow decrease economy illustrations Arrows Indicate Growth Upward, One Arrow Points Downward. Several white and black arrows point upward at different angles on a light background. One black arrow in the upper right hand corner points downward.
Free with trial Stacks of silver coins ascend with a red arrow graph line indicating growth, contrasted by a blue downward arrow and house outlines. Arrow decrease economy illustrations Stacks of coins with rising and falling graph lines and house outlines money finance. Stacks of silver coins ascend with a red arrow graph line indicating growth, contrasted by a blue downward arrow and house outlines
Free with trial Three bright green arrows pointing downwards are displayed side-by-side. Each arrow has a white percentage sign (%) prominently featured on its surface. The arrows have a slightly glossy appearance and are presented against a stark black background, emphasizing their downward trajectory and the concept of reduction or decrease. Arrow decrease economy illustrations Three green downward arrows with percentage signs graphic. Three bright green arrows pointing downwards are displayed side-by-side. Each arrow has a white percentage sign (%) prominently featured on its surface. The arrows have a slightly glossy appearance and are presented against a stark black background, emphasizing their downward trajectory and the concept of reduction or decrease
Free with trial A black line graph with a zigzagging downward trend and an arrow pointing down. Clear details and vibrant colo. Arrow decrease economy illustrations Black line graph showing a sharp downward trend on white background chart decline. A black line graph with a zigzagging downward trend and an arrow pointing down. Clear details and vibrant colo
Free with trial A red and green arrow graph shows a downward trend. The image represents financial loss, economic decline, or a negative market trend. It is a visual representation of a decreasing value. Arrow decrease economy illustrations Red and green arrows pointing downwards on blue background. A red and green arrow graph shows a downward trend. The image represents financial loss, economic decline, or a negative market trend. It is a visual representation of a decreasing value
Free with trial An abstract digital financial chart features multiple vibrant, fluctuating neon lines in blue, green, pink, and white, set against a dark grid background. Prominent red upward and downward arrows, along with a green downward arrow, clearly indicate market trends, growth, and decline. Interspersed geometric shapes connected by lines suggest complex data points and network connections. This dynamic visualization is ideal for illustrating concepts of stock market data, cryptocurrency trends, business analytics, investment volatility, big data, AI, and financial technology, suitable for modern business and tech-related projects. Arrow decrease economy illustrations Digital Financial Data Chart with Fluctuating Lines and Arrows. An abstract digital financial chart features multiple vibrant, fluctuating neon lines in blue, green, pink, and white, set against a dark grid background. Prominent red upward and downward arrows, along with a green downward arrow, clearly indicate market trends, growth, and decline. Interspersed geometric shapes connected by lines suggest complex data points and network connections. This dynamic visualization is ideal for illustrating concepts of stock market data, cryptocurrency trends, business analytics, investment volatility, big data, AI, and financial technology, suitable for modern business and tech-related projects.
Free with trial The background features blurred lights, creating a dramatic effect. financial markets. Arrow decrease economy illustrations A red downward arrow symbolizes a decline in financial markets. The background features blurred lights, creating a dramatic effect. financial markets
Free with trial Up and Down sign with golden arrows isolated on a black, vector illustration. Concept of sales bar chart symbol icon with arrow moving down and sales bar chart with gold arrows moving up and down. Arrow decrease economy vectors Up and Down sign with golden arrows isolated on a black, vector illustration. Concept of sales bar chart symbol
Free with trial A stack of black oil barrels is visually represented with a sharp red downward-trending arrow, symbolizing a significant economic decline or price drop in the oil industry. Arrow decrease economy illustrations Oil barrel decline indicated by red arrow on white background. A stack of black oil barrels is visually represented with a sharp red downward-trending arrow, symbolizing a significant economic decline or price drop in the oil industry
Free with trial A bar chart showing a steady decline with a red downward arrow, symbolizing financial loss, economic downturn, business decline, or negative performance trends. Arrow decrease economy illustrations Economic Downtrend Bar Chart for Business concept 3d Rendering. A bar chart showing a steady decline with a red downward arrow, symbolizing financial loss, economic downturn, business decline, or negative performance trends
Free with trial Four icons depict rising and falling percentage values with arrows and curved lines on a white background. Arrow decrease economy illustrations Arrows indicating percentage increase and decrease in finance. Four icons depict rising and falling percentage values with arrows and curved lines on a white background
Free with trial The image depicts a downward trending line against a dark blue, starry background. the line itself is light blue and appears to be made of or surrounded by tiny particles, giving it a glowing effect. the line zigzags downwards, indicating a decline or loss, and ends with an arrow pointing further down. the overall impression is one of negative growth or a market downturn. Arrow decrease economy illustrations Falling trend line with starry background. the image depicts a downward trending line against a dark blue, starry background. the line itself is light blue and appears to be made of or surrounded by tiny particles, giving it a glowing effect. the line zigzags downwards, indicating a decline or loss, and ends with an arrow pointing further down. the overall impression is one of negative growth or a market downturn.
Free with trial Declining Bar Chart Shows Economic Downturn Illustration Red Arrow Signifies Loss Trend. Arrow decrease economy vectors Declining Bar Chart Shows Economic Downturn Illustration Red Arrow Signifies Loss Trend
Free with trial A visual representation of negative financial performance, illustrating a significant downward trend with a red arrow pointing downwards, indicating a loss or decline in value. Arrow decrease economy illustrations Red graph showing a downward trend isolated on white background. A visual representation of negative financial performance, illustrating a significant downward trend with a red arrow pointing downwards, indicating a loss or decline in value
Free with trial A close-up shot of a hand placing a wooden block with the letter C on top of other blocks spelling COST, with a green downward arrow indicating a decrease or reduction in expenses. Arrow decrease economy illustrations Hand arranging wooden blocks spelling COST with a downward arrow, symbolizing cost reduction. A close-up shot of a hand placing a wooden block with the letter C on top of other blocks spelling COST, with a green downward arrow indicating a decrease or reduction in expenses
Free with trial Line chart tracks data trends over time, with a downward arrow implying decline and a globe representing global impact. Ideal for analytics, performance, global strategy, tracking, economics, market. Arrow decrease economy illustrations Line Chart with Data Points, Downward Arrow, and Globe for Analysis and Global Trends. Line chart tracks data trends over time, with a downward arrow implying decline and a globe representing global impact. Ideal for analytics, performance, global strategy, tracking, economics, market
Free with trial Bar graph showing decreasing values alongside arrows moving toward a minimal cloud. Ideal for data analysis, statistics, regression, performance tracking, economy, analytics, simple flat metaphor. Arrow decrease economy vectors Declining Bar Chart with Arrows and Cloud Representing Regression or Data Flow. Bar graph showing decreasing values alongside arrows moving toward a minimal cloud. Ideal for data analysis, statistics, regression, performance tracking, economy, analytics, simple flat metaphor
Free with trial Three stacks of coins labeled 'OP' and 'OM' are shown with a downward arrow above them, indicating a decrease in value or a financial downturn. Arrow decrease economy illustrations Coins with labels and downward arrow isolated on white background. Three stacks of coins labeled 'OP' and 'OM' are shown with a downward arrow above them, indicating a decrease in value or a financial downturn
Free with trial A paper cutout illustration of two arrows, one red, one green, indicating upward & downward trends. Arrow decrease economy illustrations Stock market growth red arrow outpacing. A paper cutout illustration of two arrows, one red, one green, indicating upward & downward trends
Free with trial Three identical red arrows, each featuring a white percentage symbol (%) prominently displayed, are shown pointing downwards against a black background. The arrows have a slightly rounded, three-dimensional appearance, suggesting a concept of decrease or reduction. This visual could represent sales, discounts, or declining economic indicators. Arrow decrease economy illustrations Three red arrows pointing down with percentage signs. Three identical red arrows, each featuring a white percentage symbol (%) prominently displayed, are shown pointing downwards against a black background. The arrows have a slightly rounded, three-dimensional appearance, suggesting a concept of decrease or reduction. This visual could represent sales, discounts, or declining economic indicators
Free with trial The image shows a rusty, metallic graph depicting a downward trend. the graph is set against a dark, blurred background, possibly an industrial setting, with a reflective surface underneath. the arrow at the end of the graph points downwards, emphasizing the concept of decline or loss. the rust on the metal adds a sense of decay and age, further reinforcing the negative connotation. the lighting highlights the graph, making it the focal point of the image. Arrow decrease economy illustrations Rusty decline: a visual representation of loss. the image shows a rusty, metallic graph depicting a downward trend. the graph is set against a dark, blurred background, possibly an industrial setting, with a reflective surface underneath. the arrow at the end of the graph points downwards, emphasizing the concept of decline or loss. the rust on the metal adds a sense of decay and age, further reinforcing the negative connotation. the lighting highlights the graph, making it the focal point of the image.
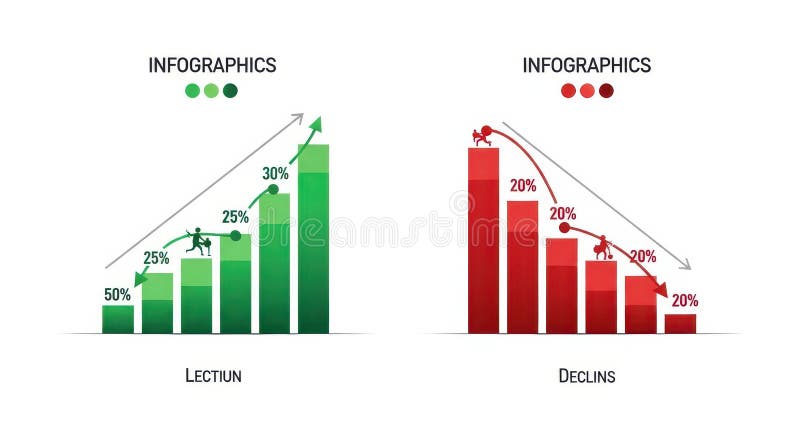
Free with trial The image displays two infographics side by side. the left infographic, titled "lection," depicts a green bar graph showing growth, starting at 50% and increasing to 30% with a figure climbing the bars. an upward-pointing arrow indicates positive growth. the right infographic, titled "declins," shows a red bar graph illustrating decline, starting at 20% and decreasing to 20% with a figure falling down the bars. a downward-pointing arrow indicates negative growth. Arrow decrease economy illustrations Infographics showing growth and decline charts. the image displays two infographics side by side. the left infographic, titled "lection," depicts a green bar graph showing growth, starting at 50% and increasing to 30% with a figure climbing the bars. an upward-pointing arrow indicates positive growth. the right infographic, titled "declins," shows a red bar graph illustrating decline, starting at 20% and decreasing to 20% with a figure falling down the bars. a downward-pointing arrow indicates negative growth.
Free with trial A conceptual image representing financial loss, economic downturn, or business failure. A person's hands are holding and seemingly guiding a glowing red line graph that is pointing sharply downwards. The arrow at the end confirms the negative trend. The neutral background keeps the focus on this clear symbol of decline. Generative AI. Arrow decrease economy illustrations Two hands holding a glowing red line graph that is trending downwards. A conceptual image representing financial loss, economic downturn, or business failure. A person's hands are holding and seemingly guiding a glowing red line graph that is pointing sharply downwards. The arrow at the end confirms the negative trend. The neutral background keeps the focus on this clear symbol of decline. Generative AI.
Free with trial Dollar sign with up and down arrows, capital raising and lowering, decrease or increase interest rates, investment concept - vector. Arrow decrease economy vectors Dollar sign with up and down arrows, capital raising and lowering, decrease or increase interest rates, investment concept
Free with trial A simple red line graph showing a sharp downward trend, indicating a significant decrease or loss in value, isolated against a clean white background for clarity. Arrow decrease economy illustrations Red downward trending graph isolated on white background. A simple red line graph showing a sharp downward trend, indicating a significant decrease or loss in value, isolated against a clean white background for clarity
Free with trial Illustration displays a black graph showing a downward trend indicated by a graph, arrow, and clock symbol on a stark white background, implying a sense of failure and loss. Arrow decrease economy vectors Black Symbol Graph Downtrend with Time on White Backdrop Shows Decline. Illustration displays a black graph showing a downward trend indicated by a graph, arrow, and clock symbol on a stark white background, implying a sense of failure and loss.
Free with trial A visual representation of opposing forces, illustrating concepts such as growth versus decline, positive versus negative trends, or upward and downward movement in various contexts like finance or pe. Arrow decrease economy illustrations Red down arrow and green up arrow isolated on white background. A visual representation of opposing forces, illustrating concepts such as growth versus decline, positive versus negative trends, or upward and downward movement in various contexts like finance or pe
Free with trial Two flat design icons representing financial trends. One shows an upward bar chart with an arrow and percentage symbol, the other a downward bar chart with a percentage symbol. Arrow decrease economy vectors Upward and Downward Bar Chart Icons with Percentage Symbols Ai-Generated. Two flat design icons representing financial trends. One shows an upward bar chart with an arrow and percentage symbol, the other a downward bar chart with a percentage symbol
Free with trial Dramatic red arrow shows oil price drop due to an embargo effect on charts and oil barrels Perfect for financial news and global trade articles. Arrow decrease economy illustrations Illustration of an oil embargo against a backdrop of declining market graphs. Dramatic red arrow shows oil price drop due to an embargo effect on charts and oil barrels Perfect for financial news and global trade articles
Free with trial Three stacks of gold coins, two labeled 'OM' and one labeled 'OP', with a blue arrow pointing downwards towards the center stack, symbolizing financial decline or a decrease in value. Arrow decrease economy illustrations Stacks of coins with an arrow pointing down, isolated on white background. Three stacks of gold coins, two labeled 'OM' and one labeled 'OP', with a blue arrow pointing downwards towards the center stack, symbolizing financial decline or a decrease in value
Free with trial This image visualizes business strategy, featuring a businessman pointing towards interactive displays of "QUALITY" with an upward arrow and "COST" with a downward arrow, representing optimization goals. Arrow decrease economy illustrations A businessman points towards holographic indicators for increasing quality and decreasing cost. This image visualizes business strategy, featuring a businessman pointing towards interactive displays of "QUALITY" with an upward arrow and "COST" with a downward arrow, representing optimization goals.
Free with trial Black And White Vector Illustrations. Stock Price Fall. Arrow On Chart Pointing Down. Bear Head. Stock Market Concept. Arrow decrease economy vectors Bear Market Icons. Black And White Vector Illustrations. Stock Price Fall. Arrow On Chart Pointing Down. Bear Head. Stock Market Concept
Free with trial A bar chart showing a steady decline with a red downward arrow, symbolizing financial loss, economic downturn, business decline, or negative performance trends. Arrow decrease economy illustrations Economic Downtrend Bar Chart for Business concept 3d Rendering. A bar chart showing a steady decline with a red downward arrow, symbolizing financial loss, economic downturn, business decline, or negative performance trends
Free with trial A bar chart showing a steady decline with a red downward arrow, symbolizing financial loss, economic downturn, business decline, or negative performance trends. Arrow decrease economy illustrations Economic Downtrend Bar Chart for Business concept 3d Rendering. A bar chart showing a steady decline with a red downward arrow, symbolizing financial loss, economic downturn, business decline, or negative performance trends
Free with trial A bar chart showing a steady decline with a red downward arrow, symbolizing financial loss, economic downturn, business decline, or negative performance trends. Arrow decrease economy illustrations Economic Downtrend Bar Chart for Business concept 3d Rendering. A bar chart showing a steady decline with a red downward arrow, symbolizing financial loss, economic downturn, business decline, or negative performance trends
Free with trial An icon representing financial downturn, featuring a stack of coins and a line graph with a downward arrow, indicating a decrease in value or performance. This visual signifies economic hardship or in. Arrow decrease economy vectors Graph showing financial decline with coins isolated on transparent background. An icon representing financial downturn, featuring a stack of coins and a line graph with a downward arrow, indicating a decrease in value or performance. This visual signifies economic hardship or in
Free with trial A red grid background displays a financial chart with alternating green and white candlesticks and a prominent white arrow pointing downwards. Arrow decrease economy illustrations Red financial chart with green and white candlesticks showing downward trend. A red grid background displays a financial chart with alternating green and white candlesticks and a prominent white arrow pointing downwards
Free with trial A 3D bar chart with a red arrow indicating a significant downward trend, symbolizing financial loss or economic decline. Isolated on a white background. Arrow decrease economy illustrations Bar chart showing a downward trend isolated on white background. A 3D bar chart with a red arrow indicating a significant downward trend, symbolizing financial loss or economic decline. Isolated on a white background
Free with trial Three red 3D arrows point downward, each featuring a white percentage sign (%) on a flat white surface. The design conveys a theme of decrease or reduction, often associated with discounts or financial downturns. The arrows are evenly spaced, and their bold colors create a striking visual contrast. Arrow decrease economy illustrations Three red arrows with percentage signs pointing downwards on a black background. Three red 3D arrows point downward, each featuring a white percentage sign (%) on a flat white surface. The design conveys a theme of decrease or reduction, often associated with discounts or financial downturns. The arrows are evenly spaced, and their bold colors create a striking visual contrast.
Free with trial This image shows two bar graphs. One shows an upward trend with an arrow pointing up. The other shows a downward trend with an arrow pointing down. Black and white. Arrow decrease economy illustrations Black and white illustration showing upward and downward trending bar graphs with arrows pointing up down. This image shows two bar graphs. One shows an upward trend with an arrow pointing up. The other shows a downward trend with an arrow pointing down. Black and white.
Free with trial A visual representation of financial losses or declining market trends, ideal for economic reports and business analysis presentations. Arrow decrease economy illustrations Bar chart showing a significant decline, emphasized by a red arrow pointing downwards and a magnifying glass. A visual representation of financial losses or declining market trends, ideal for economic reports and business analysis presentations
Free with trial A vibrant image featuring a thick, textured green arrow pointing upwards, symbolizing growth, success, and progress. Contrasting this, a bold red arrow points downwards, representing decline, loss, and failure. Both arrows are rendered with a painterly style, suggesting a hand-drawn or artistic representation of financial or market trends. The clean white background isolates the arrows, emphasizing their symbolic meaning. This visual is ideal for illustrating concepts like stock market fluctuations, business performance, positive and negative trends, or decision-making. Arrow decrease economy illustrations Up and Down Arrows: Growth vs. Decline. A vibrant image featuring a thick, textured green arrow pointing upwards, symbolizing growth, success, and progress. Contrasting this, a bold red arrow points downwards, representing decline, loss, and failure. Both arrows are rendered with a painterly style, suggesting a hand-drawn or artistic representation of financial or market trends. The clean white background isolates the arrows, emphasizing their symbolic meaning. This visual is ideal for illustrating concepts like stock market fluctuations, business performance, positive and negative trends, or decision-making.
Free with trial A simple bar chart and line graph with a downward arrow illustrates a negative trend like recession or business failure ideal for financial reports about crisis or loss. Arrow decrease economy illustrations Declining Blue Bar Chart and Line Graph Showing Financial Loss on Gray Background. A simple bar chart and line graph with a downward arrow illustrates a negative trend like recession or business failure ideal for financial reports about crisis or loss
Free with trial Three wooden blocks display a green up arrow, a black percentage sign, and a red down arrow, symbolizing the concept of fluctuating interest rates, economic changes, and financial market trends. Arrow decrease economy illustrations Interest Rate Fluctuation Concept with Up and Down Arrows and Percentage Sign on Wooden Blocks. Three wooden blocks display a green up arrow, a black percentage sign, and a red down arrow, symbolizing the concept of fluctuating interest rates, economic changes, and financial market trends
Free with trial A 3D illustration depicts a financial chart with a downward trend. Four vertical bars, colored yellow, orange, and green, are arranged in descending order of height, suggesting a decline. To the left, a prominent orange circle contains a white downward-pointing arrow, reinforcing the theme of a negative trend or decrease. The entire composition is set against a plain white background. Arrow decrease economy illustrations Financial chart with downward trend indicator stock market. A 3D illustration depicts a financial chart with a downward trend. Four vertical bars, colored yellow, orange, and green, are arranged in descending order of height, suggesting a decline. To the left, a prominent orange circle contains a white downward-pointing arrow, reinforcing the theme of a negative trend or decrease. The entire composition is set against a plain white background
Free with trial Yellow Money on hand icon isolated on purple background. Palm holds cash with down. Cash salary decrease. Minimalism concept. 3D render illustration. Arrow decrease economy illustrations Yellow Money on hand icon isolated on purple background. Palm holds cash with down. Cash salary decrease. Minimalism
Free with trial A glowing neon blue line graph depicts a steep downward trend with an arrow indicating a significant fall. Arrow decrease economy illustrations Neon blue graph illustrating a sharp decline and downward trend on a dark background. A glowing neon blue line graph depicts a steep downward trend with an arrow indicating a significant fall
Free with trial Dollar icon crossed out with arrow moving away from a digital dashboard featuring charts, graphs, and media content. Ideal for finance, budget management, loss analysis, expense tracking, resource. Arrow decrease economy vectors Money flowing away from online analytics dashboard indicating financial loss or expense tracking. Dollar icon crossed out with arrow moving away from a digital dashboard featuring charts, graphs, and media content. Ideal for finance, budget management, loss analysis, expense tracking, resource
Free with trial A simple bar chart with a falling line, symbolizing financial decline, economic downturn, decreased profits, market loss, or negative business results. Ideal for illustrating risks, challenges, crisis situations, and economic analysis. Arrow decrease economy vectors Declining financial chart icon with downward trend showing loss, decrease and negative business performance. A simple bar chart with a falling line, symbolizing financial decline, economic downturn, decreased profits, market loss, or negative business results. Ideal for illustrating risks, challenges, crisis situations, and economic analysis.
Free with trial Simple line graph illustrating a negative trend, representing a decrease or decline in data. Perfect for presentations, reports, or website design. Arrow decrease economy vectors Downward Trending Line Graph, Showing Negative Growth or Decline. Simple line graph illustrating a negative trend, representing a decrease or decline in data. Perfect for presentations, reports, or website design.
Free with trial A black graph on a white background depicts a sharp downward trend with an arrow indicating further decline. Arrow decrease economy illustrations Black graph showing a downward trend on a white background chart decline. A black graph on a white background depicts a sharp downward trend with an arrow indicating further decline
Free with trial Illustration depicting a financial downturn, featuring stacks of gold coins, a blue bar graph showing a decline, and a red arrow pointing downwards, all set against a white background. Arrow decrease economy illustrations Financial decline with gold coins and bar graph. Illustration depicting a financial downturn, featuring stacks of gold coins, a blue bar graph showing a decline, and a red arrow pointing downwards, all set against a white background