Free with trial Cost reduction icon vector logo set collection or bundle pack group. Arrow decrease economy vectors Cost reduction icon Isolated flat vector in outline. Cost reduction icon vector logo set collection or bundle pack group
Free with trial A graph with a dollar sign. A growing trend. Financial Flat vector illustration isolated on white background. Arrow decrease economy vectors A graph with a dollar sign
Free with trial This is an detailed collection of financial icons depicting various stock market trends, growth curves, and data analysis patterns. Arrow decrease economy vectors Financial data and stock market trend line icons set showing growth and volatility curves. This is an detailed collection of financial icons depicting various stock market trends, growth curves, and data analysis patterns
Free with trial Stacks of coins decreasing in size with red arrows, a black piggy bank, and a declining stock market graph on a light background. Crisis concept. 3D Rendering. Arrow decrease economy illustrations Financial crisis concept with falling coin stacks, red downward arrows, stock market decline graph, and black piggy bank on light. Stacks of coins decreasing in size with red arrows, a black piggy bank, and a declining stock market graph on a light background. Crisis concept. 3D Rendering
Free with trial City buildings with overlaid falling stock charts and red arrows on sunset background, concept of real estate crisis and economic collapse. Arrow decrease economy illustrations Financial chart with red downward graphs and candlestick patterns over city skyline showing real estate market crash at sunset. City buildings with overlaid falling stock charts and red arrows on sunset background, concept of real estate crisis and economic collapse
Free with trial A black and white image showing two currency symbols with arrows indicating rising and falling values, representing financial fluctuations. Arrow decrease economy illustrations Illustration of fluctuating currency values with upward and downward arrows. A black and white image showing two currency symbols with arrows indicating rising and falling values, representing financial fluctuations
Free with trial Statistical Graph Showing Downward Trend in Population Growth and Future Societal Impact. Arrow decrease economy illustrations Statistical Graph Showing Downward Trend in Population Growth and Future Societal Impact
Free with trial The image depicts a hand holding a pen drawing a downward arrow on a jagged line graph, symbolizing a decline or decrease in values. The downward trend is emphasized with a red circle around the hand and pen, drawing attention to the negative movement on the graph. This visual metaphor is often used in financial contexts to illustrate market declines or losses. Arrow decrease economy illustrations Hand drawing a downward trend on a financial graph with a red circle highlight. The image depicts a hand holding a pen drawing a downward arrow on a jagged line graph, symbolizing a decline or decrease in values. The downward trend is emphasized with a red circle around the hand and pen, drawing attention to the negative movement on the graph. This visual metaphor is often used in financial contexts to illustrate market declines or losses
Free with trial Hand-drawn graph showing a market downturn and decline, minimalist representation. Arrow decrease economy vectors Hand-drawn graph showing a market downturn and decline, minimalist representation
Free with trial A black icon depicting stacked coins, upward and downward arrows, and a dollar sign. Arrow decrease economy illustrations Black icon of stacked coins with upward and downward arrows and dollar sign money. A black icon depicting stacked coins, upward and downward arrows, and a dollar sign
Free with trial A black downward trending graph intersects a stack of coins with a dollar sign on a white background. Arrow decrease economy illustrations Black downward trending graph with dollar sign on stacked coins money finance. A black downward trending graph intersects a stack of coins with a dollar sign on a white background
Free with trial A vibrant and diverse set of financial icons, including symbols for money, growth, and profit, as well as various charts and graphs. The icons are colorful and modern, making them perfect for use in business presentations, reports, and marketing materials. The white background provides a clean and neutral space for the icons to stand out, allowing for easy customization and integration into various designs. Arrow decrease economy vectors A collection of colorful financial icons on a white background for business use. A vibrant and diverse set of financial icons, including symbols for money, growth, and profit, as well as various charts and graphs. The icons are colorful and modern, making them perfect for use in business presentations, reports, and marketing materials. The white background provides a clean and neutral space for the icons to stand out, allowing for easy customization and integration into various designs.
Free with trial Modern icon set featuring financial growth and decline symbols for business analysis. Arrow decrease economy vectors Modern icon set featuring financial growth and decline symbols for business analysis
Free with trial Hand drawn bar chart set featuring growth and decline arrows for business analytics. Arrow decrease economy vectors Hand drawn bar chart set featuring growth and decline arrows for business analytics
Free with trial A dramatic red stock market chart showing a significant downturn. it illustrates a financial crisis, economic recession, or a major market crash. a visual representation of loss and investment risk. Arrow decrease economy illustrations Stock market crash financial crisis economic recession downtrend chart red graph business loss investment. a dramatic red stock market chart showing a significant downturn. it illustrates a financial crisis, economic recession, or a major market crash. a visual representation of loss and investment risk.
Free with trial This image shows a calculator with a dollar coin and arrows, symbolizing financial calculations, investments, and accounting on a blue background. Arrow decrease economy vectors Vector art of calculator with dollar coin and arrows indicating financial calculation, isolated on blue background it represents. This image shows a calculator with a dollar coin and arrows, symbolizing financial calculations, investments, and accounting on a blue background
Free with trial This vector illustration shows a financial chart with green bar graphs, arrows indicating downfalls, a dollar coin and money bag. It conveys a financial concept. Arrow decrease economy vectors Financial Chart Showing Market Trends with Dollar Signs and Green Arrows. This vector illustration shows a financial chart with green bar graphs, arrows indicating downfalls, a dollar coin and money bag. It conveys a financial concept.
Free with trial Three bright red arrows pointing downwards, each displaying a white percentage symbol. The objects are presented isolated on a clean white background. Arrow decrease economy illustrations Three red downward arrows with percentage symbols isolated on white background. Three bright red arrows pointing downwards, each displaying a white percentage symbol. The objects are presented isolated on a clean white background
Free with trial Minimalist black and white graphic illustrating opposing directions, ideal for financial reports, business presentations, and decision-making concepts in marketing materials. Arrow decrease economy vectors Up and down arrows on horizontal bar symbolizing market trends and decision making. Minimalist black and white graphic illustrating opposing directions, ideal for financial reports, business presentations, and decision-making concepts in marketing materials
Free with trial Colorful plastic arrows and bars depict market trends showing a clear decline in data. Arrow decrease economy illustrations Colorful plastic arrows and bars depict market trends showing a clear decline in data
Free with trial This is an detailed collection of minimalist line icons representing various business graphs and data trends. Arrow decrease economy vectors Professional business graph and data visualization line icon set for reports. This is an detailed collection of minimalist line icons representing various business graphs and data trends
Free with trial Detailed collection of linear icons representing various business trends, financial growth metrics, and candlestick market data. Arrow decrease economy vectors Financial business graph and chart line icons for data analysis and kpi tracking. detailed collection of linear icons representing various business trends, financial growth metrics, and candlestick market data
Free with trial A bar graph shows a downward trend line and a flame to represent loss on a black background. Arrow decrease economy vectors Burning Losses: Downward Trend Chart with Flame Symbol on Black Background. A bar graph shows a downward trend line and a flame to represent loss on a black background.
Free with trial A close-up image of an orange percentage symbol leaning against a wooden surface. Arrow decrease economy illustrations Increasing Percentage Interest Rate Shown with Stacks of Coins. A close-up image of an orange percentage symbol leaning against a wooden surface.
Free with trial Bar Chart With Arrows Line And Solid Icon Set. Financial Growth And Decline Trend Analysis Symbol Collection. Economic Performance Indicators. Isolated Vector Illustration. Arrow decrease economy vectors Bar Chart With Arrows Line And Solid Icon Set. Financial Growth And Decline Trend Analysis Symbol Collection. Economic
Free with trial Blue Searching for food in trash can on streets outdoors icon isolated on white background. Homelessness and poverty concept. Vector. Arrow decrease economy illustrations Blue Searching for food in trash can on streets outdoors icon isolated on white background. Homelessness and poverty
Free with trial Analyze the crash in the stock market crash. Learn from investment failure mistakes. Assess the damage from the business sector. Experts find the cause of the stock chart fall. Arrow decrease economy vectors Analyze the crash in the stock market crash. Learn from investment failure mistakes. Assess the damage from the business
Free with trial Declining chart icon. Downward staircase trend. Economic crisis symbol. Vector illustration. EPS 10. Arrow decrease economy vectors Declining chart icon. Downward staircase trend. Economic crisis symbol. Vector illustration.
Free with trial Financial chart shows falling market data with red and green candlesticks against a dark background, creating a dramatic effect suitable for investment and economic themed visuals. Arrow decrease economy illustrations Dramatic Financial Chart with Green and Red Candlesticks on Black Background. Financial chart shows falling market data with red and green candlesticks against a dark background, creating a dramatic effect suitable for investment and economic themed visuals
Free with trial Visualize cost reduction with a downward trending graph held in a hand. Illustrates finance, business strategy, and expense management. Shows efficiency and financial planning concepts. Arrow decrease economy illustrations Cost reduction strategy business finance graph chart decreasing costs expense management efficiency concept. Visualize cost reduction with a downward trending graph held in a hand. Illustrates finance, business strategy, and expense management. Shows efficiency and financial planning concepts.
Free with trial Illustration of a dollar symbol surrounded by arrows showing financial movement, investment, and economic flow. Arrow decrease economy vectors Financial Flow: Dollar Symbol with Arrows Indicating Money Movement and Investment. Illustration of a dollar symbol surrounded by arrows showing financial movement, investment, and economic flow.
Free with trial Candlestick stock chart with falling trend line and red textures on dark background, symbolizing financial crisis and economic collapse. 3D Rendering. Arrow decrease economy illustrations Abstract financial chart showing downward trend with red and yellow candlestick graph on dark background illustrating stock market. Candlestick stock chart with falling trend line and red textures on dark background, symbolizing financial crisis and economic collapse. 3D Rendering
Free with trial The image depicts three stacks of gold coins progressively decreasing in height, positioned against a background with a downward-sloping red arrow. This visual metaphorically represents a decline in financial savings, investments, or economic losses over time. The contrast between the coins and the arrow emphasizes the concept of reduction or downturn. Arrow decrease economy illustrations Decline in savings or financial losses represented by diminishing stacks of coins. The image depicts three stacks of gold coins progressively decreasing in height, positioned against a background with a downward-sloping red arrow. This visual metaphorically represents a decline in financial savings, investments, or economic losses over time. The contrast between the coins and the arrow emphasizes the concept of reduction or downturn
Free with trial Illustration of a distressed man in a suit looking at his empty wallet next to a broken piggy bank. A downward-trending bar graph labeled "LOSS" indicates declining numbers from 100 to 25. The setting suggests financial loss or economic difficulty. Red arrows accentuate the theme of decrease. The piggy bank is depicted with cracks, reinforcing the sense of financial downturn. The man's posture and expression highlight concern and frustration. Arrow decrease economy vectors Broke Businessman Holding Empty Wallet Facing Financial Loss and Broken Piggy Bank. Illustration of a distressed man in a suit looking at his empty wallet next to a broken piggy bank. A downward-trending bar graph labeled "LOSS" indicates declining numbers from 100 to 25. The setting suggests financial loss or economic difficulty. Red arrows accentuate the theme of decrease. The piggy bank is depicted with cracks, reinforcing the sense of financial downturn. The man's posture and expression highlight concern and frustration.
Free with trial Illustration features worried blocks stacked with a data chart and arrows pointing up and down, in a flat, graphic style. Arrow decrease economy vectors Worried blocks stacked with data chart and arrows depicting volatile market conditions or economic uncertainty. Illustration features worried blocks stacked with a data chart and arrows pointing up and down, in a flat, graphic style.
Free with trial This conceptual studio photograph shows coins stacked in an increasing bar chart format with upward and downward arrows, ideal for illustrating financial reports, banking services, and investment risks. Arrow decrease economy illustrations Silver coin stacks with green and red arrows showing market volatility studio photo. This conceptual studio photograph shows coins stacked in an increasing bar chart format with upward and downward arrows, ideal for illustrating financial reports, banking services, and investment risks
Free with trial Analyzing Data: Person Presenting Graph Showing Progress and Growth Pointing to Top Data Peak, Achievement Concept. Arrow decrease economy illustrations Analyzing Data: Person Presenting Graph Showing Progress and Growth Pointing to Top Data Peak, Achievement Concept
Free with trial Bankruptcy, businessman sitting listless due to decreasing graphic chart. Arrow decrease economy vectors Bankruptcy, businessman sitting listless due to decreasing graphic chart.
Free with trial Digital smartwatch screen with a percentage symbol and circulating directional arrows. Arrow decrease economy vectors Digital smartwatch screen with a percentage symbol and circulating directional arrows
Free with trial High total cost icon vector image. Thin Outline Vector illustration isolated on background. Arrow decrease economy illustrations High total cost icon vector
Free with trial Bearish stock market, Bear Market and Economic Crisis, Recession or Bubble Burst. concept illustration image. Arrow decrease economy illustrations Bearish stock market, Bear Market and Economic Crisis, Recession or Bubble Burst. concept illustration image
Free with trial The image shows a financial dashboard with a stock price chart, a significant upward trend arrow, and various metrics. The chart indicates a stock price of 1,219 with. Arrow decrease economy illustrations Financial dashboard displaying stock market performance with upward trend indicator. The image shows a financial dashboard with a stock price chart, a significant upward trend arrow, and various metrics. The chart indicates a stock price of 1,219 with
Free with trial A businessman in a blue shirt sits at a desk with a laptop, analyzing financial data with a mix of increasing and decreasing graphs and charts, indicating market trends. Arrow decrease economy illustrations Businessman analyzing financial data on laptop with increasing and decreasing graph. A businessman in a blue shirt sits at a desk with a laptop, analyzing financial data with a mix of increasing and decreasing graphs and charts, indicating market trends
Free with trial Economic Loss icon logo sign vector outline in black and white color. Arrow decrease economy vectors Economic Loss logo sign vector outline. Economic Loss icon logo sign vector outline in black and white color
Free with trial Lower cost icon Vector symbol or sign set collection in black and white outline. Arrow decrease economy vectors Lower cost icon mark in filled style. Lower cost icon Vector symbol or sign set collection in black and white outline
Free with trial Line art bar graph icon set featuring upward and downward trend arrows for business analysis. Arrow decrease economy vectors Line art bar graph icon set featuring upward and downward trend arrows for business analysis
Free with trial Downward Trend Bar Chart Illustration Indicating Decline Or Loss In Business Performance. Arrow decrease economy illustrations Downward Trend Bar Chart Illustration Indicating Decline Or Loss In Business Performance
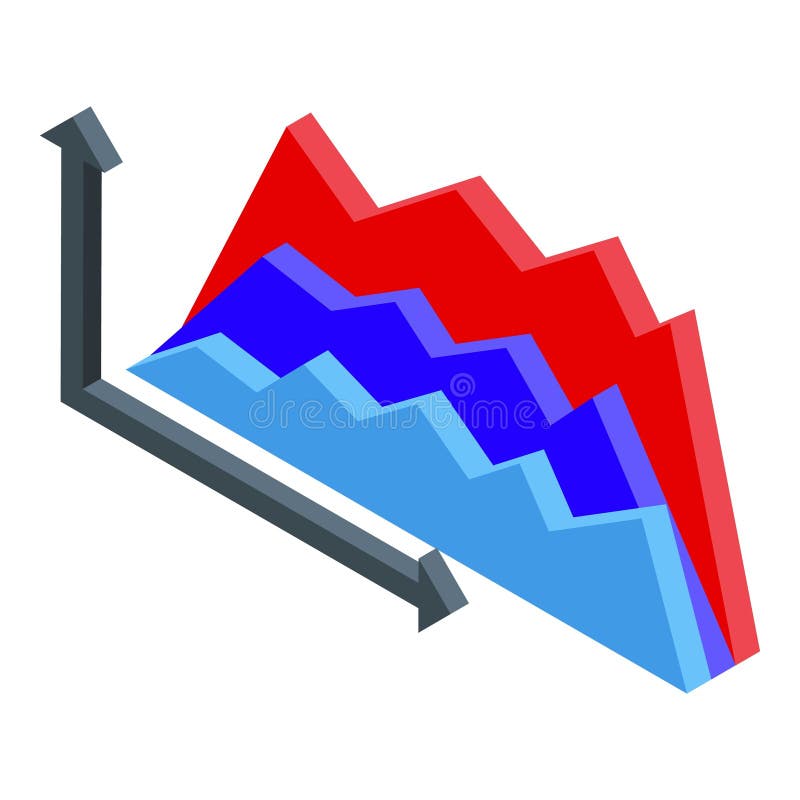
Free with trial Isometric graph showing different trends with ups and downs, concept of trading and business analysis. Arrow decrease economy illustrations Isometric graph showing different trends with ups and downs
Free with trial Line art icon representing financial audit and data analysis of a declining business report. Arrow decrease economy vectors Line art icon representing financial audit and data analysis of a declining business report
Free with trial Black silhouette graph depicting a downward trend with the text "Early Accumulation Zone" below. Arrow decrease economy illustrations Black Silhouette Graph Showing Downward Trend with Text Early Accumulation Zone chart. Black silhouette graph depicting a downward trend with the text "Early Accumulation Zone" below
Free with trial 3D rendering showing falling gold coins and a downward trending graph, symbolizing financial market decline. Arrow decrease economy illustrations Financial Market Decline: Visual Representation of Decreasing Value and Economic Downturn. 3D rendering showing falling gold coins and a downward trending graph, symbolizing financial market decline
Free with trial Illustration depicting a financial downturn with a gold coin, dollar signs, and red arrows on a black background using a flat style. Arrow decrease economy vectors Financial Decline Concept Depicted by Red Arrows and Gold Coin with Dollar Sign. Illustration depicting a financial downturn with a gold coin, dollar signs, and red arrows on a black background using a flat style.
Free with trial A chart with a growing trend. Financial Flat vector illustration isolated on white background. Arrow decrease economy illustrations A graph with a dollar sign. A chart with a growing trend. Financial Flat vector illustration isolated on white background.
Free with trial A boy sits at his desk, staring at a pile of unpaid invoices and declining charts. His face reflects deep concern and stress as he grapples with a significant business loss. Arrow decrease economy illustrations A boy is worried after a loss in business. A boy sits at his desk, staring at a pile of unpaid invoices and declining charts. His face reflects deep concern and stress as he grapples with a significant business loss.
Free with trial Simple graphic illustration of a bar chart depicting a downward trend for business and finance. Arrow decrease economy vectors Simple graphic illustration of a bar chart depicting a downward trend for business and finance
Free with trial Person analyzes growth chart, market trends, financial data, stock exchange, investment portfolio,Generative AI. Arrow decrease economy illustrations Business person analyzes growth charts, market trends, and financial data on an interactive screen. Person analyzes growth chart, market trends, financial data, stock exchange, investment portfolio,Generative AI
Free with trial A boy, troubled by a financial investment downturn, anxiously reviews charts and data on his laptop. His expression reflects concern and stress over potential monetary loss and financial instability. Arrow decrease economy illustrations The boy is worried about loss in financial investment. A boy, troubled by a financial investment downturn, anxiously reviews charts and data on his laptop. His expression reflects concern and stress over potential monetary loss and financial instability.
Free with trial The image depicts a series of red downward arrows of varying sizes, symbolizing percentage changes. The central arrow is the largest and features a percent sign, indicating a significant decline, while the surrounding arrows show smaller decreases. Arrow decrease economy illustrations Graphic illustration of fluctuating percentage changes with prominent central decline. The image depicts a series of red downward arrows of varying sizes, symbolizing percentage changes. The central arrow is the largest and features a percent sign, indicating a significant decline, while the surrounding arrows show smaller decreases
Free with trial The image illustrates a conceptual representation of economic growth juxtaposed with central bank monetary policy. Stacks of gold coins symbolize economic prosperity and wealth, while a green upward arrow indicates growth. In contrast, a red percentage symbol with a slash signifies a reduction in interest rates, often implemented by central banks to stimulate economic activity. The classical. Arrow decrease economy illustrations Economic growth and central bank interest rate adjustments isolated on white background. The image illustrates a conceptual representation of economic growth juxtaposed with central bank monetary policy. Stacks of gold coins symbolize economic prosperity and wealth, while a green upward arrow indicates growth. In contrast, a red percentage symbol with a slash signifies a reduction in interest rates, often implemented by central banks to stimulate economic activity. The classical
Free with trial Hand drawn sale price reduction icon showing cyclical refresh of discounts and special offers. Arrow decrease economy vectors Hand drawn sale price reduction icon showing cyclical refresh of discounts and special offers
Free with trial Three green arrows pointing downwards, each featuring a white percentage sign. This imagery signifies financial decline, price reduction, or decreasing interest rates, often associated with sales or economic trends. Arrow decrease economy illustrations Green downward arrows with percentage signs symbolizing falling prices or interest rates. Three green arrows pointing downwards, each featuring a white percentage sign. This imagery signifies financial decline, price reduction, or decreasing interest rates, often associated with sales or economic trends
Free with trial Laptop Displaying Decreasing Graph, Business Downturn Visualization, Economic Recession Concept. Arrow decrease economy vectors Laptop Displaying Decreasing Graph, Business Downturn Visualization, Economic Recession Concept
Free with trial A businessman looking at financial charts on screen, dark background, cinematic lighting, success concept. Arrow decrease economy illustrations A businessman looking at financial charts on screen, dark background, cinematic lighting, success concept.
Free with trial This is an detailed assembly of essential outline icons for business strategy, data visualization, and planning. Arrow decrease economy vectors Essential business strategy and data visualization tools in professional outline style. This is an detailed assembly of essential outline icons for business strategy, data visualization, and planning
Free with trial This vector illustration shows icons representing financial growth and decline concepts such as profits, losses, success, and failure using coins, arrows, and people with clear black shapes. The style is simple and effective, conveying economic mood. Generative AI. Arrow decrease economy vectors Financial growth decline icons economic success failure money coins profits losses vector illustration. This vector illustration shows icons representing financial growth and decline concepts such as profits, losses, success, and failure using coins, arrows, and people with clear black shapes. The style is simple and effective, conveying economic mood. Generative AI
Free with trial This compelling financial chart vividly illustrates a concerning downward trend in the stock market. The blue grid provides a backdrop for the crucial data visualization, highlighting the negative movement indicated by a prominent red downward arrow. This visual representation underscores the potential for a market crash, prompting investors to carefully analyze market indicators and adjust. Arrow decrease economy illustrations Analyzing a Declining Stock Market Trend Blue Grid Financial Chart Signals a Potential Market Crash. This compelling financial chart vividly illustrates a concerning downward trend in the stock market. The blue grid provides a backdrop for the crucial data visualization, highlighting the negative movement indicated by a prominent red downward arrow. This visual representation underscores the potential for a market crash, prompting investors to carefully analyze market indicators and adjust
Free with trial A flat-style graphic displaying falling stock values, shown by arrows and a graph on a monitor with dollar coins. Arrow decrease economy vectors Stock market decline: Arrows showing a downward trend displayed on a screen with coins. A flat-style graphic displaying falling stock values, shown by arrows and a graph on a monitor with dollar coins.
Free with trial Modern graphic business charts set featuring financial growth and decline for data visualization. Arrow decrease economy vectors Modern graphic business charts set featuring financial growth and decline for data visualization
Free with trial The image depicts stacks of blue Bitcoin coins alongside golden traditional coins, with a purple arrow indicating an upward trend and another red arrow showing a downward trend, symbolizing cryptocurrency market fluctuations and growth potential in the financial sector. Arrow decrease economy illustrations Cryptocurrency and traditional currency coins showing upward market trend with arrows. The image depicts stacks of blue Bitcoin coins alongside golden traditional coins, with a purple arrow indicating an upward trend and another red arrow showing a downward trend, symbolizing cryptocurrency market fluctuations and growth potential in the financial sector
Free with trial Conceptual image of financial loss and economic crisis with glowing red symbols in thick fog generate using AI. Arrow decrease economy illustrations Conceptual image of financial loss and economic crisis with glowing red symbols in thick fog
Free with trial A red line graph showing a downward trend on a white grid background indicating decline or loss. Generative AI. Arrow decrease economy illustrations A red line graph showing a downward trend on a white grid background indicating decline or loss
Free with trial Stylized business chart icon depicting financial growth, percentage, and decline. Flat design, blue outline with light blue fill, minimalistic style. Arrow decrease economy vectors Business chart icon showing growth, percentage, and decline in a simple outlined style. Stylized business chart icon depicting financial growth, percentage, and decline. Flat design, blue outline with light blue fill, minimalistic style.
Free with trial The image shows a hand lifting a stack of wooden blocks, each block featuring a black arrow pointing either upward or downward, symbolizing fluctuations, growth, decline, or market trends. Arrow decrease economy illustrations A hand holding wooden blocks with directional arrows indicating upward and downward trends. The image shows a hand lifting a stack of wooden blocks, each block featuring a black arrow pointing either upward or downward, symbolizing fluctuations, growth, decline, or market trends
Free with trial Vector icon of a bar chart and graph showing a downward trend financial crisis and recession concept. Arrow decrease economy vectors Vector icon of a bar chart and graph showing a downward trend financial crisis and recession concept
Free with trial Simple vector illustration of a computer screen displaying a downward trending graph. Arrow decrease economy vectors Computer screen showing graph going down icon. Simple vector illustration of a computer screen displaying a downward trending graph
Free with trial Hand drawn financial icon set featuring money bags, falling arrows, and coins for economic decline. Arrow decrease economy vectors Hand drawn financial icon set featuring money bags, falling arrows, and coins for economic decline
Free with trial A green line graph shows a downward trend, with arrows indicating the direction. it's a visual representation of decline or loss. Arrow decrease economy illustrations Green line graph showing downward trend with arrows indicating direction on a plain setting. a green line graph shows a downward trend, with arrows indicating the direction. it's a visual representation of decline or loss.
Free with trial Colorful flat design depicts bull and bear market fluctuation. Rising and falling arrows symbolize investment direction with a simple yet informative design. Arrow decrease economy vectors Bull and Bear Market Illustration with Price Fluctuation Indicators on Black Background. Colorful flat design depicts bull and bear market fluctuation. Rising and falling arrows symbolize investment direction with a simple yet informative design.
Free with trial This is an detailed set of clean line icons for infographic design, corporate data analysis, and finance. Arrow decrease economy vectors Clean infographic symbols for corporate data analysis and financial tracking applications. This is an detailed set of clean line icons for infographic design, corporate data analysis, and finance
Free with trial A close-up shot shows a hand placing a wooden cube with a percentage down arrow icon, completing the word 'COST' spelled out on adjacent cubes. This visually represents cost reduction and savings. Arrow decrease economy illustrations Hand adding cube with percentage down symbol to \'cost\' spelling out cost reduction concept. A close-up shot shows a hand placing a wooden cube with a percentage down arrow icon, completing the word 'COST' spelled out on adjacent cubes. This visually represents cost reduction and savings