Free with trial Financial loss in 3d icon illustration of finance theme, use this element to your design. Arrow decrease economy vectors Financial loss in 3d icon illustration of finance theme
Free with trial Dollar price up and down icon on black circle. USD growth and decline sign symbol vector. Arrow decrease economy vectors Dollar price up and down icon on black circle. USD growth and decline sign symbol
Free with trial A striking, minimalist graphic conveying a message of price reduction or a sale. The design features the 3D text "PRICE" in bold, red and pink shades, dramatically positioned above three large, downward-pointing red arrows. The clean, isometric style and high-contrast color palette make this a highly effective visual metaphor for falling prices, perfect for web banners, promotional posters, advertising campaigns, and social media posts related to discounts, sales, and low cost events like Black Friday or clearance. Arrow decrease economy illustrations Price Reduction Graphic with Bold 3D Text and Downward Red Arrows. A striking, minimalist graphic conveying a message of price reduction or a sale. The design features the 3D text "PRICE" in bold, red and pink shades, dramatically positioned above three large, downward-pointing red arrows. The clean, isometric style and high-contrast color palette make this a highly effective visual metaphor for falling prices, perfect for web banners, promotional posters, advertising campaigns, and social media posts related to discounts, sales, and low cost events like Black Friday or clearance.
Free with trial Archive market leadership icon logo sign vector outline in black and white color. Arrow decrease economy vectors Market Leadership and Strategy Icon Inspired by Chess Tactics. Archive market leadership icon logo sign vector outline in black and white color
Free with trial Hand raising a sign that says Rightward Direction drawn using engraving technique. Arrow decrease economy vectors Hand raising a sign that says Rightward Direction COLORED. Hand raising a sign that says Rightward Direction drawn using engraving technique
Free with trial Dollar price up and down icon on black circle. USD coin growth and decline sign symbol vector. Arrow decrease economy vectors Dollar price up and down icon on black circle. USD coin growth and decline sign symbol
Free with trial Collection of thirty charts and graphs icons in line style. Arrow decrease economy vectors Collection of thirty charts and graphs icons in line style
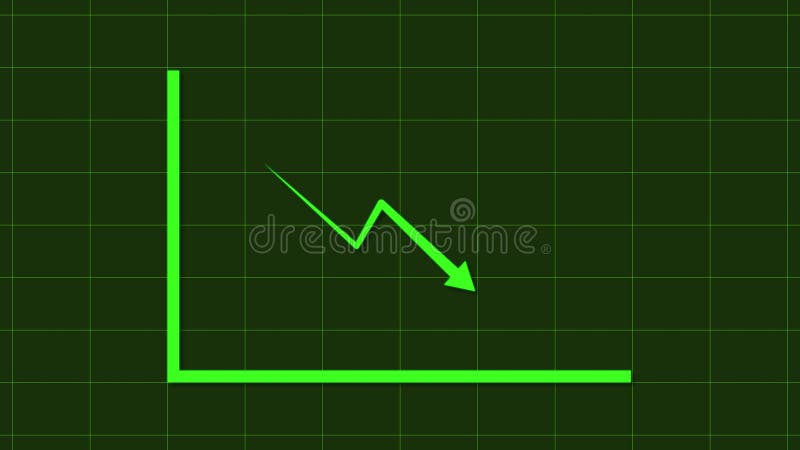
Free with trial A bright green line graph shows a downward trend with a sharp drop, set against a dark, grid-lined background. Arrow decrease economy illustrations Green line graph illustrates sharp decline on a dark grid background. A bright green line graph shows a downward trend with a sharp drop, set against a dark, grid-lined background
Free with trial White jigsaw puzzle with missing piece showing the word 'DEPRECIATION' on a black leather textured background. Arrow decrease economy illustrations White jigsaw puzzle with missing piece showing the word \'DEPRECIATION\'. White jigsaw puzzle with missing piece showing the word 'DEPRECIATION' on a black leather textured background.
Free with trial Reduction chart icon set. Vector symbols in black and white colors. Arrow decrease economy vectors Reduction chart icon
Free with trial A detailed financial chart is presented with numerous vertical bars and multiple overlapping line graphs in blue, white, and orange. Red and green arrows indicate downward and upward movements, respectively, with specific numerical data points displayed. The overall trend shows fluctuations but a general upward trajectory towards the right. Arrow decrease economy illustrations Detailed Financial Chart with Upward and Downward Trends. A detailed financial chart is presented with numerous vertical bars and multiple overlapping line graphs in blue, white, and orange. Red and green arrows indicate downward and upward movements, respectively, with specific numerical data points displayed. The overall trend shows fluctuations but a general upward trajectory towards the right
Free with trial The Economic Recession 3D Icon Render Clipart is a striking design of realistic and professional 3D illustrations that represent key elements of an economic downturn. Arrow decrease economy vectors Economic Recession 3d icon render clipart
Free with trial The Economic Recession 3D Icon Render Clipart is a striking design of realistic and professional 3D illustrations that represent key elements of an economic downturn. Arrow decrease economy vectors Economic Recession 3d icon render clipart
Free with trial The Economic Recession 3D Icon Render Clipart is a striking design of realistic and professional 3D illustrations that represent key elements of an economic downturn. Arrow decrease economy vectors Economic Recession 3d icon render clipart
Free with trial The Economic Recession 3D Icon Render Clipart is a striking design of realistic and professional 3D illustrations that represent key elements of an economic downturn. Arrow decrease economy vectors Economic Recession 3d icon render clipart
Free with trial The Economic Recession 3D Icon Render Clipart is a striking design of realistic and professional 3D illustrations that represent key elements of an economic downturn. Arrow decrease economy vectors Economic Recession 3d icon render clipart
Free with trial Businessman using hammer to nail percentage sign to the floor. Arrow decrease economy vectors Businessman using hammer to nail percentage sign to the floor.
Free with trial Download progress, time running out, sand flowing downward. Simple, clean vector icon. Arrow decrease economy vectors Hourglass Icon Downloading Process, Time Management Symbol. Download progress, time running out, sand flowing downward. Simple, clean vector icon.
Free with trial Percent down icon vector line logo mark or symbol set collection outline style. Arrow decrease economy vectors Percent down icon vector
Free with trial A minimal style of a red down graph of the financial crisis, economic downturn, inflation, recession, bankruptcy, and crisis concept. Businessmen team push to resist a domino effect to stop failure. Arrow decrease economy vectors Businessmen team push to resist a domino effect to stop failure
Free with trial A glowing red arrow depicting a downward trend rests on a blue digital data background illustrating market decline. Arrow decrease economy illustrations Illuminated Red Downward Trend Graph Shows Market Decline. A glowing red arrow depicting a downward trend rests on a blue digital data background illustrating market decline
Free with trial A businessman in a suit points to a red, downward-trending graph, symbolizing financial decline or economic downturn. The image conveys concepts of loss, risk, and market instability. The composition uses a shallow depth of field. Arrow decrease economy illustrations Businessman\'s Hand Pointing Downward on Red Declining Financial Graph. A businessman in a suit points to a red, downward-trending graph, symbolizing financial decline or economic downturn. The image conveys concepts of loss, risk, and market instability. The composition uses a shallow depth of field
Free with trial A businessman's hand gestures towards a red, downward-trending financial graph, symbolizing economic decline. The image conveys concepts of loss, failure, and financial instability. The lighting is soft, with a shallow depth of field. Arrow decrease economy illustrations Businessman\'s Hand Pointing Downward at Red Declining Financial Graph. A businessman's hand gestures towards a red, downward-trending financial graph, symbolizing economic decline. The image conveys concepts of loss, failure, and financial instability. The lighting is soft, with a shallow depth of field
Free with trial A simple black and white illustration of a downward trend graph, showing a decline. The graph is hand-drawn. Arrow decrease economy illustrations Hand-drawn Black Downward Trend Graph on White Background. A simple black and white illustration of a downward trend graph, showing a decline. The graph is hand-drawn
Free with trial This 3D rendering shows a bar graph with a sharp downward trend, symbolized by a large red arrow. The graph visually represents a significant decline or decrease in a particular metric. The dark red bars and bright red arrow create a strong visual impact. Arrow decrease economy illustrations Declining Bar Graph. This 3D rendering shows a bar graph with a sharp downward trend, symbolized by a large red arrow. The graph visually represents a significant decline or decrease in a particular metric. The dark red bars and bright red arrow create a strong visual impact.
Free with trial Abstract digital falling arrows in red light, representing decline, failure, stock crash, inflation, or recession concept for finance, investment, and economic risk analysis. Arrow decrease economy illustrations Red glowing arrows pointing downward with zigzag lines on dark background, symbolizing financial crisis, market crash, negative. Abstract digital falling arrows in red light, representing decline, failure, stock crash, inflation, or recession concept for finance, investment, and economic risk analysis
Free with trial A financial chart illustrating a bearish stock market trend, depicted by a series of red and green candlesticks forming a downward pattern, indicating a potential price decline. Arrow decrease economy illustrations Bearish stock market trend with red and green candlesticks. A financial chart illustrating a bearish stock market trend, depicted by a series of red and green candlesticks forming a downward pattern, indicating a potential price decline
Free with trial Two bar charts, one green showing growth and one red showing decline, with trend lines and arrows. Arrow decrease economy illustrations Bar charts showing upward and downward trends. Two bar charts, one green showing growth and one red showing decline, with trend lines and arrows
Free with trial Falling Bar Chart Graphic Indicating Downward Trend and Loss. Arrow decrease economy vectors Falling Bar Chart Graphic Indicating Downward Trend and Loss
Free with trial Gold coin with arrows pointing up and down, symbolizing the fluctuating nature of money and investments. Arrow decrease economy vectors Gold coin with arrows pointing up and down indicating price fluctuation. Gold coin with arrows pointing up and down, symbolizing the fluctuating nature of money and investments
Free with trial This set of icons shows different aspects of money circulation, investment, financial growth and profit. Arrow decrease economy vectors Money circulation, investment, financial growth and profit flat icons set. This set of icons shows different aspects of money circulation, investment, financial growth and profit
Free with trial A minimal style of a red down chart of the financial crisis, economic downturn, inflation, recession, failure, bankruptcy concept. An emplyee team pulling a tug of war to change graph direction. Arrow decrease economy vectors An emplyee team pulling a tug of war to change graph direction
Free with trial Profit and loss concept. Businessmen run with briefcases on the upward growth and downward recession charts. Arrow decrease economy vectors Profit and loss concept. Businessmen run on the up and down arrows. Profit and loss concept. Businessmen run with briefcases on the upward growth and downward recession charts
Free with trial Businessman success to reduce costs concept vector illustration. Arrow decrease economy vectors Businessman success to reduce costs concept vector illustration
Free with trial Businessman showing graph falling down, geometric pattern. Arrow decrease economy illustrations Falling down of economic activity, geometric pattern. Businessman showing graph falling down, geometric pattern
Free with trial A collection of hand-drawn bar chart icons with upward and downward arrows, representing financial growth and decline. Arrow decrease economy vectors Hand-drawn bar chart with up and down arrows .Vector illustration. A collection of hand-drawn bar chart icons with upward and downward arrows, representing financial growth and decline
Free with trial Down Downward Trend Chart Drop Line Bar Trending Data Statistic Graph Market Share Stock Line Outline Black White Vector Icon Sign Symbol Graphic Artwork. Arrow decrease economy vectors Down Downward Trend Chart Drop Line Bar Trending Data Statistic Graph Market Share Stock Line Outline Black White Vector Icon
Free with trial Set of economic crisis icons. Thin linear style icons Pack. Vector Illustration Outline icons collection. Arrow decrease economy vectors Set of economic crisis icons. Thin linear style icons Pack. Vector Illustration
Free with trial Dollar price up and down outline icon. USD coin growth and decline sign symbol vector. Arrow decrease economy vectors Dollar price up and down outline icon. USD coin growth and decline sign symbol
Free with trial Illustration of a distressed cartoon businessman in a suit holding his head, surrounded by financial symbols, a red graph showing a decline, and currency. Represents financial stress, crisis, and business problems. Arrow decrease economy illustrations Stressed cartoon businessman holding head with financial downturn concept. Illustration of a distressed cartoon businessman in a suit holding his head, surrounded by financial symbols, a red graph showing a decline, and currency. Represents financial stress, crisis, and business problems.
Free with trial Financial business concept going bankrupt flat vector design. design vector illustration. Arrow decrease economy vectors Finance flat concept going bankrupt vector design illustration. financial business concept going bankrupt flat vector design.design vector illustration
Free with trial Profit and loss infographic template. Simple business presentation profit and loss issue. Arrow decrease economy vectors Profit and loss infographic template. Simple business presentation profit and loss issue
Free with trial Falling red arrows intersect with a black digital display board showing financial information, creating a dramatic and concerning mood ideal for illustrating market decline or economic downturn. Arrow decrease economy illustrations Red Arrows Indicating Falling Prices on Digital Display Board. Falling red arrows intersect with a black digital display board showing financial information, creating a dramatic and concerning mood ideal for illustrating market decline or economic downturn
Free with trial A Vector Dollar Up Icon Symbol represents an increase in value, price, or positive movement in financial markets, often associated with economic growth or profit. This symbol is commonly used in financial contexts to indicate a rise in currency value or favorable trends. Arrow decrease economy vectors Vector Dollar Up Icon Symbol
Free with trial The "Vector Dollar Up Icon Symbol" is a graphical representation designed to indicate an increase or upward trend related to financial aspects, specifically involving currency or value. Arrow decrease economy vectors Vector Dollar Up Icon Symbol
Free with trial Quality increase and cost optimization to improve efficiency and profit. Businessman with quality control growth graph and cost reduction, Effective business, Efficient Risk. Arrow decrease economy vectors Quality increase and cost optimization to improve efficiency and profit. Businessman with quality control growth graph and cost
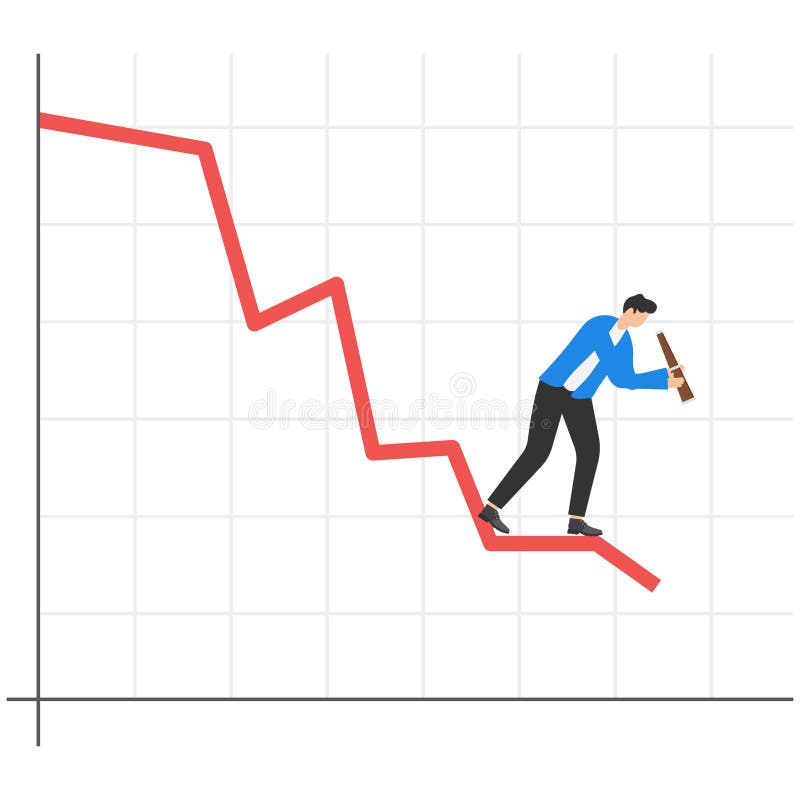
Free with trial Businessman standing on a falling down red graph looks for the bottom. Arrow decrease economy vectors Businessman standing on a falling down red graph looks for the bottom.
Free with trial The business concept of both crisis and recovery. Arrow decrease economy illustrations Business concept of both crisis and recovery
Free with trial Reduction chart icon set in thin line outline style and linear vector sign. Arrow decrease economy vectors Reduction chart icon thin line illustration. Reduction chart icon set in thin line outline style and linear vector sign
Free with trial Profit Icon Line Design Style Simple Business and Financial Vector Perfect Symbol. Arrow decrease economy vectors Profit Icon Line Design Style Simple Business and Financial Vector
Free with trial Reduction chart icon vector line logo mark or symbol set collection outline style. Arrow decrease economy vectors Reduction chart icon thin line illustration. Reduction chart icon vector line logo mark or symbol set collection outline style
Free with trial A minimal style of a red down graph of the financial crisis, economic downturn, inflation, recession, failure, bankruptcy concept. A business team with leader pulls a tug of war to stop domino effect. Arrow decrease economy vectors A business team with leader pulls a tug of war to stop domino effect
Free with trial A cartoon bear in a suit represents a bear market, with a downward trending graph and coins, symbolizing financial loss and economic recession. Arrow decrease economy illustrations Bear Market Illustration - Financial Downturn and Economic Recession. A cartoon bear in a suit represents a bear market, with a downward trending graph and coins, symbolizing financial loss and economic recession
Free with trial Vibrant 3D render of a glowing neon blue gauge with up and down arrows on a bright green background. Symbolizing progress, change, data, or status measurement. Arrow decrease economy illustrations Glowing Neon Blue Gauge with Up and Down Arrows on Vibrant Green. Vibrant 3D render of a glowing neon blue gauge with up and down arrows on a bright green background. Symbolizing progress, change, data, or status measurement
Free with trial Business banner red, decreasing pointing down red and black arrows business composition on red backdrop banner. Arrow decrease economy vectors Business banner red, decreasing pointing down red and black arrows business composition
Free with trial A Vector Dollar Down Icon Symbol represents a decline in value or price, commonly associated with financial markets or economic trends. It is designed to visually convey a drop in currency value or downward movement related to money. Arrow decrease economy vectors Vector Dollar Down Icon Symbol
Free with trial Digita blue bar charts descend steadily across a digital grid, illustrating a decline in financial performance and market trends. Downward arrows emphasize loss, negative growth, and economic challenges, while smooth transitions and a tech-inspired layout enhance the visual impact of the data downturn. Arrow decrease economy illustrations Digital blue bar chart with decreasing business concept. Digita blue bar charts descend steadily across a digital grid, illustrating a decline in financial performance and market trends. Downward arrows emphasize loss, negative growth, and economic challenges, while smooth transitions and a tech-inspired layout enhance the visual impact of the data downturn.
Free with trial Economic recovery concept with the line charts. Arrow decrease economy illustrations Economic recovery concept with the line charts
Free with trial Dollar price up and down icon on circle background. USD currency growth and decline sign symbol vector. Arrow decrease economy vectors Dollar price up and down icon on circle background. USD currency growth and decline sign symbol
Free with trial A colorful, stylized, and somewhat whimsical looking percentage sign. The sign is made up of two lines, one of which is green and the other brown. The green line is the top of the sign. Arrow decrease economy vectors A colorful, stylized, and somewhat whimsical looking percentage sign
Free with trial Human showing empty pocket with a decline arrows. Economic recession crisis. No moneyn. Arrow decrease economy illustrations Human showing empty pocket with a decline arrows. Economic recession crisis. No money
Free with trial Human showing empty pocket with a decline arrows. Economic recession crisis. No moneyn. Arrow decrease economy illustrations Human showing empty pocket with a decline arrows. Economic recession crisis. No money
Free with trial A conceptual infographic visually representing the economic trend of rising prices contrasted with falling income, depicted by upward and downward arrows. Arrow decrease economy illustrations Infographic showing rising prices and falling income. A conceptual infographic visually representing the economic trend of rising prices contrasted with falling income, depicted by upward and downward arrows.
Free with trial Digital stock market ticker displaying falling financial data against urban twilight backdrop, highlighting market decline. Arrow decrease economy illustrations Red digital stock market ticker showing decreasing values, located outdoors in a modern city at dusk. Digital stock market ticker displaying falling financial data against urban twilight backdrop, highlighting market decline
Free with trial Barrel oil with stock charts of oil price quotes. Generative AI. Arrow decrease economy illustrations Barrel oil with stock charts of oil price quotes
Free with trial High total cost icon vector image. Thin Outline Vector illustration isolated on background. Arrow decrease economy vectors High total cost icon vector
Free with trial High total cost icon vector image. Thin Outline Vector illustration isolated on background. Arrow decrease economy vectors High total cost icon vector
Free with trial High total cost icon vector image. Thin Outline Vector illustration isolated on background. Arrow decrease economy vectors High total cost icon vector
Free with trial High total cost icon vector image. Thin Outline Vector illustration isolated on background. Arrow decrease economy illustrations High total cost icon vector
Free with trial High total cost icon vector image. Thin Outline Vector illustration isolated on background. Arrow decrease economy vectors High total cost icon vector
Free with trial Businessman falling alongside a descending graph, illustrating the impact of financial crisis and economic downturn. Visual metaphor for loss, risk, and business challenges in the market. Arrow decrease economy illustrations Businessman falling down with a descending graph, financial crisis concept. Businessman falling alongside a descending graph, illustrating the impact of financial crisis and economic downturn. Visual metaphor for loss, risk, and business challenges in the market
Free with trial A hand holding a pen traces a red downward trending stock market chart, symbolizing a bear market or financial downturn. The background shows stock data. Arrow decrease economy illustrations Bear Market Analysis: Hand with Pen Tracing a Declining Stock Chart. A hand holding a pen traces a red downward trending stock market chart, symbolizing a bear market or financial downturn. The background shows stock data
Free with trial Creative 3D illustration of a sad piggy bank with coins and a falling graph, representing a margin call, financial loss, or trading failure in investment markets. Arrow decrease economy illustrations Margin Call Concept with Piggy Bank and Falling Graph Illustration. Creative 3D illustration of a sad piggy bank with coins and a falling graph, representing a margin call, financial loss, or trading failure in investment markets.
Free with trial 3D rendering of a business growth down icon isolated on a white background symbolizing market decline and downward trends. Arrow decrease economy illustrations Business growth down sign UI icon 3D isolated on white. 3D rendering of a business growth down icon isolated on a white background symbolizing market decline and downward trends
Free with trial Worried businessman with financial graph showing sharp decline. Suitable for themes of crisis, loss, economic downturn, investment failure, and recession. Arrow decrease economy vectors Worried businessman with financial graph showing sharp decline. Suitable for themes of crisis, loss, economic downturn, investment
Free with trial A falling graph displayed on an easel, isolated on a white background. The image represents a negative trend, indicating decline in business or finance. Arrow decrease economy vectors Illustration of falling graph on easel isolated on transparent background, showing negative trend. A falling graph displayed on an easel, isolated on a white background. The image represents a negative trend, indicating decline in business or finance
Free with trial Red financial chart with a sharp downward trend indicating a market crash or economic decline. The graph features jagged, descending lines with timestamps labeled on the x-axis as 06 231 and 08 231. The dark background enhances the focus on the bright red line, making the steep drop in value evident. Occasional data points are highlighted with small glowing dots, emphasizing key moments. The overall design conveys a sense of urgency and loss in financial markets. Arrow decrease economy illustrations Dramatic downward trend financial chart illustrating market crash, economic decline, and losses. Red financial chart with a sharp downward trend indicating a. Red financial chart with a sharp downward trend indicating a market crash or economic decline. The graph features jagged, descending lines with timestamps labeled on the x-axis as 06 231 and 08 231. The dark background enhances the focus on the bright red line, making the steep drop in value evident. Occasional data points are highlighted with small glowing dots, emphasizing key moments. The overall design conveys a sense of urgency and loss in financial markets.
Free with trial Sketchy bar graph illustration of financial decline and economic loss. Arrow decrease economy vectors Sketchy bar graph illustration of financial decline and economic loss
Free with trial Percentage reduction target icon with downward and directional arrows. Arrow decrease economy vectors Percentage reduction target icon with downward and directional arrows
Free with trial Woman seated while pointing upward beside a small house and upward-downward arrows. Ideal for real estate, trends, investment, housing market, decision-making, planning, simplified data, simple flat. Arrow decrease economy illustrations Woman Pointing Upward with House and Directional Arrows Indicating Real Estate Trends. Woman seated while pointing upward beside a small house and upward-downward arrows. Ideal for real estate, trends, investment, housing market, decision-making, planning, simplified data, simple flat