Free with trial Graph rating icon outline vector. Growth chart. Money stock color flat. Arrow financial growth decrease vectors Graph rating icon vector flat. Graph rating icon outline vector. Growth chart. Money stock color flat
Free with trial Blue line chart stock market chart falling prices drop down from global economic and financial crisis , red line graph falling down due to low prices and market recession. Arrow financial growth decrease vectors Recession red line chart. Blue line chart stock market chart falling prices drop down from global economic and financial crisis , red line graph falling down due to low prices and market recession
Free with trial Reduction chart icon Vector symbol or sign set collection in black and white outline. Arrow financial growth decrease vectors Decline Chart Icon Illustrating Decrease in Performance, Economic Downturn, and Analytical Data. Reduction chart icon Vector symbol or sign set collection in black and white outline
Free with trial Modern reduction line icon. Premium pictogram isolated on a white background. Vector illustration. Stroke high quality symbol. Decrease icon in modern line style. Arrow financial growth decrease vectors Modern reduction line icon. Vector. Modern reduction line icon. Premium pictogram isolated on a white background. Vector illustration. Stroke high quality symbol. Decrease icon in modern line style
Free with trial Decline stage mobile application banner set. Finance crisis with falling down graph and income decrease. Idea of bancruptcy and business risk. Money loss. Isolated flat vector illustration. Arrow financial growth decrease vectors Decline stage mobile application banner set. Finance crisis
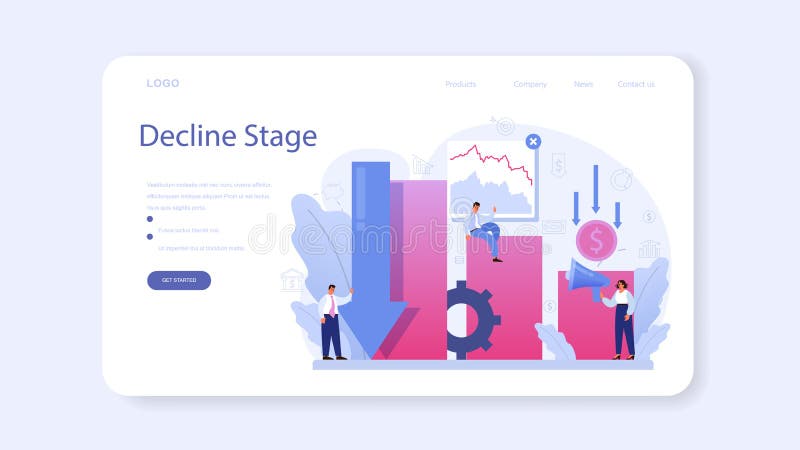
Free with trial Decline stage web banner or landing page set. Finance crisis with falling down graph and income decrease. Idea of bancruptcy and business risk. Money loss. Isolated flat vector illustration. Arrow financial growth decrease illustrations Decline stage web banner or landing page set. Finance crisis
Free with trial 3d chart of stock falling market investment, arrow falling, on red background. Arrow financial growth decrease illustrations 3d chart of stock falling market investment
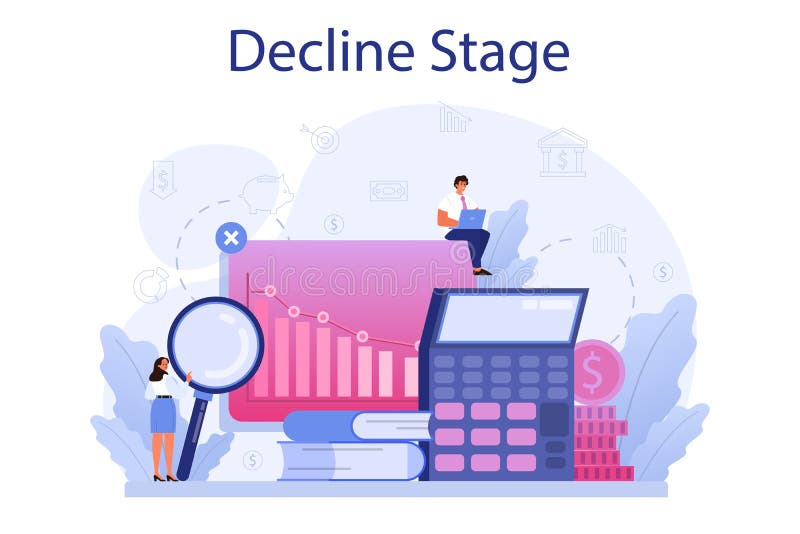
Free with trial Decline stage concept. Finance crisis with falling down graph and income decrease. Idea of bancruptcy and business risk. Money loss. Isolated flat vector illustration. Arrow financial growth decrease vectors Decline stage concept. Finance crisis with falling down graph
Free with trial Decline stage typographic header. Finance crisis with falling down graph and income decrease. Idea of bancruptcy and business risk. Money loss. Isolated flat vector illustration. Arrow financial growth decrease vectors Decline stage typographic header. Finance crisis with falling down graph
Free with trial Down Arrow Icon Symbol Simple Line Style Vector Perfect Web and Mobile Illustration. Arrow financial growth decrease vectors Down Icon Simple Line Style Vector Perfect Web and Mobile Illustration. Down Arrow Icon Symbol Simple Line Style Vector Perfect Web and Mobile Illustration
Free with trial The fall of bitcoin showing in colourful graph with icon. Bitcoin currency symbol with down arrow illustration. Arrow financial growth decrease illustrations The fall of bitcoin showing in colourful graph with icon.
Free with trial Decline stage online service or platform set. Finance crisis with falling down graph and income decrease. Idea of bancruptcy. Online consultation, financing, support. Isolated flat vector illustration. Arrow financial growth decrease vectors Decline stage online service or platform set. Finance crisis
Free with trial Business finance crisis graph fail. cost reduction concept. bag money coin and arrow down. Arrow financial growth decrease vectors Business finance crisis graph fail. cost reduction concept.
Free with trial All of the situation in office, unique life of worker. Arrow financial growth decrease illustrations Standing survive. Businessman running and dispels the financial downturn. Concept business illustration. All of the situation in office, unique life of worker
Free with trial Decline stage web banner or landing page. Finance crisis with falling down graph and income decrease. Idea of bancruptcy and business risk. Money loss. Isolated flat vector illustration. Arrow financial growth decrease vectors Decline stage web banner or landing page. Finance crisis
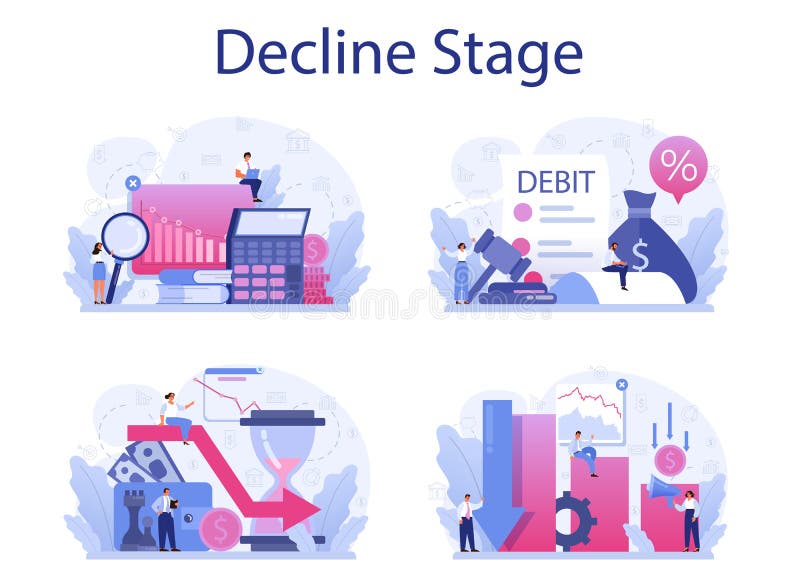
Free with trial Decline stage concept set. Finance crisis with falling down graph and income decrease. Idea of bancruptcy and business risk. Money loss. Isolated flat vector illustration. Arrow financial growth decrease vectors Decline stage concept set. Finance crisis with falling down graph
Free with trial Modern reduction line icon. Premium pictogram isolated on a white background. Vector illustration. Stroke high quality symbol. Decrease icon in modern line style. Arrow financial growth decrease vectors Modern reduction line icon.
Free with trial Modern reduction line icon. Premium pictogram isolated on a white background. Vector illustration. Stroke high quality symbol. Decrease icon in modern line style. Arrow financial growth decrease vectors Modern reduction line icon.
Free with trial Modern reduction line icon. Premium pictogram isolated on a white background. Vector illustration. Stroke high quality symbol. Decrease icon in modern line style. Arrow financial growth decrease vectors Modern reduction line icon.
Free with trial Modern reduction line icon. Premium pictogram isolated on a white background. Vector illustration. Stroke high quality symbol. Decrease icon in modern line style. Arrow financial growth decrease vectors Modern reduction line icon.
Free with trial Modern reduction line icon. Premium pictogram isolated on a white background. Vector illustration. Stroke high quality symbol. Decrease icon in modern line style. Arrow financial growth decrease vectors Modern reduction line icon.
Free with trial Modern reduction line icon. Premium pictogram isolated on a white background. Vector illustration. Stroke high quality symbol. Decrease icon in modern line style. Arrow financial growth decrease vectors Modern reduction line icon.
Free with trial Modern reduction line icon. Premium pictogram isolated on a white background. Vector illustration. Stroke high quality symbol. Decrease icon in modern line style. Arrow financial growth decrease vectors Modern reduction line icon.
Free with trial Modern reduction line icon. Premium pictogram isolated on a white background. Vector illustration. Stroke high quality symbol. Decrease icon in modern line style. Arrow financial growth decrease vectors Modern reduction line icon.
Free with trial Modern reduction line icon. Premium pictogram isolated on a white background. Vector illustration. Stroke high quality symbol. Decrease icon in modern line style. Arrow financial growth decrease vectors Modern reduction line icon.
Free with trial Modern reduction line icon. Premium pictogram isolated on a white background. Vector illustration. Stroke high quality symbol. Decrease icon in modern line style. Arrow financial growth decrease vectors Modern reduction line icon.
Free with trial Modern reduction line icon. Premium pictogram isolated on a white background. Vector illustration. Stroke high quality symbol. Decrease icon in modern line style. Arrow financial growth decrease vectors Modern reduction line icon.
Free with trial Bar chart illustration - financial vector. Arrow financial growth decrease vectors Bar chart illustration – vector. Bar chart illustration - financial vector
Free with trial 3D illustration Background for advertising and wallpaper in trading and market investment scene. 3D rendering in decorative concept. Arrow financial growth decrease illustrations Red Down Arrow 01. 3D illustration Background for advertising and wallpaper in trading and market investment scene. 3D rendering in decorative concept
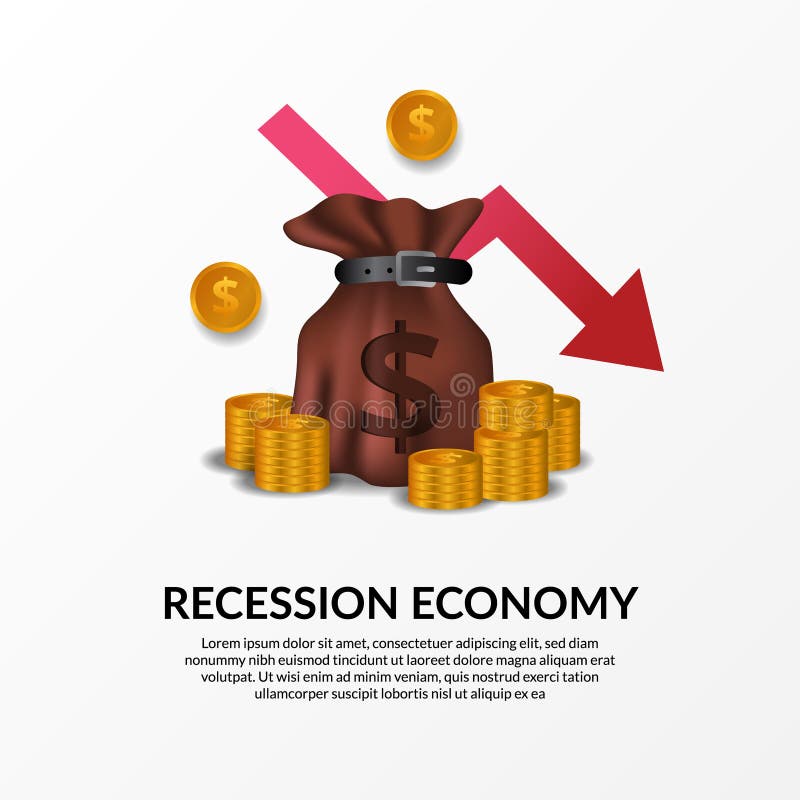
Free with trial Business finance crisis. Global economy recession. Inflation and bankrupt. Market fall and loss income. illustration of money bag, golden money and red bearish arrow. Arrow financial growth decrease vectors Business finance crisis. Global economy recession. Inflation and bankrupt. illustration of money bag, golden money and red bearish. Business finance crisis. Global economy recession. Inflation and bankrupt. Market fall and loss income. illustration of money bag, golden money and red bearish arrow
Free with trial GDP business concept. Word "GDP" Gross domestic product on white cube block near up and down arrows with percentage icon. Business growth and measure for the size of economy compiled for a country. Arrow financial growth decrease illustrations Word \'GDP\' Gross domestic product on white cube block near up and down arrows with percentage icon. GDP business concept. Word "GDP" Gross domestic product on white cube block near up and down arrows with percentage icon. Business growth and measure for the size of economy compiled for a country.
Free with trial Financial crisis concept, impact on global economy and stock markets due to Coronavirus disease. Arrow financial growth decrease vectors Impact on global economy and stock markets due to Coronavirus disease
Free with trial Illustration with graph for finance. With arrows and money, market or finance growth marks. diagram or vector. Arrow financial growth decrease illustrations Illustration with chart for finance, market or currency. illustration with graph for finance. With arrows and money, market or finance growth marks. diagram or vector
Free with trial Decrease icon or logo line art style. Vector Illustration. Arrow financial growth decrease vectors Icon or Logo in modern line style. Decrease icon or logo line art style. Vector Illustration.
Free with trial Graph chart infographic report set with statistic arrow data elements for financial market analysis and planning in business performance research for your illustration. Arrow financial growth decrease vectors Graph chart infographic report set
Free with trial Graph chart infographic report set with statistic arrow data elements for financial market analysis and planning in business performance research for your illustration. Arrow financial growth decrease vectors Graph chart infographic report set
Free with trial Graph chart infographic report set with statistic arrow data elements for financial market analysis and planning in business performance research for your illustration. Arrow financial growth decrease vectors Graph chart infographic report set
Free with trial Graph, Vacancy and Analytics chart signs. Speech bubbles with quotes. Payment exchange, Loan percent and Calculator line icons set. Financial documents, Accounting symbols. Vector. Arrow financial growth decrease vectors Payment exchange, Loan percent and Calculator icons set. Graph, Vacancy and Analytics chart signs. Vector. Graph, Vacancy and Analytics chart signs. Speech bubbles with quotes. Payment exchange, Loan percent and Calculator line icons set. Financial documents, Accounting symbols. Vector
Free with trial Financial crisis concept, impact on global economy and stock markets due to Coronavirus disease. Arrow financial growth decrease vectors Impact on global economy and stock markets due to Coronavirus disease
Free with trial Business finance crisis. Global economy recession. Inflation and bankrupt. Market fall and loss income. illustration of 3d golden money chart and red bearish arrow. Arrow financial growth decrease vectors Business finance crisis. Global economy recession. Inflation and bankrupt. illustration of 3d golden money chart and red bearish. Business finance crisis. Global economy recession. Inflation and bankrupt. Market fall and loss income. illustration of 3d golden money chart and red bearish arrow
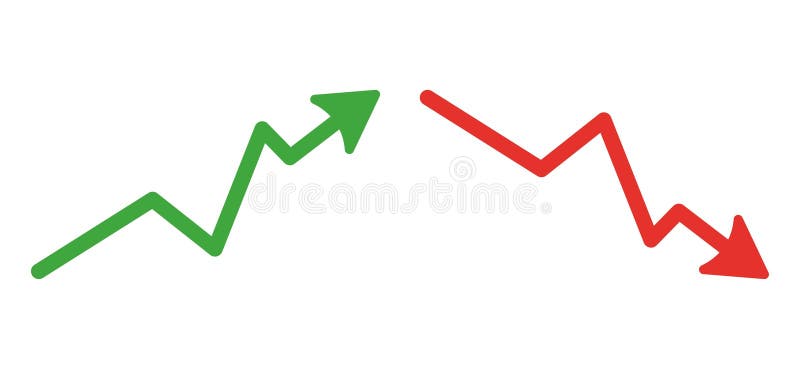
Free with trial Graph going Up and Down sign with green and red arrows vector. Flat design vector illustration concept of sales bar chart symbol icon with arrow moving down and sales bar chart with arrow moving up. Arrow financial growth decrease vectors Graph going Up and Down sign with green and red arrows vector. Flat design vector illustration concept of sales. Graph going Up and Down sign with green and red arrows vector. Flat design vector illustration concept of sales bar chart symbol icon with arrow moving down and sales bar chart with arrow moving up.
Free with trial A minimalist bar chart with a descending line graph overlay, symbolizing financial loss, performance decline, or negative data trends. Ideal for presentations, dashboards, economic reports, and warning visuals. Arrow financial growth decrease vectors Downward Trend Bar Chart Icon. A minimalist bar chart with a descending line graph overlay, symbolizing financial loss, performance decline, or negative data trends. Ideal for presentations, dashboards, economic reports, and warning visuals
Free with trial Decline stage concept. Finance crisis with falling down graph and income decrease. Idea of bancruptcy and business risk. Money loss. Isolated flat vector illustration. Arrow financial growth decrease illustrations Decline stage concept. Finance crisis with falling down graph
Free with trial Two 3D arrows, one red pointing down and one green pointing up, symbolizing contrasting financial trends or data analysis. Visual representation of market fluctuations. Arrow financial growth decrease illustrations Arrow chart up and down on. Two 3D arrows, one red pointing down and one green pointing up, symbolizing contrasting financial trends or data analysis. Visual. Two 3D arrows, one red pointing down and one green pointing up, symbolizing contrasting financial trends or data analysis. Visual representation of market fluctuations
Free with trial This 3D rendering shows a circular arrangement of red arrows pointing downwards, illustrating a negative trend. The image is generated by AI and is perfect for representing concepts like market decline, economic downturn, or loss. Arrow financial growth decrease illustrations Circular Red Downward Arrow. This 3D rendering shows a circular arrangement of red arrows pointing downwards, illustrating a negative trend. The image is generated by AI and is perfect for representing concepts like market decline, economic downturn, or loss.
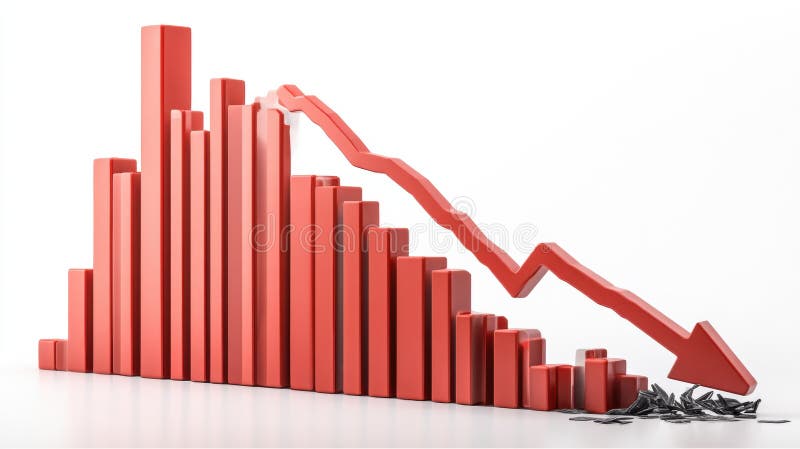
Free with trial A 3D rendering of a bar graph depicting a sharp decline in values. The red bars decrease in size, culminating in a large downward red arrow, symbolizing a significant economic downturn or market crash. The broken pieces at the bottom represent the loss or damage incurred. Arrow financial growth decrease illustrations Red Bar Graph Showing Decline. A 3D rendering of a bar graph depicting a sharp decline in values. The red bars decrease in size, culminating in a large downward red arrow, symbolizing a significant economic downturn or market crash. The broken pieces at the bottom represent the loss or damage incurred.
Free with trial Energy Crisis, Oil, Natural Gas Embargo, Default, Economy Crisis, Bankruptcy, Falling Energy Prices. Decrease in Production Volumes as a Consequence of Energy Crisis. Isometric 3D Vector illustration. Arrow financial growth decrease vectors Energy Crisis, Oil, Natural Gas Embargo, Default, Economy Crisis, Bankruptcy, Falling Energy Prices. Decrease in
Free with trial Sitting sad businessman beside a falling chart and arrow down. Business failure and finance crisis concept. Arrow financial growth decrease vectors Business failure and finance crisis concept.
Free with trial Energy Crisis, Oil, Natural Gas Embargo, Default, Economy Crisis, Man Analyst Controls Energy Prices. Decrease in Production Volumes as Consequence of Energy Crisis. Isometric 3D Vector illustration. Arrow financial growth decrease vectors Energy Crisis, Oil, Natural Gas Embargo, Default, Economy Crisis, Man Analyst Controls Energy Prices. Decrease in
Free with trial A businessman in a suit interacts with a digital interface illustrating the relationship between quality and cost. The image features a visual representation of increasing quality and decreasing cost, with checkmarks indicating positive outcomes. This concept is ideal for illustrating business strategies, efficiency, and financial planning. The scene includes a clipboard with charts, adding a professional context. Arrow financial growth decrease illustrations Quality vs. Cost: Business Concept. A businessman in a suit interacts with a digital interface illustrating the relationship between quality and cost. The image features a visual representation of increasing quality and decreasing cost, with checkmarks indicating positive outcomes. This concept is ideal for illustrating business strategies, efficiency, and financial planning. The scene includes a clipboard with charts, adding a professional context.
Free with trial A close-up shot of wooden blocks arranged to form a small graph, illustrating an interest rate. The blocks are textured and have percentage symbols and directional arrows carved into them. The image has a dark, moody feel and evokes concepts of finance, economics, and growth or decline. Arrow financial growth decrease illustrations Wooden blocks interest rate graph. A close-up shot of wooden blocks arranged to form a small graph, illustrating an interest rate. The blocks are textured and have percentage symbols and directional arrows carved into them. The image has a dark, moody feel and evokes concepts of finance, economics, and growth or decline
Free with trial Graph chart, Report document and Contactless payment line icons set. Timeline steps. 360 degrees sign. Growth report, Growth chart, Financial payment. Panoramic view. Technology set. Vector. Arrow financial growth decrease vectors Graph chart, Report document and Contactless payment icons set. 360 degrees sign. Vector. Graph chart, Report document and Contactless payment line icons set. Timeline steps. 360 degrees sign. Growth report, Growth chart, Financial payment. Panoramic view. Technology set. Vector
Free with trial A hand places a Bitcoin into a piggy bank, symbolizing cryptocurrency investment. The upward arrow and growing bar graph illustrate increasing value, a visual representation of potential returns generated by AI. Arrow financial growth decrease illustrations Bitcoin Piggy Bank Savings Growth. A hand places a Bitcoin into a piggy bank, symbolizing cryptocurrency investment. The upward arrow and growing bar graph illustrate increasing value, a visual representation of potential returns generated by AI.
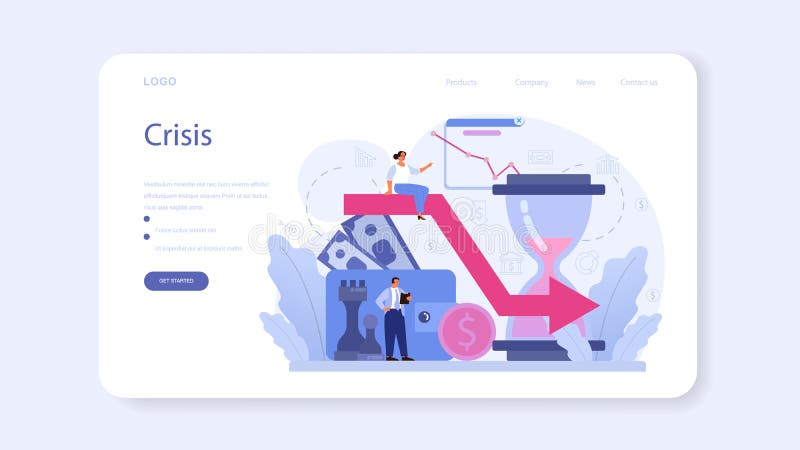
Free with trial Decline stage online service or platform. Finance crisis with falling down graph and income decrease. Idea of bancruptcy. Isolated flat vector illustration. Arrow financial growth decrease illustrations Decline stage online service or platform. Finance crisis
Free with trial Decline stage online service or platform. Finance crisis with falling down graph and income decrease. Idea of bancruptcy. Online support. Isolated flat vector illustration. Arrow financial growth decrease vectors Decline stage online service or platform. Finance crisis
Free with trial Decline stage web banner or landing page. Finance crisis with falling down graph and income decrease. Idea of bancruptcy and business risk. Money loss. Isolated flat vector illustration. Arrow financial growth decrease vectors Decline stage web banner or landing page. Finance crisis
Free with trial Decline stage online service or platform. Finance crisis with falling down graph and income decrease. Idea of bancruptcy. Online consultation. Isolated flat vector illustration. Arrow financial growth decrease vectors Decline stage online service or platform. Finance crisis
Free with trial Decline stage web banner or landing page. Finance crisis with falling down graph and income decrease. Idea of bancruptcy and business risk. Money loss. Isolated flat vector illustration. Arrow financial growth decrease vectors Decline stage web banner or landing page. Finance crisis
Free with trial Decline stage online service or platform. Finance crisis with falling down graph and income decrease. Idea of bancruptcy. Online financing. Isolated flat vector illustration. Arrow financial growth decrease vectors Decline stage online service or platform. Finance crisis
Free with trial Decline stage web banner or landing page. Finance crisis with falling down graph and income decrease. Idea of bancruptcy and business risk. Money loss. Isolated flat vector illustration. Arrow financial growth decrease vectors Decline stage web banner or landing page. Finance crisis
Free with trial A worrying business report showing a sharp decline, generated by AI, rests on a wooden desk in an office setting. The red graph line dramatically falls, symbolizing potential losses or market downturn. This AI-generated image is perfect for illustrating financial instability or economic crisis. Arrow financial growth decrease illustrations Declining Business Graph. A worrying business report showing a sharp decline, generated by AI, rests on a wooden desk in an office setting. The red graph line dramatically falls, symbolizing potential losses or market downturn. This AI-generated image is perfect for illustrating financial instability or economic crisis.
Free with trial Web traffic, Loan percent and Line chart line icons set. Diploma certificate, save planet, group of people. Hot loan, Download arrow and Usd coins signs. Vector. Arrow financial growth decrease vectors Web traffic, Loan percent and Line chart icons set. Hot loan, Download arrow and Usd coins signs. Vector. Web traffic, Loan percent and Line chart line icons set. Diploma certificate, save planet, group of people. Hot loan, Download arrow and Usd coins signs. Vector
Free with trial This is ideal for declining sales and decreasing prices of investment assets. Arrow financial growth decrease vectors Decreasing arrow and bar graph icons. Vector. This is ideal for declining sales and decreasing prices of investment assets.
Free with trial Business crisis refers to a significant, unexpected event or series of events that poses a threat to the operations, reputation, financial stability, or existence of a company. Arrow financial growth decrease illustrations The man siting on Bomb for Business crisis concept 3d rendering. Business crisis refers to a significant, unexpected event or series of events that poses a threat to the operations, reputation, financial stability, or existence of a company
Free with trial Business crisis refers to a significant, unexpected event or series of events that poses a threat to the operations, reputation, financial stability, or existence of a company. Arrow financial growth decrease illustrations The man siting on Bomb for Business crisis concept 3d rendering. Business crisis refers to a significant, unexpected event or series of events that poses a threat to the operations, reputation, financial stability, or existence of a company
Free with trial Business crisis refers to a significant, unexpected event or series of events that poses a threat to the operations, reputation, financial stability, or existence of a company. Arrow financial growth decrease illustrations The man siting on Bomb for Business crisis concept 3d rendering. Business crisis refers to a significant, unexpected event or series of events that poses a threat to the operations, reputation, financial stability, or existence of a company
Free with trial Business crisis refers to a significant, unexpected event or series of events that poses a threat to the operations, reputation, financial stability, or existence of a company. Arrow financial growth decrease illustrations The man siting on Bomb for Business crisis concept 3d rendering. Business crisis refers to a significant, unexpected event or series of events that poses a threat to the operations, reputation, financial stability, or existence of a company
Free with trial High-Quality Vector Icons. Arrow financial growth decrease illustrations Decrease icon vector, filled. High-Quality Vector Icons
Free with trial Touchscreen gesture, Statistics and Dots message line icons set. Web traffic, Scroll down and Audit signs. 3d chart, Startup rocket symbols. Drag drop, Financial report. Technology set. Vector. Arrow financial growth decrease vectors Touchscreen gesture, Statistics and Dots message icons set. Web traffic, Scroll down and Audit signs. Vector. Touchscreen gesture, Statistics and Dots message line icons set. Web traffic, Scroll down and Audit signs. 3d chart, Startup rocket symbols. Drag drop, Financial report. Technology set. Vector
Free with trial Business crisis refers to a significant, unexpected event or series of events that poses a threat to the operations, reputation, financial stability, or existence of a company. Arrow financial growth decrease illustrations The man siting on Bomb for Business crisis concept 3d rendering. Business crisis refers to a significant, unexpected event or series of events that poses a threat to the operations, reputation, financial stability, or existence of a company
Free with trial Downward Trend Financial Graph Illustration. Arrow financial growth decrease vectors Downward Trend Financial Graph Illustration
Free with trial Graph going Up and Down sign with green and red arrows vector. Flat design vector illustration concept of sales bar chart symbol icon with arrow moving down and sales bar chart with arrow moving up. Arrow financial growth decrease vectors Graph going Up and Down sign with green and red arrows vector. Flat design vector illustration concept of sales bar chart symbol. Graph going Up and Down sign with green and red arrows vector. Flat design vector illustration concept of sales bar chart symbol icon with arrow moving down and sales bar chart with arrow moving up.
Free with trial Economic or financial crisis,recession,investment risk,falling currency or stock markets,a businessman is trying to stop the big red arrow pointing down and make efforts to restore the economy. Arrow financial growth decrease vectors A businessman is trying to stop the big red arrow
Free with trial Decline stage concept. Finance crisis with falling down graph and income decrease. Idea of bancruptcy and business risk. Money loss. Isolated flat vector illustration. Arrow financial growth decrease vectors Decline stage concept. Finance crisis with falling down graph
Free with trial Hand with diagram report arrows decrease vector illustration. Arrow financial growth decrease vectors Hand with diagram report
Free with trial Businessman walking carefully on the bar chart for financial concept illustration. Arrow financial growth decrease vectors Businessman Walking Carefully on Bar Chart Concept Illustration. Businessman walking carefully on the bar chart for financial concept illustration
Free with trial Businesswoman analyzes the finances of a company experiencing a decline and tries to return investment with a brilliant idea. Financial Trading And Investing concept. Trend Modern vector flat illustration. Arrow financial growth decrease vectors Businesswoman analyzes the finances of a company experiencing a decline and tries to return investment with a brilliant idea.
Free with trial Graph chart down icon. Down arrow symbol. Flat Vector illustration. Arrow financial growth decrease vectors Finance. Graph chart down icon. Down arrow symbol. Flat Vector illustration
Free with trial Computer monitor with graph arrow outline ui web icon. computer monitor with chart vector icon for web, mobile and user interface design isolated on white background. Arrow financial growth decrease vectors Finance. computer monitor with graph arrow outline ui web icon. computer monitor with chart vector icon for web, mobile and user interface design isolated on white background
Free with trial Energy Crisis, Oil, Natural Gas Embargo And Default, Man And Woman Control Falling Energy Prices. Decrease in Production Volumes as a Consequence of Energy Crisis. Isometric 3D Vector illustration. Arrow financial growth decrease vectors Energy Crisis, Oil, Natural Gas Embargo And Default, Man And Woman Control Falling Energy Prices. Decrease in Production