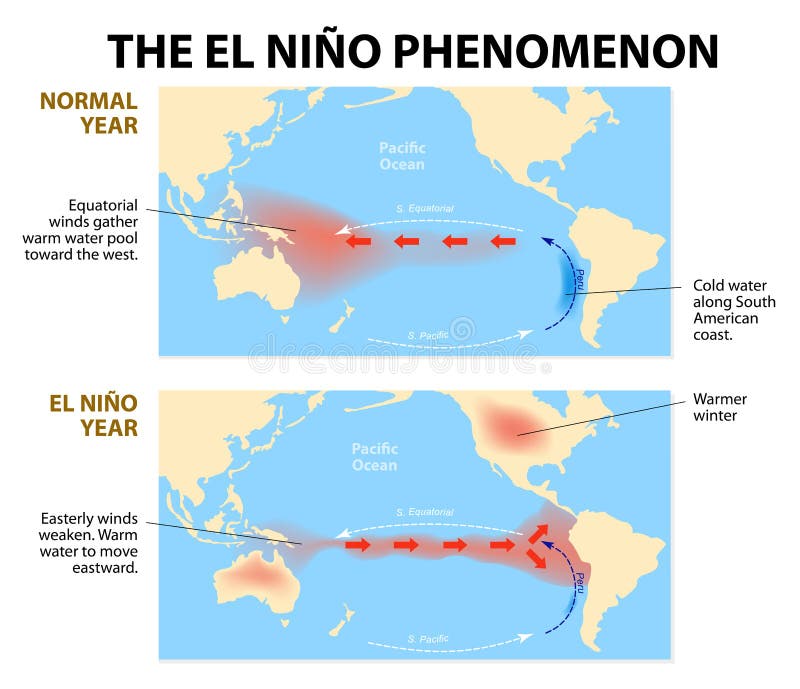
Free with trial Diagram shows the El Nino phenomenon. El Niño is a disruption of the ocean and atmosphere system in the Pacific ocean having important consequences for weather around the globe. Atmospheric circulation vectors El nino phenomenon
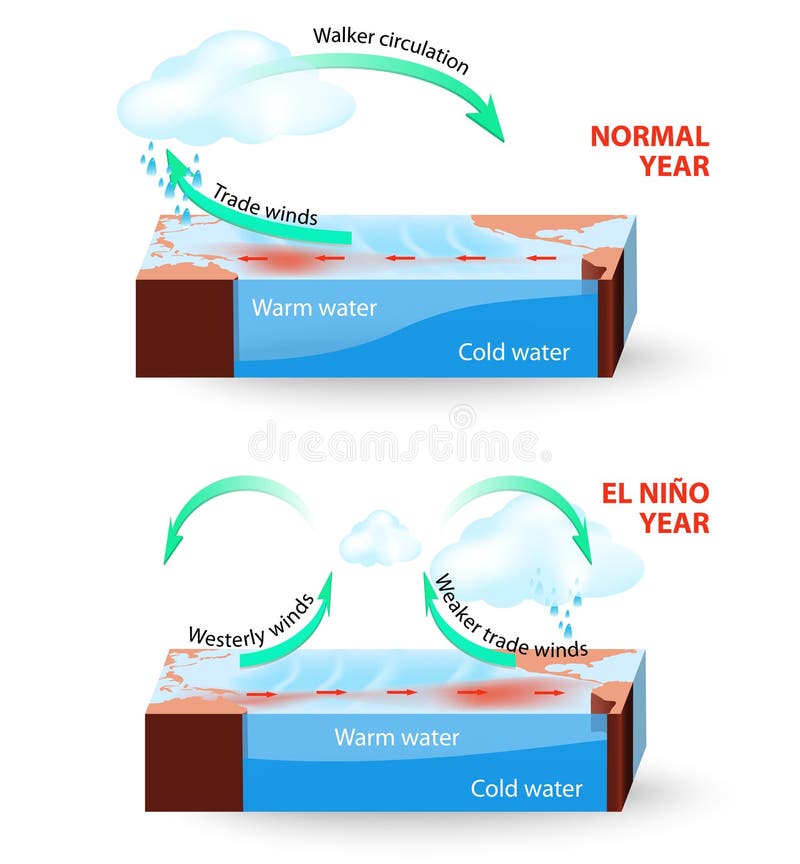
Free with trial El Nino Southern Oscillation (ENSO) is a global phenomenon in ocean and atmosphere. For an unknown reason El Nino events occur irregularly at intervals once every 2-7 years. The effects of El Niño mess up normal winter conditions throughout the Pacific Ocean and change global weather patterns and disrupt fisheries worldwide. Atmospheric circulation vectors Vector infographic. Cross section of El Nino South. El Nino Southern Oscillation (ENSO) is a global phenomenon in ocean and atmosphere. For an unknown reason El Nino events occur irregularly at intervals once every 2-7 years. The effects of El Niño mess up normal winter conditions throughout the Pacific Ocean and change global weather patterns and disrupt fisheries worldwide.
Free with trial Atmospheric front vector illustration diagram with cold and warm front movement scheme. Global earth air circulation. Weather forecasting. Atmospheric circulation vectors Atmospheric front vector illustration diagram with cold and warm front movement scheme
Free with trial During La Niña years, the pool of warm oceanic waters shifts westward. Rainfall increases over Indonesia and the western Pacific region and decreases over the east-central and eastern Pacific Ocean. The climate is drier and colder off the coast of America. Atmospheric circulation vectors La Nina. During La Niña years, the pool of warm oceanic waters shifts westward. Rainfall increases over Indonesia and the western Pacific region and decreases over the east-central and eastern Pacific Ocean. The climate is drier and colder off the coast of America.
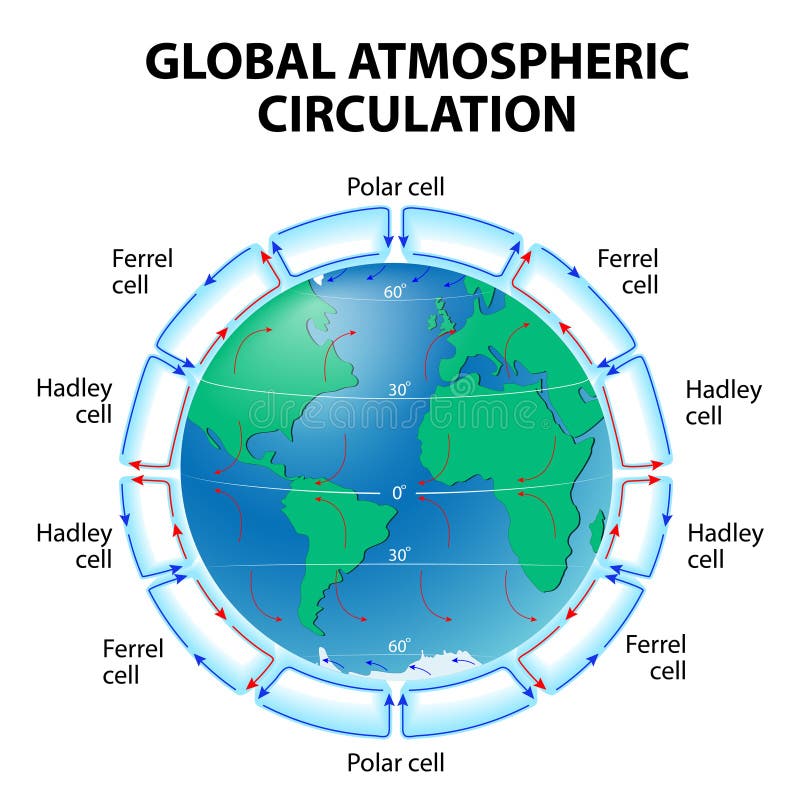
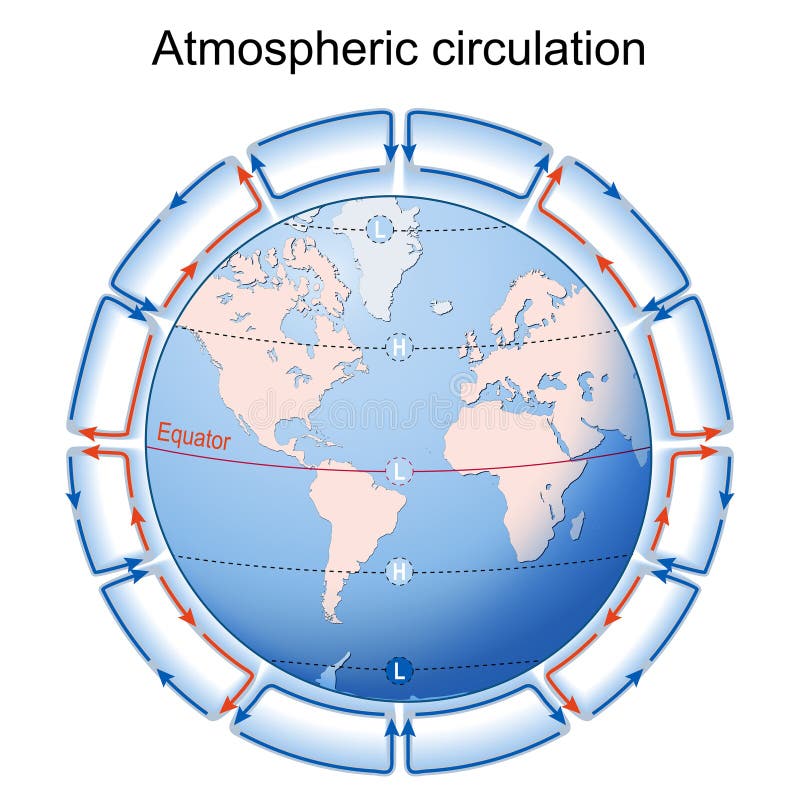
Free with trial Atmospheric circulation vector illustration, meteorology weather scheme. Educational diagram poster with descending and rising air cycles around the globe. Atmospheric circulation vectors Atmospheric circulation geography vector illustration weather scheme. Educational diagram poster. Atmospheric circulation vector illustration, meteorology weather scheme. Educational diagram poster with descending and rising air cycles around the globe.
Free with trial Three (or six) cell model. Atmospheric circulation illustrations Global Atmospheric Circulation. Three (or six) cell model
Free with trial Circulation of Atmosphere. Global circulation patterns or Hadley-Ferrel Model. Atmospheric circulation vectors Circulation of Atmosphere
Free with trial Diagram Illustrating High Pressure (Anticyclone) and Low Pressure (Cyclone). Atmospheric circulation illustrations Cyclone and anticyclone. Diagram Illustrating High Pressure (Anticyclone) and Low Pressure (Cyclone)
Free with trial Anomalous conditions in the equatorial Pacific Ocean. Atmospheric circulation illustrations El Nino Conditions In The Equatorial Pacific Ocean. Anomalous conditions in the equatorial Pacific Ocean.
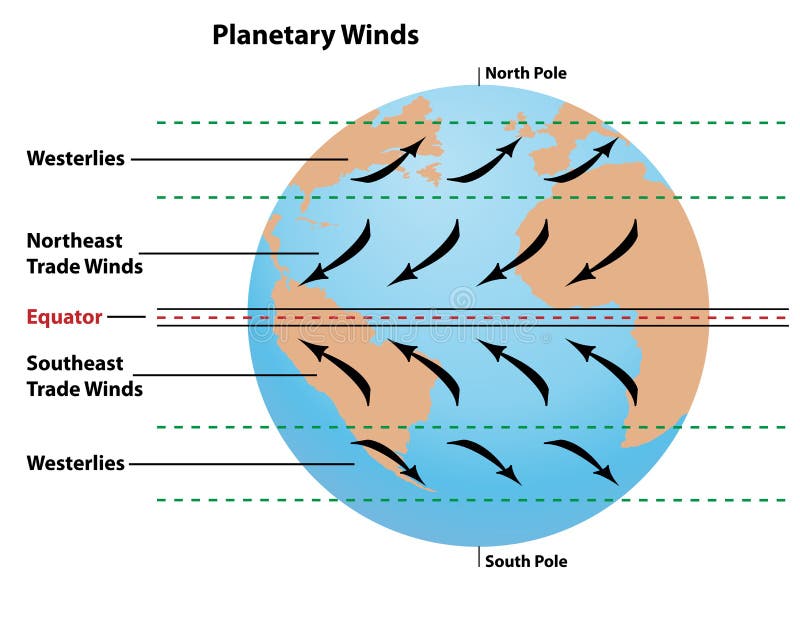
Free with trial Planetary wind directions and atmospheric circulation shown on a map of Earth. The globe shows westerlies, northeast trade winds, southeast trade winds, and the equator. Atmospheric circulation vectors Planetary Wind Directions on Earth. Planetary wind directions and atmospheric circulation shown on a map of Earth. The globe shows westerlies, northeast trade winds, southeast trade winds, and the equator.
Free with trial Nitrogen or N2 cycle with sources and circulation in earth outline diagram. Labeled educational arrow scheme with biochemical gas exchange process vector illustration. Climate ecosystem balance model. Atmospheric circulation vectors Nitrogen or N2 cycle with sources and circulation in earth outline diagram
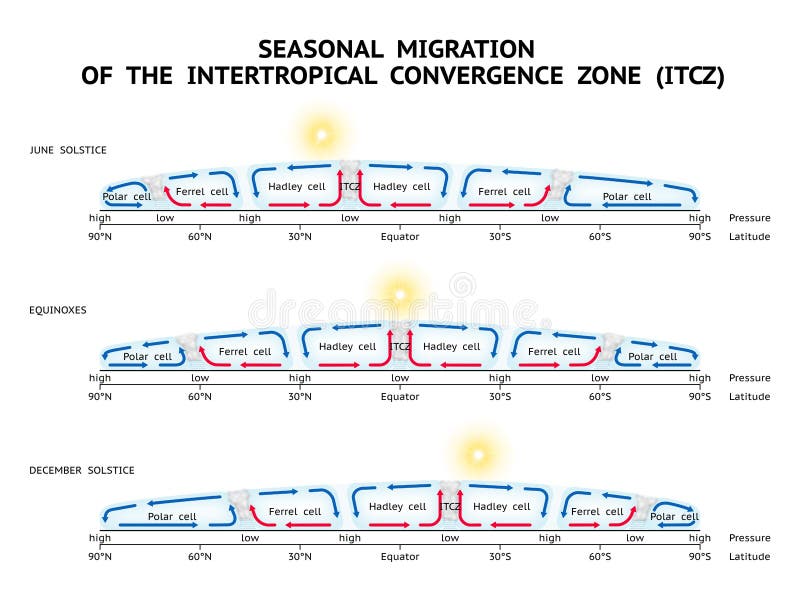
Free with trial Three (or six) cell model. Migration and dynamic of the intertropical convergence zone. Seasonal movement of the global circulation patterns. Atmospheric circulation illustrations Seasonal Migration Of The Intertropical Convergence Zone (ITCZ). Three (or six) cell model. Migration and dynamic of the intertropical convergence zone. Seasonal movement of the global circulation patterns.
Free with trial El Nino and La Nina. Earth globe with continents and arrows that indicating the direction of warm and cold water and winds. Weather, Climate, oceanic and atmospheric phenomenon. vector illustration. Atmospheric circulation vectors El Nino and La Nina. Earth globe with continents and arrows
Free with trial La Nina. world map with continents and arrows that indicating the direction of warm and cold water and winds. Climate, oceanic and atmospheric phenomenon that counterpart of El Nino. vector illustration. Atmospheric circulation vectors La Nina. world map
Free with trial Anomalous conditions in the equatorial Pacific Ocean. Atmospheric circulation illustrations El Nino Modoki Conditions In The Equatorial Pacific Ocean. Anomalous conditions in the equatorial Pacific Ocean.
Free with trial Background concept wordcloud illustration of hurrican cyclone weather. Atmospheric circulation illustrations Hurrican weather background concept. Background concept wordcloud illustration of hurrican cyclone weather
Free with trial Atmospheric circulation diagram shows global wind patterns, Hadley cells, and pressure zones around Earth. Outline diagram. Atmospheric circulation vectors Atmospheric circulation diagram shows global wind patterns, Hadley cells, and ... Atmospheric circulation diagram shows global wind patterns, Hadley cells, and pressure zones around Earth. Outline diagram
Free with trial The illustration of atmospheric circulation background. Atmospheric circulation vectors Atmospheric circulation
Free with trial Atmospheric circulation on Earth. surface winds on planet. Circulation of Atmosphere. Global circulation patterns or Hadley-Ferrel Model. Vector illustration. Atmospheric circulation vectors Atmospheric circulation on Earth. surface winds
Free with trial Weather patterns icons outline depicting global circulation, atmospheric dynamics, and high-altitude winds. Outline icons set. Atmospheric circulation vectors Weather patterns icons outline depicting global circulation, atmospheric dynamics, and ... Weather patterns icons outline depicting global circulation, atmospheric dynamics, and high-altitude winds. Outline icons set.
Free with trial Atmospheric cold front vector illustration diagram with front movement scheme. Global earth air circulation. Weather forecasting. Atmospheric circulation vectors Atmospheric cold front vector illustration diagram with front movement scheme. Global earth air circulation. Weather
Free with trial Global wind circulation patterns show the movement of air in Hadley, Ferrel, and Polar cells with arrows and jet streams. Outline diagram. Atmospheric circulation vectors Global wind circulation patterns show the movement of air in ... Global wind circulation patterns show the movement of air in Hadley, Ferrel, and Polar cells with arrows and jet streams. Outline diagram
Free with trial Cyclone and anticyclone. meteorology and weather phenomenon. cyclone is a large air mass that rotates around a strong center of low atmospheric pressure. Anticyclone is circulation of winds around a central region of high atmospheric pressure. Atmospheric circulation vectors Cyclone and anticyclone. meteorology and weather phenomenon
Free with trial Cyclone and anticyclone. meteorology and weather phenomenon. In cyclone air mass rotates around a strong center of low atmospheric pressure. Anticyclone is circulation of winds around a central region of high pressure. Vector illustration. Atmospheric circulation vectors Cyclone and anticyclone. meteorology and weather
Free with trial Cyclone and anticyclone difference. Atmospheric pressure. Meteorology. Weather phenomenon. Vector illustration. Atmospheric circulation vectors Cyclone and anticyclone difference
Free with trial El Nino. world map with continents and arrows that indicating the direction of warm and cold water and winds. Weather, Climate, oceanic and atmospheric phenomenon. vector illustration. Atmospheric circulation vectors El Nino. world map
Free with trial Illustration showing the difference between a cyclone and an anticyclone. Depicts air circulation patterns, pressure systems, and wind directions. Useful for educational, meteorological, and scientific contexts. Atmospheric circulation vectors Cyclone and anticyclone illustration. Illustration showing the difference between a cyclone and an anticyclone. Depicts air circulation patterns, pressure systems, and wind directions. Useful for educational, meteorological, and scientific contexts.
Free with trial World map illustrating global wind patterns and ocean currents. Land is depicted in earthy tones, with ocean currents shown as swirling blue lines. Wind intensity is categorized and highlighted with shaded regions over oceans, suggesting the direction and strength of atmospheric movement. The visualization provides a comprehensive overview of how air and water circulate around the Earth's surface, emphasizing major current paths and wind patterns. Atmospheric circulation illustrations Global wind patterns and ocean currents visualized on a world map, highlighting wind intensity and oceanic flow. World map illustrating global wind patterns and ocean currents. Land is depicted in earthy tones, with ocean currents shown as swirling blue lines. Wind intensity is categorized and highlighted with shaded regions over oceans, suggesting the direction and strength of atmospheric movement. The visualization provides a comprehensive overview of how air and water circulate around the Earth's surface, emphasizing major current paths and wind patterns.
Free with trial Anomalous conditions in the equatorial Pacific Ocean. Atmospheric circulation illustrations Normal Conditions In The Equatorial Pacific Ocean. Anomalous conditions in the equatorial Pacific Ocean.
Free with trial Anomalous conditions in the equatorial Pacific Ocean. Atmospheric circulation illustrations La Nina Conditions In The Equatorial Pacific Ocean. Anomalous conditions in the equatorial Pacific Ocean.
Free with trial Anomalous conditions in the equatorial Pacific Ocean. Atmospheric circulation illustrations La Nina Modoki Conditions In The Equatorial Pacific Ocean. Anomalous conditions in the equatorial Pacific Ocean.
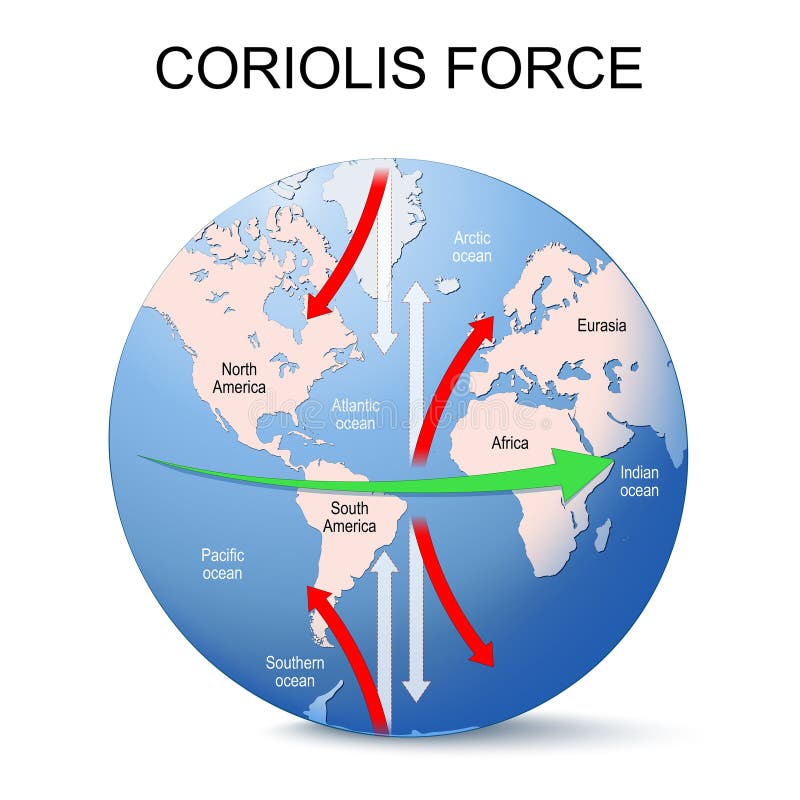
Free with trial Coriolis force. Coriolis effect. Globe of planet Earth with continents and arrows that show direction of rotation. vector illustration. Atmospheric circulation vectors Coriolis force
Free with trial Atmosphere of Earth. Layer of gases surrounding the planet Earth. Earth's gravity. Exosphere Thermosphere Mesosphere Stratosphere, Troposphere. Vector illustration. Atmospheric circulation vectors Atmosphere of Earth. Layer of gases surrounding the planet Earth
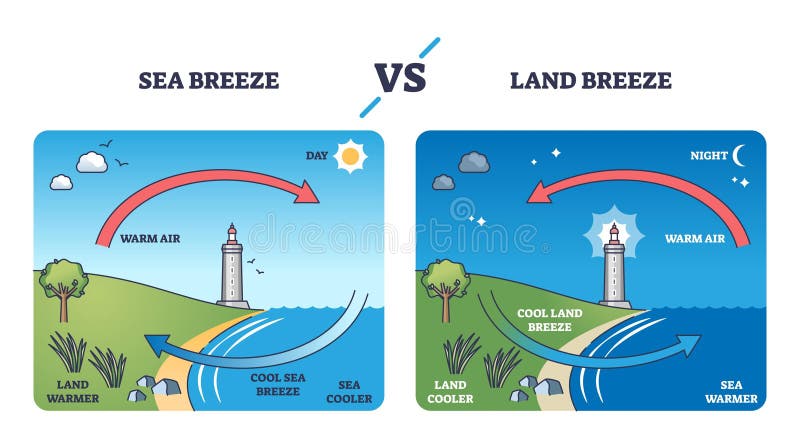
Free with trial Land vs sea breeze shows airflow patterns, temperature differences, and main elements, land, sea, and wind arrows. Outline diagram. Atmospheric circulation vectors Land vs sea breeze shows airflow patterns, temperature differences, and ... Land vs sea breeze shows airflow patterns, temperature differences, and main elements, land, sea, and wind arrows. Outline diagram
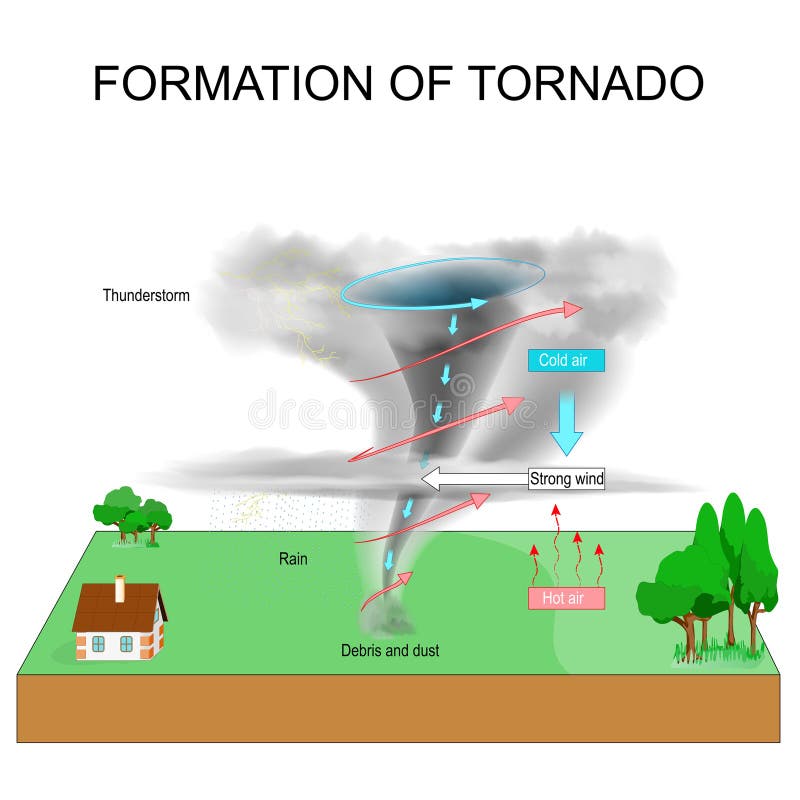
Free with trial Tornado formation. Severe Weather. Tornadogenesis. Thunderstorm. Vector illustration. Atmospheric circulation vectors Tornado formation. Severe Weather. Tornadogenesis
Free with trial BP - Blood Pressure acronym, concept background. Atmospheric circulation illustrations BP - Blood Pressure acronym, concept background
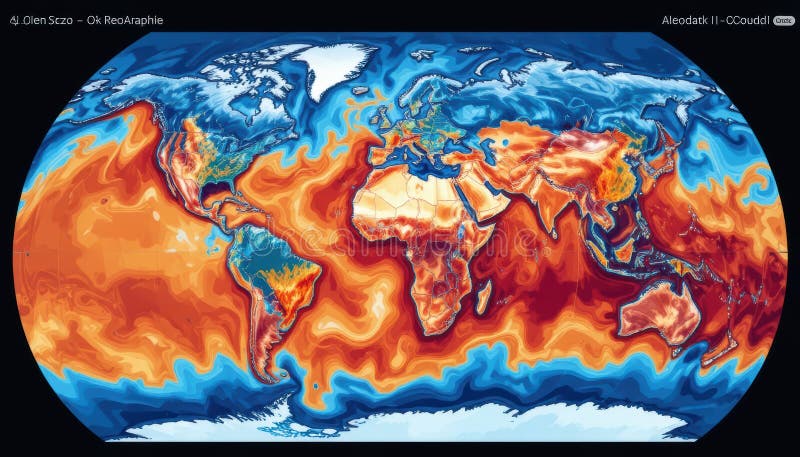
Free with trial A scientific visualization showcasing global ocean temperatures and currents across the world map. Vibrant colors illustrate heat distribution, from cold polar regions (blue) to warm equatorial waters (orange/red), highlighting complex climate patterns and their influence on Earth's environment. Atmospheric circulation illustrations Global Ocean Temperature and Current Map. A scientific visualization showcasing global ocean temperatures and currents across the world map. Vibrant colors illustrate heat distribution, from cold polar regions (blue) to warm equatorial waters (orange/red), highlighting complex climate patterns and their influence on Earth's environment.
Free with trial A massive hurricane looms over the ocean, its spiraling clouds creating a distinct and threatening formation. The swirling winds and moisture are vividly visible, highlighting the storm 's power and potential impact on nearby coastal areas. The bright white clouds contrast sharply with the deep blues of the ocean, illustrating the fierce energy of the storm as it moves toward the land. Atmospheric circulation illustrations Hurricane spins over the ocean near the coast, showing intense circulation patterns. A massive hurricane looms over the ocean, its spiraling clouds creating a distinct and threatening formation. The swirling winds and moisture are vividly visible, highlighting the storm 's power and potential impact on nearby coastal areas. The bright white clouds contrast sharply with the deep blues of the ocean, illustrating the fierce energy of the storm as it moves toward the land
Free with trial Detailed lungs show bronchiole and cellular clusters, clear sky enhances anatomical focus For Social Media Post Size. Atmospheric circulation illustrations Detailed lungs show bronchiole and cellular clusters, clear sky enhances anatomical focus
Free with trial 3D Isometric Flat Vector Illustration of Atmospheric Circulation, Movement Of Cold And Warm Fronts. Atmospheric circulation vectors 3D Isometric Flat Vector Illustration of Atmospheric Circulation, Movement Of Cold And Warm Fronts
Free with trial Atmospheric cold front vector illustration diagram with front movement scheme. Global earth air circulation. Weather forecasting. Atmospheric circulation vectors Atmospheric cold front vector illustration diagram with front movement scheme. Global earth air circulation. Weather
Free with trial Atmospheric warm front vector illustration diagram with front movement scheme. Global earth air circulation. Weather forecasting. Atmospheric circulation vectors Atmospheric warm front vector illustration diagram with front movement scheme. Global earth air circulation. Weather
Free with trial 3D Isometric Flat Vector Illustration of Atmospheric Circulation, Movement Of Cold And Warm Fronts. Atmospheric circulation vectors 3D Isometric Flat Vector Illustration of Atmospheric Circulation
Free with trial Illustration of physics and astronomy, The global atmospheric circulation model is a simplified version of how air currents in the atmosphere move, global atmospheric circulation model, wind direction. Atmospheric circulation vectors Illustration of physics and astronomy, The global atmospheric circulation model
Free with trial Atmospheric circulation multi color concept icon. Air movement distributing thermal energy. Natural phenomena. Round shape line illustration. Abstract idea. Graphic design. Easy to use in article. Atmospheric circulation vectors Atmospheric circulation multi color concept icon
Free with trial Atmospheric circulation blue gradient concept icon. Air movement distributing thermal energy. Natural phenomena. Round shape line illustration. Abstract idea. Graphic design. Easy to use in article. Atmospheric circulation vectors Atmospheric circulation blue gradient concept ico
Free with trial A stylized of the Earth globe atmospheric circulation patterns. Continents are depicted in green and orange hues against a light blue ocean. Curved blue arrows indicate wind currents labeled as "Trade Winds," "Hadley," and "Ferrel Cells. " Other labels include "Thdoli Winds," "Xff Fect," "Waeerfreies," and "Coriollis Effect. " A grid overlays the globe, representing latitude and longitude lines. Atmospheric circulation illustrations Earth globe showing atmospheric circulation patterns and trade winds. A stylized of the Earth globe atmospheric circulation patterns. Continents are depicted in green and orange hues against a light blue ocean. Curved blue arrows indicate wind currents labeled as "Trade Winds," "Hadley," and "Ferrel Cells." Other labels include "Thdoli Winds," "Xff Fect," "Waeerfreies," and "Coriollis Effect." A grid overlays the globe, representing latitude and longitude lines
Free with trial A stylized of the Earth globe atmospheric circulation patterns. Continents are depicted in green and orange hues against a light blue ocean. Curved blue arrows indicate wind currents labeled as "Trade Winds," "Hadley," and "Ferrel Cells. " Other labels include "Thdoli Winds," "Xff Fect," "Waeerfreies," and "Coriollis Effect. " A grid overlays the globe, representing latitude and longitude lines. Atmospheric circulation illustrations Earth globe showing atmospheric circulation patterns and trade winds. A stylized of the Earth globe atmospheric circulation patterns. Continents are depicted in green and orange hues against a light blue ocean. Curved blue arrows indicate wind currents labeled as "Trade Winds," "Hadley," and "Ferrel Cells." Other labels include "Thdoli Winds," "Xff Fect," "Waeerfreies," and "Coriollis Effect." A grid overlays the globe, representing latitude and longitude lines
Free with trial A comprehensive vector illustration of a global map overlayed with intricate air currents and atmospheric circulation patterns. This visual is perfect for depicting climate change, weather systems, and environmental science topics, ideal for educational or research presentations, vector design Generative AI. Atmospheric circulation vectors Global map with air currents and atmospheric circulation, a climate change concept, vector design Generative AI. A comprehensive vector illustration of a global map overlayed with intricate air currents and atmospheric circulation patterns. This visual is perfect for depicting climate change, weather systems, and environmental science topics, ideal for educational or research presentations, vector design Generative AI
Free with trial This image has been generated by Generative Ai. A detailed 3D illustration depicting atmospheric circulation, showcasing global wind patterns and climatic zones. The design highlights the complex movements of air across the Earth, visually representing the dynamics of weather and climate systems. Atmospheric circulation illustrations A detailed 3d illustration of atmospheric circulation showcasing global wind patterns and climatic zones. This image has been generated by Generative Ai. A detailed 3D illustration depicting atmospheric circulation, showcasing global wind patterns and climatic zones. The design highlights the complex movements of air across the Earth, visually representing the dynamics of weather and climate systems
Free with trial This image has been generated by Generative Ai. A detailed 3D illustration depicting atmospheric circulation, showcasing global wind patterns and climatic zones. The design highlights the complex movements of air across the Earth, visually representing the dynamics of weather and climate systems. Atmospheric circulation illustrations A detailed 3d illustration of atmospheric circulation showcasing global wind patterns and climatic zones. This image has been generated by Generative Ai. A detailed 3D illustration depicting atmospheric circulation, showcasing global wind patterns and climatic zones. The design highlights the complex movements of air across the Earth, visually representing the dynamics of weather and climate systems
Free with trial This image has been generated by Generative Ai. A detailed 3D illustration depicting atmospheric circulation, showcasing global wind patterns and climatic zones. The design highlights the complex movements of air across the Earth, visually representing the dynamics of weather and climate systems. Atmospheric circulation illustrations A detailed 3d illustration of atmospheric circulation showcasing global wind patterns and climatic zones. This image has been generated by Generative Ai. A detailed 3D illustration depicting atmospheric circulation, showcasing global wind patterns and climatic zones. The design highlights the complex movements of air across the Earth, visually representing the dynamics of weather and climate systems
Free with trial This image has been generated by Generative Ai. A detailed 3D illustration depicting atmospheric circulation, showcasing global wind patterns and climatic zones. The design highlights the complex movements of air across the Earth, visually representing the dynamics of weather and climate systems. Atmospheric circulation illustrations A detailed 3d illustration of atmospheric circulation showcasing global wind patterns and climatic zones. This image has been generated by Generative Ai. A detailed 3D illustration depicting atmospheric circulation, showcasing global wind patterns and climatic zones. The design highlights the complex movements of air across the Earth, visually representing the dynamics of weather and climate systems
Free with trial Global atmospheric circulation patterns over a world map depiction with cloud background. A stunning visual masterpiece crafted with artistic precision. Generative AI. Atmospheric circulation illustrations Global atmospheric circulation patterns over a world map depiction with cloud background. Generative AI. Global atmospheric circulation patterns over a world map depiction with cloud background. A stunning visual masterpiece crafted with artistic precision. Generative AI
Free with trial 3D Isometric Flat Vector Illustration of Atmospheric Circulation, Movement Of Cold And Warm Fronts. Atmospheric circulation vectors 3D Isometric Flat Vector Illustration of Atmospheric Circulation, Movement Of Cold And Warm Fronts
Free with trial Atmospheric warm front vector illustration diagram with front movement scheme. Global earth air circulation. Weather forecasting. Atmospheric circulation vectors Atmospheric warm front vector illustration diagram with front movement scheme. Global earth air circulation. Weather
Free with trial Atmospheric circulation. Global wind patterns or Hadley-Ferrel Model. Coriolis effect. The globe of the planet Earth with continents, equator, parallels, high and low pressure zones. The arrows indicate the wind direction. Detailed Vector poster. Atmospheric circulation vectors Atmospheric circulation. Global winds. Coriolis effect. Atmospheric circulation. Global wind patterns or Hadley-Ferrel Model. Coriolis effect. The globe of the planet Earth with continents, equator, parallels, high and low pressure zones. The arrows indicate the wind direction. Detailed Vector poster
Free with trial Illustration of physics and ecology, Atmospheric circulation, Earth's surface is warmer during the day, This creates an area of low pressure over land, bringing the breeze in, the occurrence of rain. Atmospheric circulation vectors Illustration of physics and ecology, Atmospheric circulation, Earth\'s surface is warmer during the day. illustration of physics and ecology, Atmospheric circulation, Earth's surface is warmer during the day, This creates an area of low pressure over land, bringing the breeze in, the occurrence of rain
Free with trial A detailed of the Earth globe showing continents and oceans. Concentric rings in red, yellow, and blue are superimposed on various landmasses, indicating atmospheric or oceanic phenomena. Curved lines represent wind or current patterns. Latitude lines marked with 30 degrees are visible. Text labels in an unfamiliar script surround the globe. Atmospheric circulation illustrations Earth globe with atmospheric circulation patterns and labels. A detailed of the Earth globe showing continents and oceans. Concentric rings in red, yellow, and blue are superimposed on various landmasses, indicating atmospheric or oceanic phenomena. Curved lines represent wind or current patterns. Latitude lines marked with 30 degrees are visible. Text labels in an unfamiliar script surround the globe
Free with trial A detailed of the Earth globe showing continents and oceans. Concentric rings in red, yellow, and blue are superimposed on various landmasses, indicating atmospheric or oceanic phenomena. Curved lines represent wind or current patterns. Latitude lines marked with 30 degrees are visible. Text labels in an unfamiliar script surround the globe. Atmospheric circulation illustrations Earth globe with atmospheric circulation patterns and labels. A detailed of the Earth globe showing continents and oceans. Concentric rings in red, yellow, and blue are superimposed on various landmasses, indicating atmospheric or oceanic phenomena. Curved lines represent wind or current patterns. Latitude lines marked with 30 degrees are visible. Text labels in an unfamiliar script surround the globe
Free with trial This image displays a view of Earth from space, highlighting atmospheric circulation patterns and the distribution of landmasses, including Africa, Europe, and parts of Asia. The image captures the planet's oceans, ice caps, and cloud formations, emphasizing the dynamic nature of Earth's atmosphere and geography. Atmospheric circulation illustrations Earth from space showcasing atmospheric patterns and landmasses. This image displays a view of Earth from space, highlighting atmospheric circulation patterns and the distribution of landmasses, including Africa, Europe, and parts of Asia. The image captures the planet's oceans, ice caps, and cloud formations, emphasizing the dynamic nature of Earth's atmosphere and geography
Free with trial This image captures a breathtaking view of Earth from space, highlighting the Western Hemisphere. The vibrant blues of the oceans, the greens and browns of the continents, and the white swirls of clouds create a mesmerizing visual. The image also showcases the intricate patterns of atmospheric circulation, emphasizing the dynamic nature of our planet. Atmospheric circulation illustrations A stunning view of earth from space showcasing the western hemisphere and atmospheric patterns. This image captures a breathtaking view of Earth from space, highlighting the Western Hemisphere. The vibrant blues of the oceans, the greens and browns of the continents, and the white swirls of clouds create a mesmerizing visual. The image also showcases the intricate patterns of atmospheric circulation, emphasizing the dynamic nature of our planet
Free with trial A massive cyclone forms a swirling cloud spiral over coastal waters, revealing powerful atmospheric circulation, layered storm bands, and dynamic weather system structure,. Atmospheric circulation illustrations Cyclone Cloud Spiral Over Coastal Waters Illustrating Atmospheric Circulation and Weather Patterns, AI generated. A massive cyclone forms a swirling cloud spiral over coastal waters, revealing powerful atmospheric circulation, layered storm bands, and dynamic weather system structure,
Free with trial A modern vector icon depicting air flowing through a system, symbolizing air circulation, ventilation, and environmental control technology. Perfect for HVAC systems, cleanroom design, or climate management. This design clearly represents the controlled movement of gases and efficient atmospheric regulation, vector design Generative AI. Atmospheric circulation vectors Air Circulation System Icon Vector, Ventilation Flow Technology, vector design Generative AI. A modern vector icon depicting air flowing through a system, symbolizing air circulation, ventilation, and environmental control technology. Perfect for HVAC systems, cleanroom design, or climate management. This design clearly represents the controlled movement of gases and efficient atmospheric regulation, vector design Generative AI
Free with trial A simple diagram illustrating air circulation between clouds and the ground, with arrows indicating movement. This graphic is perfect for explaining basic weather patterns, atmospheric phenomena, or environmental science concepts in a clear and accessible way, ideal for educational materials, vector design Generative AI. Atmospheric circulation vectors Air circulation with clouds and ground, illustrating weather patterns, vector design Generative AI. A simple diagram illustrating air circulation between clouds and the ground, with arrows indicating movement. This graphic is perfect for explaining basic weather patterns, atmospheric phenomena, or environmental science concepts in a clear and accessible way, ideal for educational materials, vector design Generative AI
Free with trial Crashed abandoned rusty expensive atmospheric suv as circulation banned for co2 emission 2030 agenda dystopian concept. Atmospheric circulation illustrations Crashed abandoned rusty expensive atmospheric suv as circulation banned for co2 emission 2030 agenda
Free with trial Crashed abandoned rusty expensive atmospheric suv as circulation banned for co2 emission 2030 agenda dystopian concept. Atmospheric circulation illustrations Crashed abandoned rusty expensive atmospheric suv as circulation banned for co2 emission 2030 agenda
Free with trial Cyclone and anticyclone diagram shows swirling air patterns, pressure systems, and the Earth, explaining atmospheric circulation. Outline diagram. Atmospheric circulation vectors Cyclone and anticyclone diagram shows swirling air patterns, pressure systems, ... Cyclone and anticyclone diagram shows swirling air patterns, pressure systems, and the Earth, explaining atmospheric circulation. Outline diagram
Free with trial Wind motion, weather, climate, air circulation, meteorology, atmospheric science. Outline of a cloud, arrows indicating wind. Wind motion and weather visualization concept. Atmospheric circulation vectors Cloud Movement and Wind Direction Diagram Air Flow and Weather Dynamics. Wind motion, weather, climate, air circulation, meteorology, atmospheric science. Outline of a cloud, arrows indicating wind. Wind motion and weather visualization concept
Free with trial This detailed map showcases the dynamic flow of global weather patterns and ocean currents, highlighting atmospheric circulation, cyclonic activity, and the interaction between landmasses and oceans across the planet. Atmospheric circulation illustrations Global Weather Patterns Illustrated on World Map with Ocean Currents. This detailed map showcases the dynamic flow of global weather patterns and ocean currents, highlighting atmospheric circulation, cyclonic activity, and the interaction between landmasses and oceans across the planet
Free with trial Sea breeze - cool air then rush towards the land. Land breeze - cool air rushes towards to ocean. Convection. Warm air rises up to form clouds. Atmospheric circulation. Local winds. Diurnal cycle. Vector illustration. Atmospheric circulation vectors Sea breeze and Land breeze. Sea breeze - cool air then rush towards the land. Land breeze - cool air rushes towards to ocean. Convection. Warm air rises up to form clouds. Atmospheric circulation. Local winds. Diurnal cycle. Vector illustration
Free with trial Sea Breeze Air Circulation Diagram. Illustration of sea breeze air circulation. Atmospheric circulation illustrations Sea Breeze Air Circulation Diagram. Illustration of sea breeze air circulation
Free with trial Satellite map of North America depicting air pollution levels, particularly particulate matter. The Ohio River Valley and southeastern U. S. show high pollution concentrations in red and orange. A plume extends northeast, crossing over parts of Canada and into the Atlantic. Green and blue areas indicate lower pollution levels. The color scale at the bottom right categorizes pollution density. The map highlights atmospheric circulation patterns impacting the dispersion of pollutants across the continent. Atmospheric circulation illustrations Satellite map of North America depicting air pollution levels, particularly particulate matter. The
Free with trial Circular diagram illustrating the weather cycle with icons representing sun, clouds, rain, snow, and thunderstorms. Arrows indicate wind patterns and atmospheric circulation. This visual concept represents meteorological phenomena and seasonal changes. Atmospheric circulation illustrations Weather Cycle Diagram Sun, Rain, Snow, Storm, Wind Arrows, Clouds. Circular diagram illustrating the weather cycle with icons representing sun, clouds, rain, snow, and thunderstorms. Arrows indicate wind patterns and atmospheric circulation. This visual concept represents meteorological phenomena and seasonal changes.
Free with trial A modern illustration of the Earth displaying global weather patterns, featuring icons for sun, rain clouds, and wind flows. This graphic represents atmospheric circulation and forecasting. Atmospheric circulation illustrations Global Weather Patterns Earth with Sun, Clouds, Rain, and Wind Arrows. A modern illustration of the Earth displaying global weather patterns, featuring icons for sun, rain clouds, and wind flows. This graphic represents atmospheric circulation and forecasting.
Free with trial Detailed visualization of Earth's atmospheric layers, showcasing the troposphere, stratosphere with the ozone layer, mesosphere, thermosphere, and exosphere. The diagram illustrates weather phenomena, pressure systems (H L), temperature variations, and the jet stream. Atmospheric circulation illustrations Atmospheric Layers of Earth Troposphere, Stratosphere, Mesosphere, Thermosphere, Exosphere. Detailed visualization of Earth's atmospheric layers, showcasing the troposphere, stratosphere with the ozone layer, mesosphere, thermosphere, and exosphere. The diagram illustrates weather phenomena, pressure systems (H L), temperature variations, and the jet stream.
Free with trial Illustration of atmospheric gravity waves traveling through layers of the upper atmosphere. This scientific visualization was generated using AI for meteorology and climate research concepts. Atmospheric circulation illustrations Atmospheric Gravity Waves Moving Through Upper Sky Layer Visualization. Illustration of atmospheric gravity waves traveling through layers of the upper atmosphere. This scientific visualization was generated using AI for meteorology and climate research concepts.
Free with trial Illustration of atmospheric gravity waves traveling through layers of the upper atmosphere. This scientific visualization was generated using AI for meteorology and climate research concepts. Atmospheric circulation illustrations Atmospheric Gravity Waves Moving Through Upper Sky Layer Visualization. Illustration of atmospheric gravity waves traveling through layers of the upper atmosphere. This scientific visualization was generated using AI for meteorology and climate research concepts.