Free with trial A black arrow curves downwards with the word RECESSION above it on a white background. Background decrease decline illustrations Black arrow pointing down with the word RECESION on a white background recession. A black arrow curves downwards with the word RECESSION above it on a white. A black arrow curves downwards with the word RECESSION above it on a white background
Free with trial Clean and simple downward arrow symbol in bold black on a plain white background, ideal for web design, user interfaces, infographics, and business presentations. Background decrease decline vectors Minimalist black downward arrow icon on white background for business and design. Clean and simple downward arrow symbol in bold black on a plain white. Clean and simple downward arrow symbol in bold black on a plain white background, ideal for web design, user interfaces, infographics, and business presentations
Free with trial Clean and simple downward arrow symbol in bold black on a plain white background, ideal for web design, user interfaces, infographics, and business presentations. Background decrease decline vectors Minimalist black downward arrow icon on white background for business and design. Clean and simple downward arrow symbol in bold black on a plain white. Clean and simple downward arrow symbol in bold black on a plain white background, ideal for web design, user interfaces, infographics, and business presentations
Free with trial Global financial market chart with downward arrows candlestick data and world map background representing stock decline economic crisis trading volatility and investment risk analysis. Background decrease decline illustrations AI generated global financial market chart with downward arrows candlestick data and world map background representing stock. Decline economic crisis trading. global financial market chart with downward arrows candlestick data and world map background representing stock decline economic crisis trading volatility and investment risk analysis
Free with trial A prominent red downward arrow conveys a strong message of decline, loss, or a negative trend. Ideal for financial reports, business analytics, and economic downturn concepts. Background decrease decline illustrations Red downward arrow symbolizing business decline and financial loss in a clean setting white background. A prominent red downward arrow conveys a strong message. A prominent red downward arrow conveys a strong message of decline, loss, or a negative trend. Ideal for financial reports, business analytics, and economic downturn concepts
Free with trial Declining Graph With Arrow Cursor Line Icon. Economic Downturn, Market Analysis, And Financial Decline Outline Symbol. Business Performance Tracking. Editable Stroke. Isolated Vector Illustration. Background decrease decline vectors Declining Graph With Arrow Cursor Line Icon. Economic Downturn, Market Analysis, And Financial Decline Outline Symbol. Business Performance Tracking. Editable
Free with trial Red graph falling down representing stock market crash with data and numbers on dark background. Background decrease decline illustrations Stock market crashing down with red graph and numbers on dark background. Red graph falling down representing stock market crash with data and numbers on dark. Red graph falling down representing stock market crash with data and numbers on dark background
Free with trial Black line graph icon with data points showing fluctuations on a white background Clear details and vibrant co. Background decrease decline illustrations Black line graph icon showing fluctuating data points on a white background chart. Black line graph icon with data points showing fluctuations on a white. Black line graph icon with data points showing fluctuations on a white background Clear details and vibrant co
Free with trial 3D render of orange crude oil barrels increasing in size, followed by a large blue arrow pointing downward on a white background, symbolizing market decline, price drop, and economic recession. Background decrease decline illustrations Crude Oil Barrels Price Fluctuation with Downward Arrow on White for Market Slump. 3D render of orange crude oil barrels increasing in size, followed by a large. 3D render of orange crude oil barrels increasing in size, followed by a large blue arrow pointing downward on a white background, symbolizing market decline, price drop, and economic recession.
Free with trial 3D render of orange crude oil barrels increasing in size, followed by a large blue arrow pointing downward on a white background, symbolizing market decline, price drop, and economic recession. Background decrease decline illustrations Crude Oil Barrels Price Fluctuation with Downward Arrow on White for Market Slump. 3D render of orange crude oil barrels increasing in size, followed by a large. 3D render of orange crude oil barrels increasing in size, followed by a large blue arrow pointing downward on a white background, symbolizing market decline, price drop, and economic recession.
Free with trial This 3D rendered bar graph, generated by AI, visually represents a downward trend. The red bars progressively decrease in height, illustrating a clear decline. Perfect for illustrating concepts related to loss, decrease, or decline in presentations and reports. Background decrease decline illustrations Declining Bar Graph. This 3D rendered bar graph, generated by AI, visually represents a downward trend. The red bars progressively decrease in height. This 3D rendered bar graph, generated by AI, visually represents a downward trend. The red bars progressively decrease in height, illustrating a clear decline. Perfect for illustrating concepts related to loss, decrease, or decline in presentations and reports.
Free with trial A globe sits atop a descending bar graph, symbolizing economic downturn. The visual represents a global recession, market decline, or financial crisis. It is a concept for business and investment risks. Background decrease decline illustrations Globe and declining bar graph isolated on white background. A globe sits atop a descending bar graph, symbolizing economic downturn. The visual represents a. A globe sits atop a descending bar graph, symbolizing economic downturn. The visual represents a global recession, market decline, or financial crisis. It is a concept for business and investment risks
Free with trial This 3D image features a stylized arrow pointing downwards, combined with a dollar sign, set against a transparent background. Ideal for financial or economic themes, this vector graphic can be used in various design projects. The transparent background allows for seamless integration into different design layouts. Background decrease decline vectors A 3d arrow pointing downwards with a dollar sign isolated on transparent background. This 3D image features a stylized arrow pointing downwards, combined with a. This 3D image features a stylized arrow pointing downwards, combined with a dollar sign, set against a transparent background. Ideal for financial or economic themes, this vector graphic can be used in various design projects. The transparent background allows for seamless integration into different design layouts.
Free with trial Various colored cylinder objects of different heights arranged against striped background resembling falling chart Ideal for presenting business data or financial analysis. Background decrease decline illustrations Analyzing Colorful Cylinders Arranged Like a Falling Bar Chart on Blue Background. Various colored cylinder objects of different heights arranged against striped. Various colored cylinder objects of different heights arranged against striped background resembling falling chart Ideal for presenting business data or financial analysis
Free with trial A digital abstract background showing a global financial crisis with red arrows, crashing charts, and a blue downward arrow on a dark grid. 3D Rendering. Background decrease decline illustrations Abstract background of global financial crisis with red downward arrows and crashing stock market chart on dark fintech grid. A digital abstract background. A digital abstract background showing a global financial crisis with red arrows, crashing charts, and a blue downward arrow on a dark grid. 3D Rendering
Free with trial A 3D rendered of a presentation board featuring a downward trending bar chart and a dollar sign symbol, isolated on a white background. Background decrease decline vectors A3d of a presentation board showing a downward trending bar chart and a dollar sign, isolated on white background. A 3D rendered of a presentation board. A 3D rendered of a presentation board featuring a downward trending bar chart and a dollar sign symbol, isolated on a white background
Free with trial An illuminated downward arrow with a jagged line signifies a decline, representing negative performance and can be used to illustrate a decrease in business or any downward trend. Background decrease decline illustrations Declining Arrow Shows Downtrend and Negative Performance. An illuminated downward arrow with a jagged line signifies a decline, representing negative performance. An illuminated downward arrow with a jagged line signifies a decline, representing negative performance and can be used to illustrate a decrease in business or any downward trend
Free with trial Minus, Subtract or Decrease simple icons set designed in filled, outline, line and stroke style. Background decrease decline vectors Minus, Subtract or Decrease simple icons set designed in filled and stroke style. Minus, Subtract or Decrease simple icons set designed in filled, outline, line. Minus, Subtract or Decrease simple icons set designed in filled, outline, line and stroke style
Free with trial This 3D rendering shows a bar chart featuring three vertical bars of decreasing height, colored in blue, green-yellow, and yellow. They stand against a black background. Background decrease decline vectors Three 3D rendering bar chart elements in decreasing order on transparent background. This 3D rendering shows a bar chart featuring three vertical bars of. This 3D rendering shows a bar chart featuring three vertical bars of decreasing height, colored in blue, green-yellow, and yellow. They stand against a black background.
Free with trial The image shows a line graph with yellow data points connected by lines, set against a blue grid background. The graph depicts various peaks and troughs, indicating fluctuations in the data over time. Background decrease decline illustrations A dynamic graph illustrating fluctuating data points on a blue grid background. The image shows a line graph with yellow data points connected by lines, set. The image shows a line graph with yellow data points connected by lines, set against a blue grid background. The graph depicts various peaks and troughs, indicating fluctuations in the data over time
Free with trial A metallic silver arrow pointing downward with a glossy finish is isolated on a white background. It a smooth, reflective surface. Background decrease decline illustrations Metallic silver arrow pointing down with a glossy finish on white background aspect. A metallic silver arrow pointing downward with a glossy finish is isolated. A metallic silver arrow pointing downward with a glossy finish is isolated on a white background. It a smooth, reflective surface
Free with trial Neon blue and pink arrow pointing downwards on a glossy surface against a dark blue background. Generative AI. Background decrease decline illustrations Neon blue and pink arrow pointing downwards on a glossy surface against a dark blue background. Generative AI
Free with trial Red falling arrow and declining chart with stock market data overlay on office interior background, symbolizing global financial collapse impact. Background decrease decline illustrations Financial market crash with red downward arrow and stock graph lines descending sharply over modern office background during. Red falling arrow and declining. Red falling arrow and declining chart with stock market data overlay on office interior background, symbolizing global financial collapse impact
Free with trial A gold and silver Bitcoin coin is positioned next to a series of transparent blocks. Each block features a Bitcoin symbol or related geometric pattern. The blocks descend in size, suggesting a downward trend. The background is plain white, emphasizing the objects. The overall style is minimalist and clean. Background decrease decline illustrations Bitcoin coin and descending transparent blocks with Bitcoin symbols on a white background. A gold and silver Bitcoin coin is positioned next to a series of. A gold and silver Bitcoin coin is positioned next to a series of transparent blocks. Each block features a Bitcoin symbol or related geometric pattern. The blocks descend in size, suggesting a downward trend. The background is plain white, emphasizing the objects. The overall style is minimalist and clean
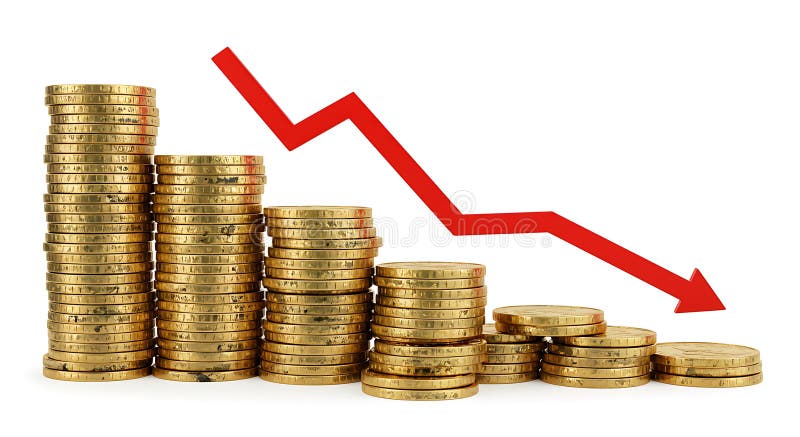
Free with trial Stacks of gold coins decrease alongside a downward trending red arrow, symbolizing financial loss or market decline Use for economic or business concepts. Background decrease decline illustrations Declining Coin Stacks with Red Arrow Showing Financial Downturn. Stacks of gold coins decrease alongside a downward trending red arrow, symbolizing financial. Stacks of gold coins decrease alongside a downward trending red arrow, symbolizing financial loss or market decline Use for economic or business concepts
Free with trial Stock market chart featuring a red downtrend line against a black background, fluctuations in financial data. perfect for illustrating concepts in finance, investment analysis, and economic downturns. Generative AI. Background decrease decline illustrations Dynamic Stock Market Analysis with Red Downtrend Line on Black Background Generative AI. Stock market chart featuring a red downtrend line against a black. Stock market chart featuring a red downtrend line against a black background, fluctuations in financial data. perfect for illustrating concepts in finance, investment analysis, and economic downturns. Generative AI
Free with trial This minimalist features a single continuous line drawing of a classic business briefcase accompanied by a downward-pointing arrow to symbolize financial decline or career transition. The gold line art set against a clean white background provides a professional and modern aesthetic suitable for economic reports, corporate blogs, and financial news graphics. Background decrease decline illustrations Minimalist Business Briefcase Line Art With Downward Arrow Economic Recession Concept. This minimalist features a single continuous line drawing of a classic. This minimalist features a single continuous line drawing of a classic business briefcase accompanied by a downward-pointing arrow to symbolize financial decline or career transition. The gold line art set against a clean white background provides a professional and modern aesthetic suitable for economic reports, corporate blogs, and financial news graphics
Free with trial Twenty-five colorful icons depict various financial and business concepts related to growth and decline. Each icon combines elements like arrows, charts, coins, and gears in vibrant red, yellow, and blue colors. Labels such as "Chart Focus," "Growth Arrow," "Money Stock," "Market Decline," and "Data Analytics" accompany each icon, suggesting themes of financial analysis and performance metrics. Set against a white background with a maroon accent on the left that reads "Increase Decrease Icons," these symbols visually represent economic trends and business strategies. Background decrease decline vectors Increase Decrease Icon Set - Business Growth Analytics, Up Down Arrows, Charts and Performance Statistics Vector Icons Collection. Twenty-five colorful icons. Twenty-five colorful icons depict various financial and business concepts related to growth and decline. Each icon combines elements like arrows, charts, coins, and gears in vibrant red, yellow, and blue colors. Labels such as "Chart Focus," "Growth Arrow," "Money Stock," "Market Decline," and "Data Analytics" accompany each icon, suggesting themes of financial analysis and performance metrics. Set against a white background with a maroon accent on the left that reads "Increase Decrease Icons," these symbols visually represent economic trends and business strategies.
Free with trial A line graph with a blue arrow pointing downwards, indicating a decline in value over time. the graph has a white background and features a series of colored sections, gradating from blue to green to yellow. Background decrease decline illustrations A graph showing a downward trend over time with a blue arrow isolated on white background. A line graph with a blue arrow pointing downwards, indicating a. a line graph with a blue arrow pointing downwards, indicating a decline in value over time. the graph has a white background and features a series of colored sections, gradating from blue to green to yellow
Free with trial Blue bars on a graph display a downward trend highlighted by a yellow arrow showing decline Great for illustrating economic concepts and market trends. Background decrease decline illustrations Decreasing Bar Graph with Arrow Downward Financial Decline. Blue bars on a graph display a downward trend highlighted by a yellow arrow showing decline Great for. Blue bars on a graph display a downward trend highlighted by a yellow arrow showing decline Great for illustrating economic concepts and market trends
Free with trial A blue arrow pointing up and down on a dark blue background with a gradient light effect above it. Generative AI. Background decrease decline illustrations A blue arrow pointing up and down on a dark blue background with a gradient light effect above it. Generative AI
Free with trial A 3D rendered red arrow points downwards, featuring a prominent yellow percentage sign, symbolizing a financial decline isolated on white background. Background decrease decline illustrations Red downward arrow with a yellow percentage sign indicating a decrease in value isolated on white background. A 3D rendered red arrow points downwards, featuring. A 3D rendered red arrow points downwards, featuring a prominent yellow percentage sign, symbolizing a financial decline isolated on white background
Free with trial Minimalist black and white circular sign featuring a bold downward arrow, ideal for financial reports, market trends, business decline, or reduction concepts in presentations and infographics. Background decrease decline vectors Bold downward arrow in black and white circular sign for business decline or reduction. Minimalist black and white circular sign featuring a bold downward arrow. Minimalist black and white circular sign featuring a bold downward arrow, ideal for financial reports, market trends, business decline, or reduction concepts in presentations and infographics
Free with trial Three-dimensional line graph with a metallic silver appearance, showing a decreasing trend in a zigzag pattern. The graph is set against a plain white background, with prominent vertical and horizontal axes, representing a financial or statistical decline. The lines are sleek and reflective, resembling metal tubing, enhancing the visual impact of a significant downturn. Background decrease decline vectors 3D line chart with decreasing trend and silver metallic effect representing financial losses. Three-dimensional line graph with a metallic silver appearance. Three-dimensional line graph with a metallic silver appearance, showing a decreasing trend in a zigzag pattern. The graph is set against a plain white background, with prominent vertical and horizontal axes, representing a financial or statistical decline. The lines are sleek and reflective, resembling metal tubing, enhancing the visual impact of a significant downturn.
Free with trial Black line graph showing a downward trend with an arrow on a white background Clear details and vibrant colors. Background decrease decline illustrations Black line graph showing a downward trend with arrow on white background Keywords: graph, chart. Black line graph showing a downward trend with an arrow on a. Black line graph showing a downward trend with an arrow on a white background Clear details and vibrant colors
Free with trial Wooden cubes with TAX letters, green arrows pointing downward on a light green background. Concept of tax reduction, finance, economy. 3D Rendering. Background decrease decline illustrations Wooden cubes spelling TAX with descending green arrows on light green background, representing tax reduction or economic decli. Wooden cubes with TAX letters. Wooden cubes with TAX letters, green arrows pointing downward on a light green background. Concept of tax reduction, finance, economy. 3D Rendering
Free with trial Red arrow sponge shape pointing down for financial decline and business recession concept. Generative AI. Background decrease decline illustrations Red arrow sponge shape pointing down for financial decline and business recession concept. Generative AI
Free with trial A visual representation of financial decline, this graphic features a bar chart with decreasing heights, topped by a sharp red arrow pointing downwards, symbolizing economic downturn. Background decrease decline illustrations Business bar chart graph shows downward trend with red arrow indicating loss isolated on white background. A visual representation of financial decline, this. A visual representation of financial decline, this graphic features a bar chart with decreasing heights, topped by a sharp red arrow pointing downwards, symbolizing economic downturn
Free with trial Steep downward trending line graph red arrow decrease devaluation Can be customized to fit various themes and styles. Background decrease decline illustrations Steep downward trending line graph, red arrow , decrease, devaluation. Steep downward trending line graph red arrow decrease devaluation Can be customized to. Steep downward trending line graph red arrow decrease devaluation Can be customized to fit various themes and styles
Free with trial A 3D render of a business chart illustrating a financial decline with a visual representation of falling data, presented on an artist's easel. Concept for economic downturn. Background decrease decline vectors 3d business graph showing a downward trend with bar chart and line on an easel stand transparent background. A 3D render of a business chart illustrating a. A 3D render of a business chart illustrating a financial decline with a visual representation of falling data, presented on an artist's easel. Concept for economic downturn
Free with trial A 3D render of a luminous red chart arrow plunging downwards and shattering a dark floor. The explosive impact creates flying debris against a black background with copy space, representing economic decline and business failure. Background decrease decline illustrations Dramatic red arrow crashing down symbolizing financial crisis and stock market recession. A 3D render of a luminous red chart arrow plunging downwards and. A 3D render of a luminous red chart arrow plunging downwards and shattering a dark floor. The explosive impact creates flying debris against a black background with copy space, representing economic decline and business failure
Free with trial A hand displays a green bar graph illustrating a downward trend in CO2 levels, symbolizing environmental protection and carbon reduction. Background decrease decline illustrations Hand holding a bar graph showing a decrease in CO2 emissions against a green leafy background. A hand displays a green bar graph illustrating a downward trend in. A hand displays a green bar graph illustrating a downward trend in CO2 levels, symbolizing environmental protection and carbon reduction
Free with trial A black curved arrow points downwards towards a horizontal line on a white background. Background decrease decline illustrations Black curved arrow descending towards a horizontal line on white background down movement. A black curved arrow points downwards towards a horizontal line on a. A black curved arrow points downwards towards a horizontal line on a white background
Free with trial Magnifying glass focuses on a blue bar graph with a visible downward trend line, set against a dark, blurred financial backdrop. Bars decrease in height from left to right, emphasizing a decline. The atmosphere is enhanced by subtle ambient reflections and lighting that highlight the graph's detail, symbolizing analysis of negative financial or economic trends. Background decrease decline illustrations Magnifying glass focused on a declining bar graph with a downward trend line on a dark background. Magnifying glass focuses on a blue bar graph with a visible. Magnifying glass focuses on a blue bar graph with a visible downward trend line, set against a dark, blurred financial backdrop. Bars decrease in height from left to right, emphasizing a decline. The atmosphere is enhanced by subtle ambient reflections and lighting that highlight the graph's detail, symbolizing analysis of negative financial or economic trends.
Free with trial Simple black downward arrow icon in clean line art style, isolated on plain white background for versatile use in graphics and UI design. Background decrease decline vectors Black downward pointing arrow icon isolated on white background minimalist line art design. Simple black downward arrow icon in clean line art style, isolated on. Simple black downward arrow icon in clean line art style, isolated on plain white background for versatile use in graphics and UI design
Free with trial Financial graphs and charts with red and white design elements, displayed on an isolated white background. Concept of declining business performance. 3D Rendering. Background decrease decline illustrations Financial graphs and charts showing a decline in performance. 3D Rendering. Financial graphs and charts with red and white design elements, displayed on an. Financial graphs and charts with red and white design elements, displayed on an isolated white background. Concept of declining business performance. 3D Rendering
Free with trial Colorful growth chart featuring orange and teal bars with upward and downward arrows on a clean white background representing progress decline business data trends and financial performance metrics. Background decrease decline illustrations Colorful growth chart with orange and teal bars and upward and downward arrows on white background. Colorful growth chart featuring orange and teal bars with. colorful growth chart featuring orange and teal bars with upward and downward arrows on a clean white background representing progress decline business data trends and financial performance metrics
Free with trial This image depicts a three-dimensional, downward-pointing arrow made up of red cubic blocks. The arrow is composed of a series of stacked blocks that gradually decrease in size, forming a sleek and modern design. The blocks are uniformly colored in a vibrant red hue, and the arrow is set against a plain, light-colored background, emphasizing its shape and structure. The design gives a clear. Background decrease decline illustrations A bold, downward-pointing arrow constructed from red block elements against a plain background. This image depicts a three-dimensional, downward-pointing arrow. This image depicts a three-dimensional, downward-pointing arrow made up of red cubic blocks. The arrow is composed of a series of stacked blocks that gradually decrease in size, forming a sleek and modern design. The blocks are uniformly colored in a vibrant red hue, and the arrow is set against a plain, light-colored background, emphasizing its shape and structure. The design gives a clear
Free with trial A minimalist 3D rendering of a white bar chart isolated on a clean white background. The graph features columns of varying heights that rise and then decline, with a prominent white diagonal arrow pointing downwards across the bars to illustrate a financial loss, market crash, or negative economic trend. Background decrease decline illustrations A 3d rendered white bar chart showing a downward trend with a diagonal arrow on a white background. A minimalist 3D rendering of a white bar chart isolated on a. A minimalist 3D rendering of a white bar chart isolated on a clean white background. The graph features columns of varying heights that rise and then decline, with a prominent white diagonal arrow pointing downwards across the bars to illustrate a financial loss, market crash, or negative economic trend
Free with trial Sharp downward sloping line graph red arrow pointing down background red Suitable for digital platforms. Background decrease decline illustrations Sharp downward sloping line graph, red arrow pointing down, background, red. Sharp downward sloping line graph red arrow pointing down background red Suitable. Sharp downward sloping line graph red arrow pointing down background red Suitable for digital platforms
Free with trial Abstract 3D bar graph showing financial downturn with negative arrow. Represents business recession market crash budget loss for corporate strategy. Background decrease decline illustrations 3D bar chart with downward red trend arrow on grid background during economic decline concept. Abstract 3D bar graph showing financial downturn with negative. Abstract 3D bar graph showing financial downturn with negative arrow. Represents business recession market crash budget loss for corporate strategy
Free with trial A stark red arrow descends directly onto a miniature house, visually representing a downturn in the housing market or an economic crisis. Clean white background with soft shadows. Background decrease decline illustrations Red arrow pointing down at a model house, symbolizing housing market decline or economic crisis. A stark red arrow descends directly onto a miniature house. A stark red arrow descends directly onto a miniature house, visually representing a downturn in the housing market or an economic crisis. Clean white background with soft shadows.
Free with trial This image was created using Generative AI. A minimalist dark gray icon featuring a descending staircase and a downward pointing arrow on a white background. Ideal for representing decline, reduction, or negative trends in financial reports. Background decrease decline vectors Dark Gray Descending Steps And Down Arrow Icon On White Background, Minimalist Business Symbol. This image was created using Generative AI. A minimalist dark. This image was created using Generative AI. A minimalist dark gray icon featuring a descending staircase and a downward pointing arrow on a white background. Ideal for representing decline, reduction, or negative trends in financial reports
Free with trial Statistic down 3D illustration. A 3D illustration of a statistic down icon isolated on a white background symbolizing decline in data or business performance. Background decrease decline illustrations Statistic down 3D illustration. A 3D illustration of a statistic down icon isolated on a white background symbolizing decline in data or business performance
Free with trial A stark, minimalist graphic illustration of a vibrant red arrow with a jagged, saw-toothed edge. The arrow is oriented diagonally, pointing from the upper left toward the lower right, symbolizing a sharp decrease, financial loss, economic downturn, or negative trajectory. The background is solid white, emphasizing the bold, aggressive shape of the downward-trending indicator. Background decrease decline illustrations A jagged red arrow pointing downwards representing decline or negative financial market trends. A stark, minimalist graphic illustration of a vibrant red arrow. A stark, minimalist graphic illustration of a vibrant red arrow with a jagged, saw-toothed edge. The arrow is oriented diagonally, pointing from the upper left toward the lower right, symbolizing a sharp decrease, financial loss, economic downturn, or negative trajectory. The background is solid white, emphasizing the bold, aggressive shape of the downward-trending indicator
Free with trial A blackboard with a graph on it and a potted plant next to it. The graph shows a downward trend, which could represent a decrease in sales or a decline in a particular stock. Background decrease decline illustrations A blackboard with a graph on it and a potted plant next to it. The graph shows a downward trend, which could represent a decrease in sales or a decline in a
Free with trial Steeply falling graph dark background dramatic drop illustration trend drop Vector illustration for high-quality printing. Background decrease decline illustrations Steeply falling graph, dark background, dramatic drop, illustration, trend, drop. Steeply falling graph dark background dramatic drop illustration trend drop. Steeply falling graph dark background dramatic drop illustration trend drop Vector illustration for high-quality printing
Free with trial A single, glossy blue arrow points directly downwards. The arrow has a rounded top and a sharp, pointed tip, with a reflective surface that gives it a shiny appearance. It is presented in isolation against a clean white background, making it a clear and distinct graphic element. Background decrease decline illustrations Glossy Blue Downward Arrow Icon on a White Background direction pointer. A single, glossy blue arrow points directly downwards. The arrow has a rounded top and a. A single, glossy blue arrow points directly downwards. The arrow has a rounded top and a sharp, pointed tip, with a reflective surface that gives it a shiny appearance. It is presented in isolation against a clean white background, making it a clear and distinct graphic element
Free with trial The image depicts two oil barrels labeled 'Oil' placed side by side on a white background, accompanied by a bold red downward-sloping arrow. The arrow indicates a significant decline, suggesting a drop in oil prices or supply. The visual emphasizes the economic or market trend of decreasing oil values. Background decrease decline illustrations Declining oil prices with barrels and downward trend line graphic. The image depicts two oil barrels labeled 'Oil' placed side by side on a white background. The image depicts two oil barrels labeled 'Oil' placed side by side on a white background, accompanied by a bold red downward-sloping arrow. The arrow indicates a significant decline, suggesting a drop in oil prices or supply. The visual emphasizes the economic or market trend of decreasing oil values
Free with trial A glossy glowing yellow light bulb paired with a bold blue downward-pointing arrow creates a striking 3D rendered icon set against a soft mint green background, blending the concept of ideas with a sense of reduction, downloading, or declining energy. This versatile image works effectively for business presentations, infographics, technology UI design, and content illustrating cost reduction,. Background decrease decline illustrations Glowing yellow light bulb with blue downward arrow 3D icon on mint background idea decline concept. A glossy glowing yellow light bulb paired with a bold blue. A glossy glowing yellow light bulb paired with a bold blue downward-pointing arrow creates a striking 3D rendered icon set against a soft mint green background, blending the concept of ideas with a sense of reduction, downloading, or declining energy. This versatile image works effectively for business presentations, infographics, technology UI design, and content illustrating cost reduction,
Free with trial This dramatic AI-generated visualization features a prominent 3D red decline arrow falling sharply against a shadowed, professional gray backdrop. Perfect for business professionals and marketers seeking to illustrate financial loss, negative trends, or economic recession data with a powerful, metaphorical image. Background decrease decline illustrations Curved 3D red arrow pointing downward on a dark background showing financial or economic decline. This dramatic AI-generated visualization features a prominent. This dramatic AI-generated visualization features a prominent 3D red decline arrow falling sharply against a shadowed, professional gray backdrop. Perfect for business professionals and marketers seeking to illustrate financial loss, negative trends, or economic recession data with a powerful, metaphorical image.
Free with trial Two coins, one red and one green, each with a dollar sign and a downward arrow, symbolizing financial loss, economic decline, and negative market trends. Background decrease decline vectors Vector art of two coins with dollar signs and downward arrows indicating financial loss isolated on white background. Two coins, one red and one green, each with. Two coins, one red and one green, each with a dollar sign and a downward arrow, symbolizing financial loss, economic decline, and negative market trends
Free with trial Clean vector illustration features two sets of parallel arrows against a white background. One set of three arrows is colored bright red and points upwards, each arrow slightly offset from the others, creating a dynamic visual. The second set of three arrows is colored vibrant blue and points downwards, mirroring the arrangement of the red arrows. This contrasting imagery of upward and downward movement is ideal for illustrating concepts of growth versus decline, increase versus decrease, success versus recession, or positive versus negative trends in business, finance, or other data-driven contexts. Background decrease decline illustrations Vector Illustration of Contrasting Red Upward and Blue Downward Arrows. Clean vector illustration features two sets of parallel arrows against a white background. clean vector illustration features two sets of parallel arrows against a white background. One set of three arrows is colored bright red and points upwards, each arrow slightly offset from the others, creating a dynamic visual. The second set of three arrows is colored vibrant blue and points downwards, mirroring the arrangement of the red arrows. This contrasting imagery of upward and downward movement is ideal for illustrating concepts of growth versus decline, increase versus decrease, success versus recession, or positive versus negative trends in business, finance, or other data-driven contexts.
Free with trial Vibrant abstract visualization of a trendline against a gradient background, ideal for business reports, financial analysis, and creative projects. Background decrease decline illustrations Abstract Data Visualization of a Trendline with Blue and Pink Background for Business Use. Vibrant abstract visualization of a trendline against a gradient. Vibrant abstract visualization of a trendline against a gradient background, ideal for business reports, financial analysis, and creative projects
Free with trial 3D rendering of various financial charts and graphs in red and pink tones on a white background. Concept of business analytics. Background decrease decline illustrations 3D Rendering of financial charts and graphs on a white background. 3D Rendering. 3D rendering of various financial charts and graphs in red and pink tones on a. 3D rendering of various financial charts and graphs in red and pink tones on a white background. Concept of business analytics
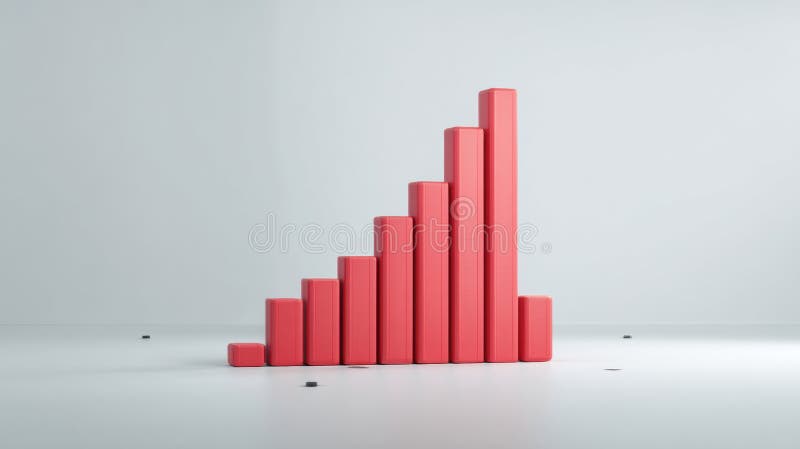
Free with trial This AI-generated illustration features a red bar chart with a declining arrow, symbolizing financial loss. Perfect for analysts, it provides a clean visual for economic reports and business presentations with ample copy space. Background decrease decline illustrations Red 3D financial bar chart showing a downward trend and economic decline on a minimalist background. This AI-generated illustration features a red bar chart. This AI-generated illustration features a red bar chart with a declining arrow, symbolizing financial loss. Perfect for analysts, it provides a clean visual for economic reports and business presentations with ample copy space.
Free with trial The image depicts a visual metaphor for an economic decline, featuring two businesspeople observing a descending bar graph. The graph shows a steady decrease in values, accompanied by a downward-pointing arrow. At the base of the graph are stacks of gold bars, symbolizing wealth or financial assets diminishing over time. The overall scene suggests a financial crisis or market downturn affecting. Background decrease decline illustrations Economic downturn illustrated with declining bar graph and gold bars isolated on white background. The image depicts a visual metaphor for an economic decline. The image depicts a visual metaphor for an economic decline, featuring two businesspeople observing a descending bar graph. The graph shows a steady decrease in values, accompanied by a downward-pointing arrow. At the base of the graph are stacks of gold bars, symbolizing wealth or financial assets diminishing over time. The overall scene suggests a financial crisis or market downturn affecting
Free with trial Seamless 3D Render Of A Minimalist Glossy Red Line Graph Indicating Statistics And Market Decline, Generated by AI. Background decrease decline illustrations Seamless 3D Render Of A Minimalist Glossy Red Line Graph Indicating Statistics And Market Decline. Generated by AI
Free with trial Visualizes the economic downturn in india with a declining chart and arrow. Illustrates financial crisis, market crash, and investment losses. Represents a business downfall and trade decline. Background decrease decline illustrations India economy recession chart financial crisis stock market crash business downfall investment loss trade decline. Visualizes the economic downturn in india with. visualizes the economic downturn in india with a declining chart and arrow. Illustrates financial crisis, market crash, and investment losses. Represents a business downfall and trade decline.
Free with trial A single, three-dimensional red arrow with a glossy finish is depicted pointing downwards and slightly to the right. The object is isolated on a clean white background. created Ai. Background decrease decline illustrations A glossy red arrow pointing downwards and slightly to the right isolated on white background. A single, three-dimensional red arrow with a glossy finish is. A single, three-dimensional red arrow with a glossy finish is depicted pointing downwards and slightly to the right. The object is isolated on a clean white background. created Ai
Free with trial This image was created using Generative AI. Conceptual icon representing financial loss or economic downturn. A dollar bill features a large downward arrow and a descending bar chart, symbolizing market decline, reduced revenue, or negative growth. Ideal for business reports and finance presentations. Background decrease decline vectors Financial Decline Icon: Dollar Bill With Downward Arrow And Descending Bar Chart On White Background. This image was created using Generative AI. Conceptual icon. This image was created using Generative AI. Conceptual icon representing financial loss or economic downturn. A dollar bill features a large downward arrow and a descending bar chart, symbolizing market decline, reduced revenue, or negative growth. Ideal for business reports and finance presentations
Free with trial A high-quality 3D render featuring a stylized cartoon hand in a blue sleeve dropping two golden coins toward a large, red downward-pointing arrow, symbolizing financial loss, economic downturn, investment risk, or a decrease in monetary value against a clean white background. Background decrease decline illustrations A 3d rendered cartoon hand dropping golden coins above a red downward arrow representing decline. A high-quality 3D render featuring a stylized cartoon hand in a. A high-quality 3D render featuring a stylized cartoon hand in a blue sleeve dropping two golden coins toward a large, red downward-pointing arrow, symbolizing financial loss, economic downturn, investment risk, or a decrease in monetary value against a clean white background
Free with trial Stock market decline, digital display, trading screen, red arrows and numbers, lavish wallpaper background Generative AI. Background decrease decline illustrations Stock market decline, digital display, trading screen, red arrows and numbers. Lavish wallpaper background Generative AI
Free with trial Abstract Blue Digital Stock Market Graph Decline. The image shows a downward trending line graph on a digital grid, representing a decline in the stock market. Background decrease decline illustrations Abstract Blue Digital Stock Market Graph Decline. The image shows a downward trending line graph on a digital grid, representing a decline in the stock market
Free with trial This AI-generated financial chart features a glowing red arrow plunging downwards. A powerful visual for analysts and investors to illustrate market crashes, economic recession, or negative business growth trends in reports. Background decrease decline illustrations Red financial bar chart with a glowing downward arrow representing market decline on a dark background. This AI-generated financial chart features a glowing red. This AI-generated financial chart features a glowing red arrow plunging downwards. A powerful visual for analysts and investors to illustrate market crashes, economic recession, or negative business growth trends in reports.
Free with trial Blue and red graph displays data dark background highlights vibrant blue and red lines. Generative AI. Background decrease decline illustrations Blue and red graph displays data dark background highlights vibrant blue and red lines. Generative AI
Free with trial A magnifying glass zooms in on an oil refinery, highlighting the intricate network of illuminated pipes and structures against a dark backdrop. In the background, a red downward arrow graph symbolizing economic decline is visible. The scene suggests a focus on the oil industry's economic challenges. The refinery's complex architecture is detailed, with metal textures contrasting against the glowing industrial lights, illustrating the tension between industrial growth and economic strain. Background decrease decline illustrations Magnifying glass focusing on oil refinery with red falling arrow graph representing economic decline. A magnifying glass zooms in on an oil refinery. A magnifying glass zooms in on an oil refinery, highlighting the intricate network of illuminated pipes and structures against a dark backdrop. In the background, a red downward arrow graph symbolizing economic decline is visible. The scene suggests a focus on the oil industry's economic challenges. The refinery's complex architecture is detailed, with metal textures contrasting against the glowing industrial lights, illustrating the tension between industrial growth and economic strain.
Free with trial Laptop screen showing downward red stock chart and yellow trend line, with dark abstract background. Concept of market crash and recession. 3D Rendering. Background decrease decline illustrations Laptop displaying red and yellow falling stock chart on dark geometric background, symbolizing financial crisis and market. Laptop screen showing downward red. Laptop screen showing downward red stock chart and yellow trend line, with dark abstract background. Concept of market crash and recession. 3D Rendering
Free with trial A vibrant illustration of a coin with a downward arrow, symbolizing financial loss or price reduction, set against a green background, conveying a clear message. Background decrease decline vectors Illustration of a coin with a downward arrow, indicating a decrease in value, , symbolizing financial loss or price reduction. A vibrant illustration of a coin. A vibrant illustration of a coin with a downward arrow, symbolizing financial loss or price reduction, set against a green background, conveying a clear message
Free with trial Bear represents falling stock market on red chart background. Financial graph shows investment loss, price decrease. Bearish concept symbolizes economic recession, downturn global. Background decrease decline illustrations Bear represents falling stock market on red chart background. Financial graph shows investment loss, price decrease. Bearish. Concept symbolizes economic. Bear represents falling stock market on red chart background. Financial graph shows investment loss, price decrease. Bearish concept symbolizes economic recession, downturn global.
 Sign in