Free with trial Graphic element displays contrasting financial indicators featuring a jagged green arrow pointing up signifying growth alongside a similar red arrow pointing sharply down representing decline or market correction. Background decrease decline vectors Graphic representation contrasting upward trending market growth with sharp downward trending financial decline. Graphic element displays contrasting financial. Graphic element displays contrasting financial indicators featuring a jagged green arrow pointing up signifying growth alongside a similar red arrow pointing sharply down representing decline or market correction
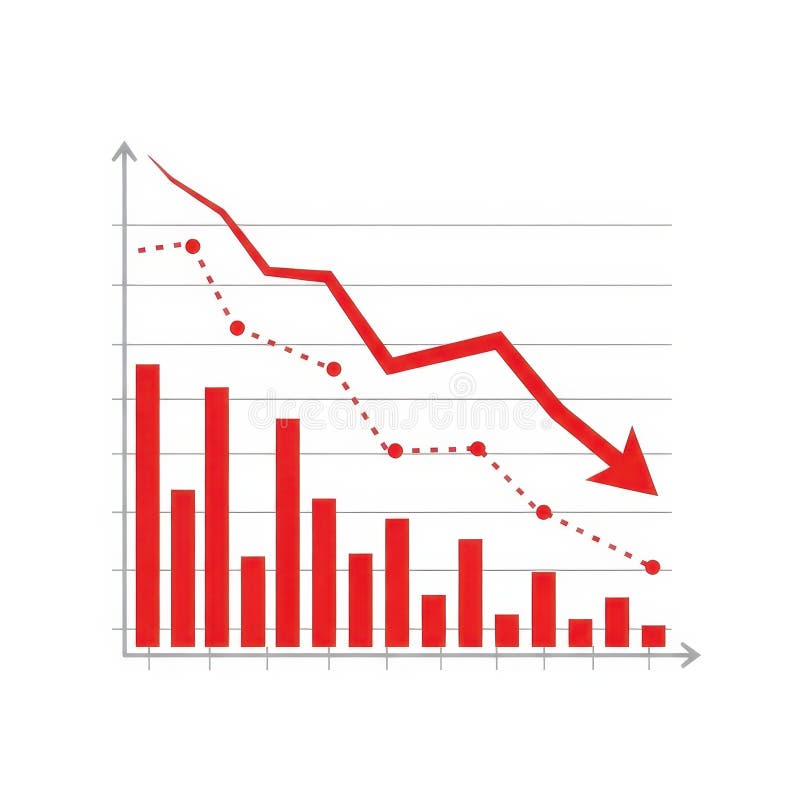
Free with trial This image shows a bar graph with a downward trend, indicated by a red arrow. It represents a decline in business, finance, or the economy, isolated on white. Background decrease decline illustrations A bar graph showing a downward trend with a red arrow isolated on white background. This image shows a bar graph with a downward trend, indicated by a red arrow. This image shows a bar graph with a downward trend, indicated by a red arrow. It represents a decline in business, finance, or the economy, isolated on white
Free with trial A hand in a suit jacket holds up an upward arrow for quality and a downward arrow for cost against a dark background with glowing particles. Background decrease decline illustrations Hand holding upward quality and downward cost percentages business open palm. A hand in a suit jacket holds up an upward arrow for quality and a downward arrow. A hand in a suit jacket holds up an upward arrow for quality and a downward arrow for cost against a dark background with glowing particles
Free with trial A striking white sculpture, generated by AI, depicts a figure slumping as a descending graph dramatically falls to the ground, symbolizing market downturn or economic crisis. The stark contrast between the white sculpture and the gray background emphasizes the gravity of the situation. The image i. Background decrease decline illustrations AI-Generated Sculpture: Market Crash. A striking white sculpture, generated by AI, depicts a figure slumping as a descending graph dramatically falls to the. A striking white sculpture, generated by AI, depicts a figure slumping as a descending graph dramatically falls to the ground, symbolizing market downturn or economic crisis. The stark contrast between the white sculpture and the gray background emphasizes the gravity of the situation. The image i
Free with trial A hand with a finger touching a holographic blue downward arrow displayed on a transparent screen above a desk with a laptop in the background. The setting appears to be a modern office with a. Background decrease decline illustrations Hand touching holographic downward arrow on a desk with laptop finger blue. A hand with a finger touching a holographic blue downward arrow displayed on a. A hand with a finger touching a holographic blue downward arrow displayed on a transparent screen above a desk with a laptop in the background. The setting appears to be a modern office with a
Free with trial A stock chart illustrates a bearish trend with red and green candlesticks against a dark blue background, used for financial analysis. Background decrease decline illustrations Stock Chart Showing Downward Trend. A stock chart illustrates a bearish trend with red and green candlesticks against a dark blue background, used for financial. A stock chart illustrates a bearish trend with red and green candlesticks against a dark blue background, used for financial analysis
Free with trial A visual representation of economic downturn shows a declining graph, a downward arrow, and a falling coin, conveying a sense of loss and financial instability perfect for illustrating business reports or financial articles. Background decrease decline vectors Financial decline graph with downward arrow and coin. A visual representation of economic downturn shows a declining graph, a downward arrow, and a falling coin. A visual representation of economic downturn shows a declining graph, a downward arrow, and a falling coin, conveying a sense of loss and financial instability perfect for illustrating business reports or financial articles
Free with trial Bull vs bear symbol of stock exchange market background. Vector. Background decrease decline vectors Bull vs bear symbol of stock exchange market background. Vector
Free with trial Bullish profit vs bearish loss stock trading background. Vector. Background decrease decline vectors Bullish profit vs bearish loss stock trading background. Vector
Free with trial A modern 3D rendering of a vertical bar graph titled COST ANALYSIS displays multiple stacked bars of varying heights representing different percentages, with the tallest green bar at the bottom and shorter blue bars ascending upward against a dark blue background featuring a subtle grid pattern, creating a professional data visualization for financial reports, business presentations, or analytical. Background decrease decline illustrations 3D rendered bar graph chart showing cost analysis with percentage data visualization in green and blue colors on dark background. A modern 3D rendering of a. A modern 3D rendering of a vertical bar graph titled COST ANALYSIS displays multiple stacked bars of varying heights representing different percentages, with the tallest green bar at the bottom and shorter blue bars ascending upward against a dark blue background featuring a subtle grid pattern, creating a professional data visualization for financial reports, business presentations, or analytical
Free with trial A simple bar chart and line graph with a downward arrow illustrates a negative trend like recession or business failure ideal for financial reports about crisis or loss. Background decrease decline illustrations Declining Blue Bar Chart and Line Graph Showing Financial Loss on Gray Background. A simple bar chart and line graph with a downward arrow illustrates a negative. A simple bar chart and line graph with a downward arrow illustrates a negative trend like recession or business failure ideal for financial reports about crisis or loss
Free with trial A glowing neon arrow points downwards, symbolizing a negative trend or decline, set against a dark, textured wall and wet floor. Background decrease decline illustrations Neon Downward Trend Arrow on Dark Textured Background. A glowing neon arrow points downwards, symbolizing a negative trend or decline, set against a dark. A glowing neon arrow points downwards, symbolizing a negative trend or decline, set against a dark, textured wall and wet floor
Free with trial A persons hands are silhouetted as they type on a laptop keyboard, with a vibrant, glowing green and blue arrow pointing downwards in the background, illustrating a concept of financial loss or market downturn. Background decrease decline illustrations Laptop user with glowing downward arrow symbolizing financial market decline. A persons hands are silhouetted as they type on a laptop keyboard, with a vibrant. A persons hands are silhouetted as they type on a laptop keyboard, with a vibrant, glowing green and blue arrow pointing downwards in the background, illustrating a concept of financial loss or market downturn
Free with trial A hand in a suit holds a glowing red bar graph with a downward arrow indicating a decline. The image is lit with red and blue light. Background decrease decline illustrations Hand holding glowing red downward trending bar graph with arrow chart business. A hand in a suit holds a glowing red bar graph with a downward arrow indicating a. A hand in a suit holds a glowing red bar graph with a downward arrow indicating a decline. The image is lit with red and blue light
Free with trial Polished silver curved downward directional arrow, rendered as a sleek isolated metallic design. Perfect for illustrating financial decline, business downturns, directional navigation, or as a UI graphic for presentations and marketing assets , minimalist background. Background decrease decline vectors Silver Arrow Points Downward, Representing Decline or Direction, Simple Design. Polished silver curved downward directional arrow, rendered as a sleek isolated. Polished silver curved downward directional arrow, rendered as a sleek isolated metallic design. Perfect for illustrating financial decline, business downturns, directional navigation, or as a UI graphic for presentations and marketing assets , minimalist background
Free with trial A snarling brown bear symbolizes a bear market, with a declining stock chart and red candlestick graph, illustrating financial downturn and investment losses against a dark red background. Background decrease decline illustrations Bear Market Snarl: Stock Chart Downtrend, Candlestick Graph Plunge. A snarling brown bear symbolizes a bear market, with a declining stock chart and red. A snarling brown bear symbolizes a bear market, with a declining stock chart and red candlestick graph, illustrating financial downturn and investment losses against a dark red background
Free with trial A businessman in a suit draws a red downward trend line over a bar graph, illustrating cost reduction and financial decline. Background decrease decline illustrations Businessman Drawing a Downward Trend Line on a Cost Graph. A businessman in a suit draws a red downward trend line over a bar graph, illustrating cost reduction. A businessman in a suit draws a red downward trend line over a bar graph, illustrating cost reduction and financial decline
Free with trial A glossy red 3D arrow charts a jagged downward path, symbolizing economic crisis, stock market crash, or business failure against a dark, minimalist background. Background decrease decline illustrations Glossy Red Jagged Arrow Charting a Steep Financial Decline. A glossy red 3D arrow charts a jagged downward path, symbolizing economic crisis, stock market crash. A glossy red 3D arrow charts a jagged downward path, symbolizing economic crisis, stock market crash, or business failure against a dark, minimalist background.
Free with trial A 3D illustration depicts a financial chart with a downward trend. Four vertical bars, colored yellow, orange, and green, are arranged in descending order of height, suggesting a decline. To the left, a prominent orange circle contains a white downward-pointing arrow, reinforcing the theme of a negative trend or decrease. The entire composition is set against a plain white background. Background decrease decline illustrations Financial chart with downward trend indicator stock market. A 3D illustration depicts a financial chart with a downward trend. Four vertical bars, colored yellow. A 3D illustration depicts a financial chart with a downward trend. Four vertical bars, colored yellow, orange, and green, are arranged in descending order of height, suggesting a decline. To the left, a prominent orange circle contains a white downward-pointing arrow, reinforcing the theme of a negative trend or decrease. The entire composition is set against a plain white background
Free with trial A bright red 3D arrow, composed of individual rectangular segments that form a curved shape, points downwards and to the right. The arrow's head is a distinct triangular shape. The object is presented against a clean white background, isolating its form and direction. Background decrease decline illustrations Red 3D Arrow Forming a Curve Pointing Downward on White Background image photo. A bright red 3D arrow, composed of individual rectangular segments that form a. A bright red 3D arrow, composed of individual rectangular segments that form a curved shape, points downwards and to the right. The arrow's head is a distinct triangular shape. The object is presented against a clean white background, isolating its form and direction
Free with trial A vibrant and diverse set of financial icons, including symbols for money, growth, and profit, as well as various charts and graphs. The icons are colorful and modern, making them perfect for use in business presentations, reports, and marketing materials. The white background provides a clean and neutral space for the icons to stand out, allowing for easy customization and integration into various designs. Background decrease decline vectors A collection of colorful financial icons on a white background for business use. A vibrant and diverse set of financial icons, including symbols for money. A vibrant and diverse set of financial icons, including symbols for money, growth, and profit, as well as various charts and graphs. The icons are colorful and modern, making them perfect for use in business presentations, reports, and marketing materials. The white background provides a clean and neutral space for the icons to stand out, allowing for easy customization and integration into various designs.
Free with trial The image shows a large, downward-pointing arrow with a gradient fill that transitions from a lighter pinkish-red at the top to a darker, deep red at the tip. The arrow has a sleek, modern design with smooth curves and a pointed end, emphasizing a downward direction. Background decrease decline illustrations A bold downward-pointing arrow with a gradient effect from light to dark red. isolated on white background. The image shows a large, downward-pointing arrow with. The image shows a large, downward-pointing arrow with a gradient fill that transitions from a lighter pinkish-red at the top to a darker, deep red at the tip. The arrow has a sleek, modern design with smooth curves and a pointed end, emphasizing a downward direction
Free with trial Diagonal down left arrow symbol set in outline and solid styles suitable for navigation controls, trend decrease indicators, return actions, directional guidance, and interface elements. Background decrease decline vectors Arrow Diagonal Down Left Icon Collection in Line and Solid Style for Direction. Diagonal down left arrow symbol set in outline and solid styles suitable for. Diagonal down left arrow symbol set in outline and solid styles suitable for navigation controls, trend decrease indicators, return actions, directional guidance, and interface elements
Free with trial A 3D render of a red thermometer with a white liquid column indicating a low temperature, positioned next to a blue square icon featuring three white downward-pointing arrows. The objects are isolated on a clean white background, suggesting a concept of decreasing temperature or a negative trend. Background decrease decline illustrations Red Thermometer Icon With Down Arrow Symbol On White Background temperature cold. A 3D render of a red thermometer with a white liquid column indicating a low. A 3D render of a red thermometer with a white liquid column indicating a low temperature, positioned next to a blue square icon featuring three white downward-pointing arrows. The objects are isolated on a clean white background, suggesting a concept of decreasing temperature or a negative trend
Free with trial Visual representation of financial trends with euro symbols, depicting both upward and downward movements in bar graph format, suitable for economic analysis. Background decrease decline vectors Bar charts showing euro currency growth and decline isolated on transparent background. Visual representation of financial trends with euro symbols, depicting. Visual representation of financial trends with euro symbols, depicting both upward and downward movements in bar graph format, suitable for economic analysis
Free with trial A golden percentage symbol (%) with a red and blue financial graph representing stock market analysis, trends, and fluctuations. Ideal for financial reports, investments, and economic topics. Background decrease decline illustrations Gold Percentage Symbol with Red and Blue Financial Graph Background. A golden percentage symbol (%) with a red and blue financial graph representing stock market. A golden percentage symbol (%) with a red and blue financial graph representing stock market analysis, trends, and fluctuations. Ideal for financial reports, investments, and economic topics.
Free with trial A golden percentage symbol (%) with a red and blue financial graph representing stock market analysis, trends, and fluctuations. Ideal for financial reports, investments, and economic topics. Background decrease decline illustrations Gold Percentage Symbol with Red and Blue Financial Graph Background. A golden percentage symbol (%) with a red and blue financial graph representing stock market. A golden percentage symbol (%) with a red and blue financial graph representing stock market analysis, trends, and fluctuations. Ideal for financial reports, investments, and economic topics.
Free with trial A stark visual representation of financial decline. A stack of gleaming gold coins is depicted, with a prominent red arrow pointing downwards, symbolizing a significant drop in value or economic downturn. The clean, white background emphasizes the core elements, making it ideal for conveying concepts of recession, loss, market crash, or financial instability. Background decrease decline illustrations Financial Crisis: Falling Gold Coins and Red Downward Arrow. A stark visual representation of financial decline. A stack of gleaming gold coins is depicted, with. A stark visual representation of financial decline. A stack of gleaming gold coins is depicted, with a prominent red arrow pointing downwards, symbolizing a significant drop in value or economic downturn. The clean, white background emphasizes the core elements, making it ideal for conveying concepts of recession, loss, market crash, or financial instability.
Free with trial A simple 3D icon featuring a white downward-pointing arrow within a blue circle, presented on a white background, perfect for indicating downloads or direction. Background decrease decline illustrations Blue circle with white down arrow isolated on white background. A simple 3D icon featuring a white downward-pointing arrow within a blue circle, presented on a. A simple 3D icon featuring a white downward-pointing arrow within a blue circle, presented on a white background, perfect for indicating downloads or direction
Free with trial Red arrow graph depicts a stock market decline, moving downward with sharp angles against a white background. The thick arrow starts at the top left, zigzagging before terminating at the bottom right. Red color symbolizes economic downturn or decrease in financial value. Simple, stark design emphasizes decline theme commonly used in financial visuals to depict negative market trends or financial losses. Background decrease decline illustrations Red Downward Arrow Graph: Stock Market Decline Illustration. Red arrow graph depicts a stock market decline, moving downward with sharp angles against a white. Red arrow graph depicts a stock market decline, moving downward with sharp angles against a white background. The thick arrow starts at the top left, zigzagging before terminating at the bottom right. Red color symbolizes economic downturn or decrease in financial value. Simple, stark design emphasizes decline theme commonly used in financial visuals to depict negative market trends or financial losses.
Free with trial A vibrant red arrow points downward, resting on a silver coin, signifying a market decline. This 3D rendering, generated by AI, visually represents economic downturn or price reduction. Use it to illustrate concepts related to financial loss, market trends, and economic instability. Background decrease decline illustrations Falling Prices. A vibrant red arrow points downward, resting on a silver coin, signifying a market decline. This 3D rendering, generated by AI, visually. A vibrant red arrow points downward, resting on a silver coin, signifying a market decline. This 3D rendering, generated by AI, visually represents economic downturn or price reduction. Use it to illustrate concepts related to financial loss, market trends, and economic instability.
Free with trial A 3D bar graph illustrating a downward trend with a green arrow, featuring a heart icon with a minus sign, on a white background. Background decrease decline illustrations 3D bar graph with a downward trending green arrow and a heart icon with a minus sign chart. A 3D bar graph illustrating a downward trend with a green arrow. A 3D bar graph illustrating a downward trend with a green arrow, featuring a heart icon with a minus sign, on a white background
Free with trial A 3D illustration of a financial chart showing a dramatic downward trend. A large red arrow points sharply down over a series of declining blue bar graphs, symbolizing a stock market crash, economic recession, or business failure. The background features complex data and grids, representing financial analysis and market data. This image is perfect for concepts related to economic crisis, investment loss, financial risk, bankruptcy, and negative business reports. Background decrease decline illustrations Stock Market Crash Financial Graph. A 3D illustration of a financial chart showing a dramatic downward trend. A large red arrow points sharply down over a series. A 3D illustration of a financial chart showing a dramatic downward trend. A large red arrow points sharply down over a series of declining blue bar graphs, symbolizing a stock market crash, economic recession, or business failure. The background features complex data and grids, representing financial analysis and market data. This image is perfect for concepts related to economic crisis, investment loss, financial risk, bankruptcy, and negative business reports.
Free with trial A collection of Indian Rupee symbols presented in circular and square icons, some featuring downward-pointing arrows indicating a decrease in value. A stack of golden coins is also depicted. The icons are arranged in a grid on a white background. Background decrease decline illustrations Indian Rupee Currency Symbols with Downward Arrows and Stacked Coins money finance. A collection of Indian Rupee symbols presented in circular and square icons. A collection of Indian Rupee symbols presented in circular and square icons, some featuring downward-pointing arrows indicating a decrease in value. A stack of golden coins is also depicted. The icons are arranged in a grid on a white background
Free with trial Market crash concept neon 3d decreasing sign negative business trend failure trading bad statistics poor performance risk danger diagram screen display global recession virtual data. Background decrease decline illustrations Glowing red downward zigzag arrow glass square button blurred financial stock market graph chart background economic crisis. Market crash concept neon 3d. Market crash concept neon 3d decreasing sign negative business trend failure trading bad statistics poor performance risk danger diagram screen display global recession virtual data
Free with trial Four wooden blocks are arranged in a step-like formation, spelling out the word "COST". Each block features a red downward-pointing arrow, indicating a reduction or decrease. The blocks are on a white background, with a hand about to place the last block. This image visually represents the concept of cost reduction and financial savings. Background decrease decline illustrations Wooden blocks spelling COST with downward arrows. Four wooden blocks are arranged in a step-like formation, spelling out the word 'COST'. Each block features a. Four wooden blocks are arranged in a step-like formation, spelling out the word "COST". Each block features a red downward-pointing arrow, indicating a reduction or decrease. The blocks are on a white background, with a hand about to place the last block. This image visually represents the concept of cost reduction and financial savings
Free with trial A black icon illustrating a falling stock market graph with a prominent downward arrow. Background decrease decline illustrations Black icon of a falling stock market graph with a downward arrow on a white background. A black icon illustrating a falling stock market graph with a prominent. A black icon illustrating a falling stock market graph with a prominent downward arrow
Free with trial Statistics and analysis concept. With bottom view on graphs and stats indicators on dark squared background. 3D rendering. Background decrease decline illustrations Statistics and analysis concept. With bottom view on graphs and stats indicators on dark squared background. 3D rendering
Free with trial A line drawing of a magnifying glass focusing on a podcast microphone icon and a declining bar graph with a downward. Background decrease decline illustrations Podcast Analytics Decline Magnifying Glass, Downward Trend. A line drawing of a magnifying glass focusing on a podcast microphone icon and a declining bar graph. A line drawing of a magnifying glass focusing on a podcast microphone icon and a declining bar graph with a downward.
Free with trial Stock Market Crash Red Button. Pointer with downward arrow on the gray mirror background. Eps 10 vector file. Background decrease decline vectors Stock Market Crash Red Button. Pointer with downward arrow on the gray mirror background. Eps 10 vector file
Free with trial A dynamic 3D rendering of a bar graph, depicting a downward trend with vibrant red bars and a prominent white arrow pointing downwards. The scene is set against a dark, subtly textured background, creating a dramatic visual contrast. This image effectively symbolizes decline, loss, negative financial trends, or challenges in business. Background decrease decline illustrations 3D Bar Graph with Declining Red Bars and White Arrow Ai Generated. A dynamic 3D rendering of a bar graph, depicting a downward trend with vibrant red bars and a. A dynamic 3D rendering of a bar graph, depicting a downward trend with vibrant red bars and a prominent white arrow pointing downwards. The scene is set against a dark, subtly textured background, creating a dramatic visual contrast. This image effectively symbolizes decline, loss, negative financial trends, or challenges in business.
Free with trial A surreal conceptual illustration depicting a house with a red roof floating amidst soft pink clouds. Numerous pink arrows rain down from the sky, pointing downwards to symbolize a decline. This powerful visual metaphor represents the real estate market crash, falling property prices, the bursting of the housing bubble, and economic recession. The dreamlike, unstable setting is ideal for topics on financial risk, mortgage crisis, investment depreciation, and the volatility of the property market. A creative 3D render for business and finance concepts. Background decrease decline illustrations Real Estate Market Crash and Falling Property Prices Concept. A surreal conceptual illustration depicting a house with a red roof floating amidst soft pink. A surreal conceptual illustration depicting a house with a red roof floating amidst soft pink clouds. Numerous pink arrows rain down from the sky, pointing downwards to symbolize a decline. This powerful visual metaphor represents the real estate market crash, falling property prices, the bursting of the housing bubble, and economic recession. The dreamlike, unstable setting is ideal for topics on financial risk, mortgage crisis, investment depreciation, and the volatility of the property market. A creative 3D render for business and finance concepts.
Free with trial Falling pound sterling coin with bar graph. Bar graph shows decline with pound sterling coin at end of graph. Background decrease decline vectors Falling pound sterling coin with bar graph. Bar graph shows decline with pound sterling coin at end of graph
Free with trial This image features four different types of graphs and charts that illustrate various trends and data analysis. These visual representations include bar graphs, line graphs, and 3D block charts. Background decrease decline illustrations Graphs and charts showing trends and data analysis isolated on transparent background. This image features four different types of graphs and charts that. This image features four different types of graphs and charts that illustrate various trends and data analysis. These visual representations include bar graphs, line graphs, and 3D block charts
Free with trial A single, glossy green arrow pointing downwards, captured in a studio setting against a stark white background. This isolated object emphasizes concepts of reduction, decrease, or negative movement wi. Background decrease decline illustrations Green arrow pointing downwards, isolated on white background. A single, glossy green arrow pointing downwards, captured in a studio setting against a stark white. A single, glossy green arrow pointing downwards, captured in a studio setting against a stark white background. This isolated object emphasizes concepts of reduction, decrease, or negative movement wi
Free with trial Graphic illustration of a downward trending red arrow over blue and red vertical bar graph on a light grey background. Image. Background decrease decline illustrations Bar Graph with Decreasing Trend Line. Graphic illustration of a downward trending red arrow over blue and red vertical bar graph on a light grey background. AI. Graphic illustration of a downward trending red arrow over blue and red vertical bar graph on a light grey background. Image
Free with trial Black line graph with downward trend arrow on white background vector illustration. Black line graph with downward trend arrow on white background. Background decrease decline vectors Black line graph with downward trend arrow on white background vector illustration. Black line graph with downward trend arrow on white background
Free with trial Graphic illustration showing downward trend with falling blocks design. Isolated on transparent background downward arrow made of scattered red blocks. Background decrease decline illustrations Graphic illustration showing downward trend with falling blocks design. Isolated on transparent background downward arrow made of scattered red blocks
Free with trial The image shows five wooden figures arranged in a row, decreasing in size from left to right. A red arrow points downwards from the largest figure on the left to the smallest figure on the right. The background is a solid blue color. Background decrease decline illustrations Wooden figures decreasing in size with a red arrow pointing downwards. The image shows five wooden figures arranged in a row, decreasing in size from left to. The image shows five wooden figures arranged in a row, decreasing in size from left to right. A red arrow points downwards from the largest figure on the left to the smallest figure on the right. The background is a solid blue color
Free with trial This image visually represents the concept of "Falling Prices" using letters formed from vibrant autumn leaves. The warm hues of red, orange, and yellow leaves create a festive and seasonal atmosphere. The text is layered over a soft, blurred background, drawing attention to the message. Below the text, a scattering of fallen leaves, some dusted with a hint of frost or snow, reinforces the autumn theme and the idea of a seasonal sale or clearance event. This image is ideal for advertising promotions, discounts, and end-of-season sales. Background decrease decline illustrations Falling Prices Autumn Sale Concept. This image visually represents the concept of 'Falling Prices' using letters formed from vibrant autumn leaves. The warm hues. This image visually represents the concept of "Falling Prices" using letters formed from vibrant autumn leaves. The warm hues of red, orange, and yellow leaves create a festive and seasonal atmosphere. The text is layered over a soft, blurred background, drawing attention to the message. Below the text, a scattering of fallen leaves, some dusted with a hint of frost or snow, reinforces the autumn theme and the idea of a seasonal sale or clearance event. This image is ideal for advertising promotions, discounts, and end-of-season sales.
Free with trial An abstract 3D rendering visually representing the concept of 'LOSS'. The prominent white text 'LOSS' is superimposed over a stack of dark, metallic, fluid-like shapes that appear to be collapsing or compressing under pressure. A powerful red, glowing energy beam erupts from beneath this structure, symbolizing impact, crisis, or a significant downturn. Small, dark, reflective cubes float in the dark grey background, adding to the abstract, digital aesthetic. This image effectively conveys themes of financial decline, business failure, data loss, or any form of significant reduction and negative consequence. Background decrease decline illustrations Loss Concept with Abstract Energy and Collapsing Structure. An abstract 3D rendering visually representing the concept of 'LOSS'. The prominent white text 'LOSS. An abstract 3D rendering visually representing the concept of 'LOSS'. The prominent white text 'LOSS' is superimposed over a stack of dark, metallic, fluid-like shapes that appear to be collapsing or compressing under pressure. A powerful red, glowing energy beam erupts from beneath this structure, symbolizing impact, crisis, or a significant downturn. Small, dark, reflective cubes float in the dark grey background, adding to the abstract, digital aesthetic. This image effectively conveys themes of financial decline, business failure, data loss, or any form of significant reduction and negative consequence.
Free with trial International trade war dispute concept background. Vector. Background decrease decline vectors International trade war dispute concept background. Vector
Free with trial A glossy red arrow curves downwards indicating a significant decline or negative trend. A sharp, reflective red arrow points downward on a neutral background. Background decrease decline illustrations A glossy red arrow curves downwards indicating a significant decline or negative trend. A sharp, reflective red arrow points downward on a neutral background
Free with trial A man in a dark suit and blue tie points with a glowing pen at a bar graph showing declining profits and increasing costs. Background decrease decline illustrations Businessman pointing at declining profits graph with increasing costs chart decline. A man in a dark suit and blue tie points with a glowing pen at a bar graph. A man in a dark suit and blue tie points with a glowing pen at a bar graph showing declining profits and increasing costs
Free with trial A red and yellow financial chart depicts a steep downward trend. Red candlestick bars form the base, with yellow lines showing price fluctuations. A large yellow arrow clearly indicates a sharp decline, suggesting a significant market drop. Background decrease decline illustrations Red and Yellow Stock Market Chart with Steep Downward Trend. A red and yellow financial chart depicts a steep downward trend. Red candlestick bars form the base. A red and yellow financial chart depicts a steep downward trend. Red candlestick bars form the base, with yellow lines showing price fluctuations. A large yellow arrow clearly indicates a sharp decline, suggesting a significant market drop
Free with trial A vibrant purple arrow points downwards, landing in a glowing circle on a landscape with fiery lava, suggesting a market downturn or decline for investment analysis. Background decrease decline illustrations Market Dip Arrow Down with Glowing Circle. A vibrant purple arrow points downwards, landing in a glowing circle on a landscape with fiery lava, suggesting a. A vibrant purple arrow points downwards, landing in a glowing circle on a landscape with fiery lava, suggesting a market downturn or decline for investment analysis
Free with trial Bull vs bear global stock volatility background with dollar sign. Vector. Background decrease decline vectors Bull vs bear global stock volatility background with dollar sign. Vector
Free with trial A visual representation of negative financial performance, illustrating a significant downward trend with a red arrow pointing downwards, indicating a loss or decline in value. Background decrease decline illustrations Red graph showing a downward trend isolated on white background. A visual representation of negative financial performance, illustrating a significant downward. A visual representation of negative financial performance, illustrating a significant downward trend with a red arrow pointing downwards, indicating a loss or decline in value
Free with trial A simple black line graph icon showing a downward trend with zigzag steps, representing decline, loss, or negative growth, isolated on white background. Background decrease decline vectors Downward trend line graph icon. A simple black line graph icon showing a downward trend with zigzag steps, representing decline, loss, or negative growth. A simple black line graph icon showing a downward trend with zigzag steps, representing decline, loss, or negative growth, isolated on white background
Free with trial Financial profit decreasing. Money loss concept. Stacked golden coins and red arrow moving downward indicate financial decline. Economic recession shown with falling revenue. Background decrease decline illustrations Decreasing financial profit concept with red arrow trending down and stack of golden coins on white background. Financial profit decreasing. Money loss concept. Financial profit decreasing. Money loss concept. Stacked golden coins and red arrow moving downward indicate financial decline. Economic recession shown with falling revenue
Free with trial A simple graph illustration with red dots connected by black lines, representing data trends and statistical analysis on a clean, white background. Background decrease decline vectors Vector art of red dots connected by black lines forming a graph. A simple graph illustration with red dots connected by black lines, representing data trends and. A simple graph illustration with red dots connected by black lines, representing data trends and statistical analysis on a clean, white background
Free with trial An illustration depicting a row of houses and coins falling on a downward arrow, symbolizing a decline in the housing market or real estate values. The image features a red background with a wavy line and a large red arrow pointing downwards, conveying a sense of decrease or recession. Background decrease decline illustrations Houses on a Downward Trend. An illustration depicting a row of houses and coins falling on a downward arrow, symbolizing a decline in the housing market or real. An illustration depicting a row of houses and coins falling on a downward arrow, symbolizing a decline in the housing market or real estate values. The image features a red background with a wavy line and a large red arrow pointing downwards, conveying a sense of decrease or recession.
Free with trial A percentage sign is displayed with a yellow arrow pointing downwards, indicating a decrease in rates or financial loss. The image is isolated on a white surface, with a yellow base, symbolizing economic decline. Background decrease decline illustrations Percentage sign with downward arrow isolated on white background. use cases: finance, economy. A percentage sign is displayed with a yellow arrow pointing. A percentage sign is displayed with a yellow arrow pointing downwards, indicating a decrease in rates or financial loss. The image is isolated on a white surface, with a yellow base, symbolizing economic decline
Free with trial A white rectangular featuring a bar chart with blue and gray bars and a line graph with blue and gray lines. Upward and downward arrows with horizontal bars are positioned to the right of the. Background decrease decline illustrations Blue and gray bar chart with upward and downward arrows on a white background line graph. A white rectangular featuring a bar chart with blue and gray bars and a. A white rectangular featuring a bar chart with blue and gray bars and a line graph with blue and gray lines. Upward and downward arrows with horizontal bars are positioned to the right of the
Free with trial A downward trending red arrow, generated by AI, rests on a smartphone displaying a graph, symbolizing a market decline. This visualization is a powerful representation of negative financial trends and economic downturn, ideal for illustrating news reports or financial analyses. Background decrease decline illustrations Mobile Market Crash. A downward trending red arrow, generated by AI, rests on a smartphone displaying a graph, symbolizing a market decline. This visualization. A downward trending red arrow, generated by AI, rests on a smartphone displaying a graph, symbolizing a market decline. This visualization is a powerful representation of negative financial trends and economic downturn, ideal for illustrating news reports or financial analyses.
Free with trial Simple hand-drawn chart with black zigzag lines and red and green arrows on White background, showing market movement,. Hand-drawn market trend chart with arrows. Background decrease decline illustrations Simple hand-drawn chart with black zigzag lines and red and green arrows on White background, showing market movement,. Hand-drawn market trend chart with arrows
Free with trial Flat depicting the impact of rising fuel prices on society and economy. A central gas pump with soaring prices and a large orange upward arrow connects to a truck climbing uphill, a man pushing a car, a family, and declining coin stacks. Industrial city skyline in background. Concept of inflation, energy crisis, transportation cost. Ideal for articles, presentations, and reports on economics, fuel, and cost of living. Background decrease decline vectors Rising Fuel Prices Impact on Economy Illustration. Flat depicting the impact of rising fuel prices on society and economy. A central gas pump with soaring prices. Flat depicting the impact of rising fuel prices on society and economy. A central gas pump with soaring prices and a large orange upward arrow connects to a truck climbing uphill, a man pushing a car, a family, and declining coin stacks. Industrial city skyline in background. Concept of inflation, energy crisis, transportation cost. Ideal for articles, presentations, and reports on economics, fuel, and cost of living.
Free with trial Flat of a motorcyclist riding on a winding road surrounded by fuel pumps, gas cans, oil drops, gears, and financial charts with rising and falling arrows. Features dollar signs, wrenches, and maintenance symbols in red, orange and yellow tones on white background. Represents rising fuel costs, motorcycle maintenance expenses, energy consumption and transportation economy. Ideal for articles, blogs and marketing about gasoline prices, inflation, vehicle service and fuel efficiency. Background decrease decline vectors Motorcycle Rider With Fuel Price Increase Concept. Flat of a motorcyclist riding on a winding road surrounded by fuel pumps, gas cans, oil drops, gears, and. Flat of a motorcyclist riding on a winding road surrounded by fuel pumps, gas cans, oil drops, gears, and financial charts with rising and falling arrows. Features dollar signs, wrenches, and maintenance symbols in red, orange and yellow tones on white background. Represents rising fuel costs, motorcycle maintenance expenses, energy consumption and transportation economy. Ideal for articles, blogs and marketing about gasoline prices, inflation, vehicle service and fuel efficiency.
Free with trial A visual representation of a stock market candlestick chart is depicted with a downward trend. The chart features alternating red and green candlesticks, indicating price fluctuations. A subtle shadow is cast on the white background, adding depth to the financial data visualization. Background decrease decline illustrations Downward Trending Stock Market Candlestick Chart with Red and Green Bars and Shadow finance. A visual representation of a stock market candlestick chart is. A visual representation of a stock market candlestick chart is depicted with a downward trend. The chart features alternating red and green candlesticks, indicating price fluctuations. A subtle shadow is cast on the white background, adding depth to the financial data visualization
Free with trial Vector depicting rising fuel costs and economic inflation with a gas pump nozzle dripping fuel over a small car, upward red and blue arrows, bar charts, falling coins, shopping cart, and weight symbols indicating pressure. Isolated on white background in flat modern style. Ideal for articles, presentations and reports about gasoline prices, energy crisis, cost of living, recession, budgeting and financial markets. Background decrease decline vectors Rising Fuel Prices and Inflation Economic Concept. Vector depicting rising fuel costs and economic inflation with a gas pump nozzle dripping fuel over a small. Vector depicting rising fuel costs and economic inflation with a gas pump nozzle dripping fuel over a small car, upward red and blue arrows, bar charts, falling coins, shopping cart, and weight symbols indicating pressure. Isolated on white background in flat modern style. Ideal for articles, presentations and reports about gasoline prices, energy crisis, cost of living, recession, budgeting and financial markets.
Free with trial Clean showing 3d icon of a pound sterling symbol with a downward arrow indicating decrease. Background decrease decline illustrations 3D Icon of a Pound Sterling Symbol with a Downward Arrow Indicating Decrease. Clean showing 3d icon of a pound sterling symbol with a downward arrow indicating. Clean showing 3d icon of a pound sterling symbol with a downward arrow indicating decrease
Free with trial Downward zigzag arrow icon. Simple black zigzag arrow pointing downward, indicating decline or zigzag movement. Background decrease decline illustrations Downward zigzag arrow icon. Simple black zigzag arrow pointing downward, indicating decline or zigzag movement
Free with trial Concept illustrating economic downturn. The image shows wooden blocks that spell out economy, partially collapsed and a red arrow pointing downwards, against a neutral backdrop. It conveys crisis, recession, financial challenges, and market decline. Useful for illustrating financial news, economic a. Background decrease decline illustrations Economy Downturn Concept, Wooden Blocks with Letters and Red Arrow. Business Crisis Illustration. Concept illustrating economic downturn. The image shows wooden. Concept illustrating economic downturn. The image shows wooden blocks that spell out economy, partially collapsed and a red arrow pointing downwards, against a neutral backdrop. It conveys crisis, recession, financial challenges, and market decline. Useful for illustrating financial news, economic a
Free with trial The image features a striking red zigzag arrow that begins at the top left and extends downwards to the bottom right, set against a clean white background. The arrow's zigzag pattern adds a sense of dynamic movement and volatility to the otherwise straightforward indication of a downward trend. The use of red for the arrow emphasizes the negative direction, drawing immediate attention to the. Background decrease decline illustrations A red zigzag arrow pointing downwards indicates a significant decline or downward trend. The image features a striking red zigzag arrow that begins at the top. The image features a striking red zigzag arrow that begins at the top left and extends downwards to the bottom right, set against a clean white background. The arrow's zigzag pattern adds a sense of dynamic movement and volatility to the otherwise straightforward indication of a downward trend. The use of red for the arrow emphasizes the negative direction, drawing immediate attention to the
Free with trial A yellow 3D percentage symbol and a downward pointing arrow are shown against a. Isolated on a transparent background. Background decrease decline vectors Yellow Percentage Symbol and Down Arrow isolated on a transparent background image. A yellow 3D percentage symbol and a downward pointing arrow are shown against. A yellow 3D percentage symbol and a downward pointing arrow are shown against a . Isolated on a transparent background
Free with trial The image shows a stylized financial graph with a clear downward trend, rendered in a copper-like material. it sits on a polished floor in a modern interior. the background features a blurred living space, including a window with bright light, a desk, a chair, and a lamp. the graph's reflection is visible on the floor, enhancing the visual impact of the economic decline. the overall mood is somber, reflecting the negative financial trend. Background decrease decline illustrations Financial downturn in modern interior space. The image shows a stylized financial graph with a clear downward trend, rendered in a copper-like material. it sits. the image shows a stylized financial graph with a clear downward trend, rendered in a copper-like material. it sits on a polished floor in a modern interior. the background features a blurred living space, including a window with bright light, a desk, a chair, and a lamp. the graph's reflection is visible on the floor, enhancing the visual impact of the economic decline. the overall mood is somber, reflecting the negative financial trend.
Free with trial Shopping Cart Icon with Downward Arrow, Black Outline on White Background, Symbol. For Declining Sales and Ecommerce Discount Strategy. Background decrease decline vectors Shopping Cart Icon with Downward Arrow, Black Outline on White Background, Symbol. For Declining Sales and Ecommerce Discount Strategy
Free with trial Orange bars show a decreasing trend with a bold red arrow pointing downwards. Isolated on a transparent background. Background decrease decline vectors Orange bar chart with red downward arrow isolated on a transparent background graph. Orange bars show a decreasing trend with a bold red arrow pointing downwards. Orange bars show a decreasing trend with a bold red arrow pointing downwards. Isolated on a transparent background
Free with trial A red 3D percentage symbol next to a white 3D downward pointing arrow. Isolated on a transparent background. Background decrease decline vectors Red percentage sign and white down arrow isolated on a transparent background image. A red 3D percentage symbol next to a white 3D downward pointing arrow. A red 3D percentage symbol next to a white 3D downward pointing arrow. Isolated on a transparent background
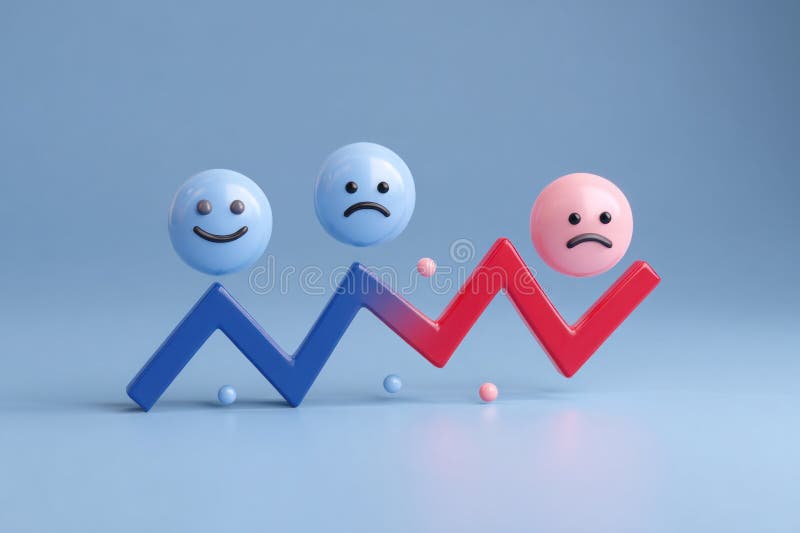
Free with trial 3d rendering of emojis with different mood placed on a blue and red graph showing decrease in customer satisfaction. Background decrease decline illustrations Customer satisfaction decreasing showing by emojis on graph going downward. 3d rendering of emojis with different mood placed on a blue and red graph showing. 3d rendering of emojis with different mood placed on a blue and red graph showing decrease in customer satisfaction
 Sign in