Free with trial Moldova flag with a declining bar chart and down arrows, symbolizing decline in data, performance, or various national indicators in the country. Background decrease decline illustrations Flag with a declining bar chart and down arrows. Moldova flag with a declining bar chart and down arrows, symbolizing decline in data, performance, or various. Moldova flag with a declining bar chart and down arrows, symbolizing decline in data, performance, or various national indicators in the country
Free with trial Kuwait flag with a declining bar chart and down arrows, symbolizing decline in data, performance, or various national indicators in the country. Background decrease decline illustrations Flag with a declining bar chart and down arrows. Kuwait flag with a declining bar chart and down arrows, symbolizing decline in data, performance, or various. Kuwait flag with a declining bar chart and down arrows, symbolizing decline in data, performance, or various national indicators in the country
Free with trial Laos flag with a declining bar chart and down arrows, symbolizing decline in data, performance, or various national indicators in the country. Background decrease decline illustrations Flag with a declining bar chart and down arrows. Laos flag with a declining bar chart and down arrows, symbolizing decline in data, performance, or various. Laos flag with a declining bar chart and down arrows, symbolizing decline in data, performance, or various national indicators in the country
Free with trial Mauritius flag with a declining bar chart and down arrows, symbolizing decline in data, performance, or various national indicators in the country. Background decrease decline illustrations Flag with a declining bar chart and down arrows. Mauritius flag with a declining bar chart and down arrows, symbolizing decline in data, performance, or various. Mauritius flag with a declining bar chart and down arrows, symbolizing decline in data, performance, or various national indicators in the country
Free with trial Iraq flag with a declining bar chart and down arrows, symbolizing decline in data, performance, or various national indicators in the country. Background decrease decline illustrations Flag with a declining bar chart and down arrows. Iraq flag with a declining bar chart and down arrows, symbolizing decline in data, performance, or various. Iraq flag with a declining bar chart and down arrows, symbolizing decline in data, performance, or various national indicators in the country
Free with trial Jamaica flag with a declining bar chart and down arrows, symbolizing decline in data, performance, or various national indicators in the country. Background decrease decline illustrations Flag with a declining bar chart and down arrows. Jamaica flag with a declining bar chart and down arrows, symbolizing decline in data, performance, or various. Jamaica flag with a declining bar chart and down arrows, symbolizing decline in data, performance, or various national indicators in the country
Free with trial Mali flag with a declining bar chart and down arrows, symbolizing decline in data, performance, or various national indicators in the country. Background decrease decline illustrations Flag with a declining bar chart and down arrows. Mali flag with a declining bar chart and down arrows, symbolizing decline in data, performance, or various. Mali flag with a declining bar chart and down arrows, symbolizing decline in data, performance, or various national indicators in the country
Free with trial Iceland flag with a declining bar chart and down arrows, symbolizing decline in data, performance, or various national indicators in the country. Background decrease decline illustrations Flag with a declining bar chart and down arrows. Iceland flag with a declining bar chart and down arrows, symbolizing decline in data, performance, or various. Iceland flag with a declining bar chart and down arrows, symbolizing decline in data, performance, or various national indicators in the country
Free with trial India flag with a declining bar chart and down arrows, symbolizing decline in data, performance, or various national indicators in the country. Background decrease decline illustrations Flag with a declining bar chart and down arrows. India flag with a declining bar chart and down arrows, symbolizing decline in data, performance, or various. India flag with a declining bar chart and down arrows, symbolizing decline in data, performance, or various national indicators in the country
Free with trial Lebanon flag with a declining bar chart and down arrows, symbolizing decline in data, performance, or various national indicators in the country. Background decrease decline illustrations Flag with a declining bar chart and down arrows. Lebanon flag with a declining bar chart and down arrows, symbolizing decline in data, performance, or various. Lebanon flag with a declining bar chart and down arrows, symbolizing decline in data, performance, or various national indicators in the country
Free with trial Lithuania flag with a declining bar chart and down arrows, symbolizing decline in data, performance, or various national indicators in the country. Background decrease decline illustrations Flag with a declining bar chart and down arrows. Lithuania flag with a declining bar chart and down arrows, symbolizing decline in data, performance, or various. Lithuania flag with a declining bar chart and down arrows, symbolizing decline in data, performance, or various national indicators in the country
Free with trial North Macedonia flag with a declining bar chart and down arrows, symbolizing decline in data, performance, or various national indicators in the country. Background decrease decline illustrations Flag with a declining bar chart and down arrows. North Macedonia flag with a declining bar chart and down arrows, symbolizing decline in data, performance, or. North Macedonia flag with a declining bar chart and down arrows, symbolizing decline in data, performance, or various national indicators in the country
Free with trial Morocco flag with a declining bar chart and down arrows, symbolizing decline in data, performance, or various national indicators in the country. Background decrease decline illustrations Flag with a declining bar chart and down arrows. Morocco flag with a declining bar chart and down arrows, symbolizing decline in data, performance, or various. Morocco flag with a declining bar chart and down arrows, symbolizing decline in data, performance, or various national indicators in the country
Free with trial Japan flag with a declining bar chart and down arrows, symbolizing decline in data, performance, or various national indicators in the country. Background decrease decline illustrations Flag with a declining bar chart and down arrows. Japan flag with a declining bar chart and down arrows, symbolizing decline in data, performance, or various. Japan flag with a declining bar chart and down arrows, symbolizing decline in data, performance, or various national indicators in the country
Free with trial Jordan flag with a declining bar chart and down arrows, symbolizing decline in data, performance, or various national indicators in the country. Background decrease decline illustrations Flag with a declining bar chart and down arrows. Jordan flag with a declining bar chart and down arrows, symbolizing decline in data, performance, or various. Jordan flag with a declining bar chart and down arrows, symbolizing decline in data, performance, or various national indicators in the country
Free with trial Red arrow points downward against textured dark background. Business and market downturn. Concept. Close-up. Flat lay. Space for text. Dark tones. Background decrease decline illustrations Red arrow points downward against textured dark background. Business and market downturn. Concept. Close-up. Flat lay. Space for text. Dark tones
Free with trial Red arrow points downward against textured dark background. Business and market downturn. Concept. Close-up. Flat lay. Space for text. Dark tones. Background decrease decline illustrations Red arrow points downward against textured dark background. Business and market downturn. Concept. Close-up. Flat lay. Space for text. Dark tones
Free with trial Red arrow points downward against textured dark background. Business and market downturn. Concept. Close-up. Flat lay. Space for text. Dark tones. Background decrease decline illustrations Red arrow points downward against textured dark background. Business and market downturn. Concept. Close-up. Flat lay. Space for text. Dark tones
Free with trial Red arrow points downward against textured dark background. Business and market downturn. Concept. Close-up. Flat lay. Space for text. Dark tones. Background decrease decline illustrations Red arrow points downward against textured dark background. Business and market downturn. Concept. Close-up. Flat lay. Space for text. Dark tones
Free with trial Red arrow points downward against textured dark background. Business and market downturn. Concept. Close-up. Flat lay. Space for text. Dark tones. Background decrease decline illustrations Red arrow points downward against textured dark background. Business and market downturn. Concept. Close-up. Flat lay. Space for text. Dark tones
Free with trial Red arrow points downward against textured dark background. Business and market downturn. Concept. Close-up. Flat lay. Space for text. Dark tones. Background decrease decline illustrations Red arrow points downward against textured dark background. Business and market downturn. Concept. Close-up. Flat lay. Space for text. Dark tones
Free with trial Red arrow points downward against textured dark background. Business and market downturn. Concept. Close-up. Flat lay. Space for text. Dark tones. Background decrease decline illustrations Red arrow points downward against textured dark background. Business and market downturn. Concept. Close-up. Flat lay. Space for text. Dark tones
Free with trial Red arrow points downward against textured dark background. Business and market downturn. Concept. Close-up. Flat lay. Space for text. Dark tones. Background decrease decline illustrations Red arrow points downward against textured dark background. Business and market downturn. Concept. Close-up. Flat lay. Space for text. Dark tones
Free with trial Simple black arrow points down on plain white background. Minimalist design suggests direction. Illustration suitable for graphic design projects, business presentations tech. Background decrease decline illustrations Simple black arrow points down on plain white background. Minimalist design suggests direction. Illustration suitable for graphic. Design projects, business
Free with trial A symbolic image of a cracked piggy bank painted with the American flag, sitting on a broken, concrete-like surface. In the background, an aged financial chart shows stock market fluctuations. This conceptual image represents economic instability, financial insecurity, inflation, or recession in the United States. Ideal for illustrating the fragility of savings and fiscal challenges. Background decrease decline illustrations Cracked American piggy bank on fractured surface with economic chart in background. A symbolic image of a cracked piggy bank painted with the American flag. A symbolic image of a cracked piggy bank painted with the American flag, sitting on a broken, concrete-like surface. In the background, an aged financial chart shows stock market fluctuations. This conceptual image represents economic instability, financial insecurity, inflation, or recession in the United States. Ideal for illustrating the fragility of savings and fiscal challenges.
Free with trial A graph showing a downward trend of two values over time from 1990 to 2023 with a world map background. Background decrease decline illustrations Global Trend Analysis Graph. A graph showing a downward trend of two values over time from 1990 to 2023 with a world map background. A graph showing a downward trend of two values over time from 1990 to 2023 with a world map background.
Free with trial A symbolic image of a cracked piggy bank painted with the American flag, sitting on a broken, concrete-like surface. In the background, an aged financial chart shows stock market fluctuations. This conceptual image represents economic instability, financial insecurity, inflation, or recession in the United States. Ideal for illustrating the fragility of savings and fiscal challenges. Background decrease decline illustrations Cracked American piggy bank on fractured surface with economic chart in background. A symbolic image of a cracked piggy bank painted with the American flag. A symbolic image of a cracked piggy bank painted with the American flag, sitting on a broken, concrete-like surface. In the background, an aged financial chart shows stock market fluctuations. This conceptual image represents economic instability, financial insecurity, inflation, or recession in the United States. Ideal for illustrating the fragility of savings and fiscal challenges.
Free with trial A symbolic image of a cracked piggy bank painted with the American flag, sitting on a broken, concrete-like surface. In the background, an aged financial chart shows stock market fluctuations. This conceptual image represents economic instability, financial insecurity, inflation, or recession in the United States. Ideal for illustrating the fragility of savings and fiscal challenges. Background decrease decline illustrations Cracked American piggy bank on fractured surface with economic chart in background. A symbolic image of a cracked piggy bank painted with the American flag. A symbolic image of a cracked piggy bank painted with the American flag, sitting on a broken, concrete-like surface. In the background, an aged financial chart shows stock market fluctuations. This conceptual image represents economic instability, financial insecurity, inflation, or recession in the United States. Ideal for illustrating the fragility of savings and fiscal challenges.
Free with trial A symbolic image of a cracked piggy bank painted with the American flag, sitting on a broken, concrete-like surface. In the background, an aged financial chart shows stock market fluctuations. This conceptual image represents economic instability, financial insecurity, inflation, or recession in the United States. Ideal for illustrating the fragility of savings and fiscal challenges. Background decrease decline illustrations Cracked American piggy bank on fractured surface with economic chart in background. A symbolic image of a cracked piggy bank painted with the American flag. A symbolic image of a cracked piggy bank painted with the American flag, sitting on a broken, concrete-like surface. In the background, an aged financial chart shows stock market fluctuations. This conceptual image represents economic instability, financial insecurity, inflation, or recession in the United States. Ideal for illustrating the fragility of savings and fiscal challenges.
Free with trial A symbolic image of a cracked piggy bank painted with the American flag, sitting on a broken, concrete-like surface. In the background, an aged financial chart shows stock market fluctuations. This conceptual image represents economic instability, financial insecurity, inflation, or recession in the United States. Ideal for illustrating the fragility of savings and fiscal challenges. Background decrease decline illustrations Cracked American piggy bank on fractured surface with economic chart in background. A symbolic image of a cracked piggy bank painted with the American flag. A symbolic image of a cracked piggy bank painted with the American flag, sitting on a broken, concrete-like surface. In the background, an aged financial chart shows stock market fluctuations. This conceptual image represents economic instability, financial insecurity, inflation, or recession in the United States. Ideal for illustrating the fragility of savings and fiscal challenges.
Free with trial A symbolic image of a cracked piggy bank painted with the American flag, sitting on a broken, concrete-like surface. In the background, an aged financial chart shows stock market fluctuations. This conceptual image represents economic instability, financial insecurity, inflation, or recession in the United States. Ideal for illustrating the fragility of savings and fiscal challenges. Background decrease decline illustrations Cracked American piggy bank on fractured surface with economic chart in background. A symbolic image of a cracked piggy bank painted with the American flag. A symbolic image of a cracked piggy bank painted with the American flag, sitting on a broken, concrete-like surface. In the background, an aged financial chart shows stock market fluctuations. This conceptual image represents economic instability, financial insecurity, inflation, or recession in the United States. Ideal for illustrating the fragility of savings and fiscal challenges.
Free with trial A symbolic image of a cracked piggy bank painted with the American flag, sitting on a broken, concrete-like surface. In the background, an aged financial chart shows stock market fluctuations. This conceptual image represents economic instability, financial insecurity, inflation, or recession in the United States. Ideal for illustrating the fragility of savings and fiscal challenges. Background decrease decline illustrations Cracked American piggy bank on fractured surface with economic chart in background. A symbolic image of a cracked piggy bank painted with the American flag. A symbolic image of a cracked piggy bank painted with the American flag, sitting on a broken, concrete-like surface. In the background, an aged financial chart shows stock market fluctuations. This conceptual image represents economic instability, financial insecurity, inflation, or recession in the United States. Ideal for illustrating the fragility of savings and fiscal challenges.
Free with trial A symbolic image of a cracked piggy bank painted with the American flag, sitting on a broken, concrete-like surface. In the background, an aged financial chart shows stock market fluctuations. This conceptual image represents economic instability, financial insecurity, inflation, or recession in the United States. Ideal for illustrating the fragility of savings and fiscal challenges. Background decrease decline illustrations Cracked American piggy bank on fractured surface with economic chart in background. A symbolic image of a cracked piggy bank painted with the American flag. A symbolic image of a cracked piggy bank painted with the American flag, sitting on a broken, concrete-like surface. In the background, an aged financial chart shows stock market fluctuations. This conceptual image represents economic instability, financial insecurity, inflation, or recession in the United States. Ideal for illustrating the fragility of savings and fiscal challenges.
Free with trial Flat bar chart uses dramatically shorter red bars on black to emphasize a sharp fall. Background decrease decline illustrations Flat design simple bar chart with dramatically decreasing red bars on black background, emphasizing fall. Flat bar chart uses dramatically shorter red bars on. Flat bar chart uses dramatically shorter red bars on black to emphasize a sharp fall.
Free with trial Flat bar chart uses dramatically shorter red bars on black to emphasize a sharp fall. Background decrease decline illustrations Flat design simple bar chart with dramatically decreasing red bars on black background, emphasizing fall. Flat bar chart uses dramatically shorter red bars on. Flat bar chart uses dramatically shorter red bars on black to emphasize a sharp fall.
Free with trial Flat bar chart uses dramatically shorter red bars on black to emphasize a sharp fall. Background decrease decline illustrations Flat design simple bar chart with dramatically decreasing red bars on black background, emphasizing fall. Flat bar chart uses dramatically shorter red bars on. Flat bar chart uses dramatically shorter red bars on black to emphasize a sharp fall.
Free with trial Cost Reduction Vector Illustration featuring Decreasing Expenses, Price Minimization, and Falling Profit Rates in Business. With a Flat Background. Background decrease decline vectors Cost Reduction Vector Illustration featuring Decreasing Expenses, Price Minimization, and Falling Profit Rates in Business. With a Flat Background
Free with trial Cost Reduction Vector Illustration featuring Decreasing Expenses, Price Minimization, and Falling Profit Rates in Business. With a Flat Background. Background decrease decline vectors Cost Reduction Vector Illustration featuring Decreasing Expenses, Price Minimization, and Falling Profit Rates in Business. With a Flat Background
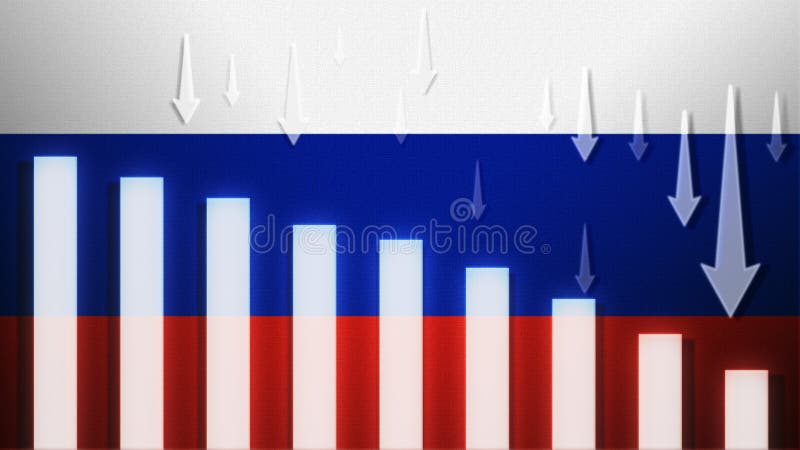
Free with trial Russia flag with a declining bar chart and down arrows, symbolizing decline in data, performance, or various national indicators in the country. Background decrease decline illustrations Flag with a declining bar chart and down arrows. Russia flag with a declining bar chart and down arrows, symbolizing decline in data, performance, or various. Russia flag with a declining bar chart and down arrows, symbolizing decline in data, performance, or various national indicators in the country
Free with trial South Korea flag with a declining bar chart and down arrows, symbolizing decline in data, performance, or various national indicators in the country. Background decrease decline illustrations Flag with a declining bar chart and down arrows. South Korea flag with a declining bar chart and down arrows, symbolizing decline in data, performance, or. South Korea flag with a declining bar chart and down arrows, symbolizing decline in data, performance, or various national indicators in the country
Free with trial South Sudan flag with a declining bar chart and down arrows, symbolizing decline in data, performance, or various national indicators in the country. Background decrease decline illustrations Flag with a declining bar chart and down arrows. South Sudan flag with a declining bar chart and down arrows, symbolizing decline in data, performance, or. South Sudan flag with a declining bar chart and down arrows, symbolizing decline in data, performance, or various national indicators in the country
Free with trial Saudi Arabia flag with a declining bar chart and down arrows, symbolizing decline in data, performance, or various national indicators in the country. Background decrease decline illustrations Flag with a declining bar chart and down arrows. Saudi Arabia flag with a declining bar chart and down arrows, symbolizing decline in data, performance, or. Saudi Arabia flag with a declining bar chart and down arrows, symbolizing decline in data, performance, or various national indicators in the country
Free with trial Single red brush stroke trends downward diagonally on textured paper, suggesting finality. Background decrease decline illustrations Minimalist abstract: single red brush stroke going downwards diagonally on textured paper background, sense of finality. Single red brush stroke trends downward. Single red brush stroke trends downward diagonally on textured paper, suggesting finality.
Free with trial Stock market arrow indicator red down and green up infographic chart concept template design. Background decrease decline vectors Stock market arrow indicator red down and green up infographic chart concept template design.
Free with trial Decreasing bar graph with falling arrow as a metaphor for stock market crash business loss and economic crisis concept. Background decrease decline illustrations Decreasing red graph symbolizing business loss and economic crisis. Decreasing bar graph with falling arrow as a metaphor for stock market crash business loss. Decreasing bar graph with falling arrow as a metaphor for stock market crash business loss and economic crisis concept
Free with trial Gold bars with red downward financial graph. Concept of falling gold market price, economic crisis, and investment loss, vector illustration eps10. Background decrease decline vectors Gold bars with red downward financial graph. Concept of falling gold market price, economic crisis, and investment loss. Vector illustration eps10
Free with trial Gold bars with red downward financial graph and arrows. Concept of falling gold market price, economic crisis, and investment loss, vector illustration eps10. Background decrease decline vectors Gold bars with red downward financial graph and arrows. Concept of falling gold market price, economic crisis, and investment loss. Vector illustration eps10
Free with trial Rocket Launch with Upward Trending Graph. An of a red and white rocket ship launching upward graph flying high to the moon. Background decrease decline vectors Rocket Launch with Upward Trending Graph. An of a red and white rocket ship launching upward graph flying high to the moon
Free with trial Businessman sets a goal about business development and income growth, man strives forward and upward on the growing graph to the piggy bank, banner. Flat vector illustration. Background decrease decline vectors Businessman sets a goal about business development and income growth, man strives forward and upward on the growing. Graph to the piggy bank, banner. Flat
Free with trial Man Falling Down Red Arrow. Business Crisis and Failure Concept. Vector Illustration. Background decrease decline vectors Man Falling Down Red Arrow. Business Crisis and Failure Concept. Vector Illustration
Free with trial Down arrow with dollar sign icon. Isolated silhouette-style down arrow icon featuring a dollar sign symbol, minimalist design for financial or business use. Background decrease decline vectors Down arrow with dollar sign icon. Isolated silhouette-style down arrow icon featuring a dollar sign symbol, minimalist design for financial or business use
Free with trial Set of various red upward and blue downward directional arrows. Vector illustration. Original paintings and drawing. Background decrease decline vectors Set of various red upward and blue downward directional arrows. Vector illustration. Original paintings and drawing
Free with trial 3D Isometric Flat Vector Illustration of Quality Vs Cost, Enhancing Quality And Reducing Costs For Improved Efficiency And Profit. Background decrease decline vectors 3D Isometric Flat Vector Illustration of Quality Vs Cost. Enhancing Quality And Reducing Costs For Improved Efficiency And Profit
Free with trial 3D Isometric Flat Vector Illustration of Financial Failure, Crisis In Declining Growth Rates. Background decrease decline vectors 3D Isometric Flat Vector Illustration of Financial Failure. Crisis In Declining Growth Rates
Free with trial Volatility of financial market pleases or upsets man standing near chart with sharp fluctuations. Problems of volatility in trading and influence of emotional background on investor. Background decrease decline vectors Volatility of financial market pleases or upsets man standing near chart with sharp fluctuations. Problems of volatility in trading and influence of emotional
Free with trial Isolated silhouette of a downward arrow icon integrated with a stair step design, bold and clean for modern presentations or infographics. Background decrease decline vectors Downward arrow icon with stair steps silhouette. Isolated silhouette of a downward arrow icon integrated with a stair step design, bold and clean for modern. Isolated silhouette of a downward arrow icon integrated with a stair step design, bold and clean for modern presentations or infographics
Free with trial Concept of economic collapse. Economic collapse concept above the hand of a woman in background. Background decrease decline illustrations Concept of economic collapse. Economic collapse concept above the hand of a woman in background
Free with trial A 3D human character pushes against a collapsing red bar chart with a downward arrow, a business conception of preventing financial loss and crisis. Background decrease decline illustrations 3D Human Character Trying to Stop a Falling Red Business Graph. A 3D human character pushes against a collapsing red bar chart with a downward arrow, a business. A 3D human character pushes against a collapsing red bar chart with a downward arrow, a business conception of preventing financial loss and crisis
Free with trial Sad Businesswoman Showing Declining Financial Chart. Flat vector illustration isolated on white background. Background decrease decline illustrations Sad Businesswoman Showing Declining Financial Chart. Flat vector illustration isolated on white background
Free with trial Outline down chart icon isolated. Flat style design vector illustration on white background. Background decrease decline vectors Outline down chart icon isolated. Flat style design vector illustration on white background
Free with trial Go down word block on white. Background. Background decrease decline illustrations Go down word block on white. Background
Free with trial Black and white clipboard icon featuring a checklist. The design includes an "X" and three dots in a vertical line, symbolizing tasks or points, followed by a downward-curving arrow. The arrow suggests a downward trend or progression. The icon is simple, with thick lines, and is typically used to represent concepts in planning, business analysis, or project management. The background is plain, emphasizing the clipboard graphic. Background decrease decline vectors Clipboard checklist with downward trend. Black and white clipboard icon featuring a checklist. The design includes an 'X' and three dots in a vertical line. Black and white clipboard icon featuring a checklist. The design includes an "X" and three dots in a vertical line, symbolizing tasks or points, followed by a downward-curving arrow. The arrow suggests a downward trend or progression. The icon is simple, with thick lines, and is typically used to represent concepts in planning, business analysis, or project management. The background is plain, emphasizing the clipboard graphic.
Free with trial The fall of bitcoin. Cartoon vector illustration. Background decrease decline vectors The fall of bitcoin. Cartoon vector illustration
Free with trial A 3D bar graph made of blue blocks with three red arrows pointing in different directions. The graph shows a mix of increasing and decreasing trends. The blocks are arranged in ascending order of height on the right side, while the left side has a more random arrangement. The red arrows are superimposed over the graph, with one pointing upwards, one to the left and one downwards. The background is. Background decrease decline illustrations A blue block graph with red arrows. A 3D bar graph made of blue blocks with three red arrows pointing in different directions. The graph shows a mix of. A 3D bar graph made of blue blocks with three red arrows pointing in different directions. The graph shows a mix of increasing and decreasing trends. The blocks are arranged in ascending order of height on the right side, while the left side has a more random arrangement. The red arrows are superimposed over the graph, with one pointing upwards, one to the left and one downwards. The background is
Free with trial Red and green arrows up and. Paper cutouts Upward red arrow, zigzag green arrow & downward red arrow on pastel background. Background decrease decline illustrations Red and green arrows up and. Paper cutouts Upward red arrow, zigzag green arrow & downward red arrow on pastel background
Free with trial Financial crisis concept, losses, falling stock prices. Red Japanese candlestick chart and down arrow, and piggy bank losing money due to falling quotes. Flat vector cartoon illustration. Background decrease decline vectors Financial crisis concept, losses, falling stock prices. Red Japanese candlestick chart and down arrow, and piggy bank. Losing money due to falling quotes. Flat. Financial crisis concept, losses, falling stock prices. Red Japanese candlestick chart and down arrow, and piggy bank losing money due to falling quotes. Flat vector cartoon illustration
Free with trial 3D Isometric Flat Vector Illustration of Bad Economic Trend, Businessman On Skateboard Ready To Dodge Economic Collapse And Market Crash. Background decrease decline vectors 3D Isometric Flat Vector Illustration of Bad Economic Trend. Businessman On Skateboard Ready To Dodge Economic Collapse And Market Crash
Free with trial Sad Face with Downward Arrow Vector Icon On White Background. Background decrease decline vectors Sad Face with Downward Arrow Vector Icon. On White Background
Free with trial Original flat vector-style business icon of trend down, isolated on white background. Hand-coded illustration, no AI used. Background decrease decline vectors Business trend down flat icon. Original flat vector-style business icon of trend down, isolated on white background. Hand-coded illustration, no AI used. Original flat vector-style business icon of trend down, isolated on white background. Hand-coded illustration, no AI used.
Free with trial Vector set of 55 financial crisis and economic recession line icons including economic recession, savings loss, stock market plunge, business shutdown, bank failure, and debt stack graph isolated on white background. Background decrease decline vectors Financial crisis line icons set. Vector set of 55 financial crisis and economic recession line icons including economic recession, savings loss, stock market. Vector set of 55 financial crisis and economic recession line icons including economic recession, savings loss, stock market plunge, business shutdown, bank failure, and debt stack graph isolated on white background.
Free with trial Loss Chart Icon. Outline, flat icons. Background decrease decline vectors Loss Chart Icon. Outline, flat icons
Free with trial A hand pours money into a glass against a red background evoking financial loss or waste Consider using this image for articles about economics or debt. Background decrease decline illustrations Money flowing into glass container. A hand pours money into a glass against a red background evoking financial loss or waste Consider using this image for. A hand pours money into a glass against a red background evoking financial loss or waste Consider using this image for articles about economics or debt
Free with trial 3d Red arrow showing downward trend in stock market. Financial crisis concept with broken coins, investment risk, and money loss. Vector illustration. Background decrease decline vectors 3d Red arrow downward trend in stock market. 3d Red arrow showing downward trend in stock market. Financial crisis concept with broken coins, investment risk. 3d Red arrow showing downward trend in stock market. Financial crisis concept with broken coins, investment risk, and money loss. Vector illustration
Free with trial Bold red downward zigzag arrow icon. A striking 3D red zigzag arrow pointing downward, simple and modern design for presentations or infographics. Background decrease decline illustrations Bold red downward zigzag arrow icon. A striking 3D red zigzag arrow pointing downward, simple and modern design for presentations or infographics
Free with trial Green and red circular arrow buttons. Green up arrow and red down arrow circular icons isolated on white background for user interface design. Background decrease decline vectors Green and red circular arrow buttons. Green up arrow and red down arrow circular icons isolated on white background for user interface design
Free with trial Chat arrow down icon. Outline, flat icons. Background decrease decline vectors Chat arrow down icon. Outline, flat icons
Free with trial Percent down icon vector art Illustrations. Background decrease decline vectors Percent down icon vector art Illustrations
Free with trial Graph Showing Recession. Blackboard with graph showing recession isolated on white background. Background decrease decline illustrations Graph Showing Recession. Blackboard with graph showing recession isolated on white background
Free with trial Downward Red Arrow Vector Concept on Dark. Financial Loss Line Graph with Downward Red Arrow Vector Concept on Dark. Background decrease decline vectors Downward Red Arrow Vector Concept on Dark. Financial Loss Line Graph with Downward Red Arrow Vector Concept on Dark
Free with trial Business Loss and Negative Growth Concept. Futuristic Declining Bar Graph with Downward Arrow on Dark Blue Background, Business Loss and Negative Growth Concept. Background decrease decline vectors Business Loss and Negative Growth Concept. Futuristic Declining Bar Graph with Downward Arrow on Dark Blue Background, Business Loss and Negative Growth Concept
 Sign in