Free with trial Red area chart graph showing market volatility going down. Area chart graph is going down showing market volatility. Background decrease decline vectors Red area chart graph showing market volatility going down. Area chart graph is going down showing market volatility
Free with trial Stack of money bills falling like dominoes with red arrow graph going down, concept of financial crisis. Background decrease decline vectors Red arrow graph is going down through stack of money bills. Stack of money bills falling like dominoes with red arrow graph going down, concept of financial. Stack of money bills falling like dominoes with red arrow graph going down, concept of financial crisis
Free with trial Simple vector illustration of a banknote with a dollar sign being canceled with a cross sign, concept for inflation, economic crisis or payment cancellation. Background decrease decline vectors Banknote with dollar sign being canceled with cross sign icon. Simple vector illustration of a banknote with a dollar sign being canceled with a cross sign. Simple vector illustration of a banknote with a dollar sign being canceled with a cross sign, concept for inflation, economic crisis or payment cancellation
Free with trial Dollar coin melting showing financial crisis concept. Minimalist vector illustration depicting a dollar coin melting, symbolizing the concept of financial crisis. Background decrease decline illustrations Dollar coin melting showing financial crisis concept. Minimalist vector illustration depicting a dollar coin melting, symbolizing the concept of financial crisis
Free with trial Graph showing negative trend with fire burning on top. Line graph showing negative results with fire burning above it, representing financial loss. Background decrease decline illustrations Graph showing negative trend with fire burning on top. Line graph showing negative results with fire burning above it, representing financial loss
Free with trial Dollar coin value decreasing showing financial crisis. Gold coin with a dollar sign is next to a red arrow pointing down, representing economic decline. Background decrease decline illustrations Dollar coin value decreasing showing financial crisis. Gold coin with a dollar sign is next to a red arrow pointing down, representing economic decline
Free with trial Glowing Down Arrow Neon Sign on Urban Wall. A vibrant yellow neon arrow glows against a dark, rustic brick wall, pointing downwards. Background decrease decline illustrations Glowing Down Arrow Neon Sign on Urban Wall. A vibrant yellow neon arrow glows against a dark, rustic brick wall, pointing downwards
Free with trial Downtrend economic arrow on blacktop, AI generated. White downtrend arrow on black asphalt, AI generated. Background decrease decline illustrations Downtrend economic arrow on blacktop, AI generated. White downtrend arrow on black asphalt, AI generated
Free with trial Reduction chart icon Thin line flat illustration. Reduction chart icon Black line art vector in black and white outline set collection sign. Background decrease decline vectors Reduction chart icon Thin line flat illustration. Reduction chart icon Black line art vector in black and white outline set collection sign
Free with trial Red and blue arrows pointing down showing negative trend. Four red and blue arrows are pointing down, illustrating a negative trend. Background decrease decline vectors Red and blue arrows pointing down showing negative trend. Four red and blue arrows are pointing down, illustrating a negative trend
Free with trial Arrow pointing down at decreasing stack of documents icon. Black outline icon of a stack of papers with a downward arrow, representing data loss or reduction. Background decrease decline illustrations Arrow pointing down at decreasing stack of documents icon. Black outline icon of a stack of papers with a downward arrow, representing data loss or reduction
Free with trial Smartphone showing red graph going down depicting financial loss. Smartphone is showing a red graph going down which represents financial loss. Background decrease decline vectors Smartphone showing red graph going down depicting financial loss. Smartphone is showing a red graph going down which represents financial loss
Free with trial Dollar currency coin decreasing value with downward arrow. Black and white icon of a dollar coin with a downward arrow, representing decreasing market value. Background decrease decline illustrations Dollar currency coin decreasing value with downward arrow. Black and white icon of a dollar coin with a downward arrow, representing decreasing market value
Free with trial Glowing Neon Graph Over Abstract Pink Terrain. A vibrant abstract image depicting a neon pink graph rising and falling over a textured pink and blue landscape. Background decrease decline illustrations Glowing Neon Graph Over Abstract Pink Terrain. A vibrant abstract image depicting a neon pink graph rising and falling over a textured pink and blue landscape
Free with trial Illustration of an ascending red arrow and a descending blue arrow. Simple curved arrow icon. Background decrease decline vectors Illustration of an ascending red arrow and a descending blue arrow. Simple curved arrow icon
Free with trial Concept of currency devaluation with a dollar coin and three downward arrows, illustrating financial loss. Background decrease decline vectors Dollar coin decreasing in value with three downward arrows. Concept of currency devaluation with a dollar coin and three downward arrows, illustrating financial. Concept of currency devaluation with a dollar coin and three downward arrows, illustrating financial loss
Free with trial A 3D-rendered image depicts a sharply declining red arrow on a bar graph, symbolizing a significant market downturn. The graph is set against a solid blue background. Background decrease decline illustrations 3D Render of a Dramatic Stock Market Crash Graph. A 3D-rendered image depicts a sharply declining red arrow on a bar graph, symbolizing a significant market. A 3D-rendered image depicts a sharply declining red arrow on a bar graph, symbolizing a significant market downturn. The graph is set against a solid blue background.
Free with trial Loss money arrow bar graph icon isolated on white. Financial icon depicting money loss with a downward arrow and bar graph isolated on a white background. Background decrease decline illustrations Loss money arrow bar graph icon isolated on white. Financial icon depicting money loss with a downward arrow and bar graph isolated on a white background
Free with trial Blue arrows pointing down showing negative trend. 3d illustration of four blue arrows pointing down representing a negative trend. Background decrease decline illustrations Blue arrows pointing down showing negative trend. 3d illustration of four blue arrows pointing down representing a negative trend
Free with trial A 3D icon featuring a dark square base with a gold border. On the base are four vertical bars of varying heights, colored in shades of beige and gold. A red zigzag line representing a downward trend is positioned above the bars, with its peak resting on the tallest bar and its subsequent segments descending. The icon is isolated on a clean white background. Background decrease decline illustrations Downward financial trend graph icon chart business. A 3D icon featuring a dark square base with a gold border. On the base are four vertical bars of varying. A 3D icon featuring a dark square base with a gold border. On the base are four vertical bars of varying heights, colored in shades of beige and gold. A red zigzag line representing a downward trend is positioned above the bars, with its peak resting on the tallest bar and its subsequent segments descending. The icon is isolated on a clean white background
Free with trial Round chart icon showing decreasing bar graph for data analysis. This simple vector icon shows a round chart with a bar graph that is decreasing. Background decrease decline illustrations Round chart icon showing decreasing bar graph for data analysis. This simple vector icon shows a round chart with a bar graph that is decreasing
Free with trial The image showcases a collection of vibrant charts and graphs presenting data visualizations on a dark background. Background decrease decline illustrations Colorful Data Visualization Charts And Graphs Display. The image showcases a collection of vibrant charts and graphs presenting data visualizations on a dark. The image showcases a collection of vibrant charts and graphs presenting data visualizations on a dark background
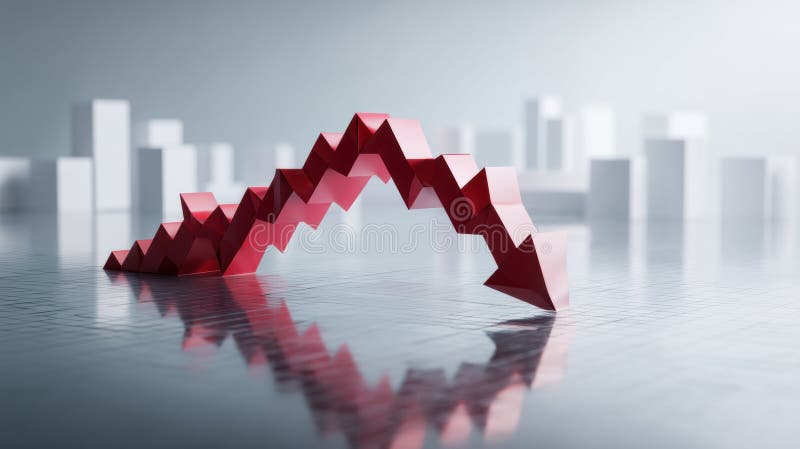
Free with trial This striking image depicts a 3D rendering of a sharply declining graph, generated by AI, symbolizing a market crash or economic downturn. The red arrow dramatically plunges downwards against a blurred background of white building silhouettes, visually representing the severity of the economic decl. Background decrease decline illustrations AI-Generated Market Crash Visualization. This striking image depicts a 3D rendering of a sharply declining graph, generated by AI, symbolizing a market crash or. This striking image depicts a 3D rendering of a sharply declining graph, generated by AI, symbolizing a market crash or economic downturn. The red arrow dramatically plunges downwards against a blurred background of white building silhouettes, visually representing the severity of the economic decl
Free with trial Simple bold black downward pointing arrow perfect for website or app design. This vector illustration is easily scalable and editable. Background decrease decline vectors Bold Black Down Arrow Icon Simple Vector Illustration. Simple bold black downward pointing arrow perfect for website or app design. This vector illustration is. Simple bold black downward pointing arrow perfect for website or app design. This vector illustration is easily scalable and editable.
Free with trial Red arrow pointing down over decreasing graph bars showing losses. Isometric 3d red arrow pointing down over decreasing graph bars, concept of business loss. Background decrease decline illustrations Red arrow pointing down over decreasing graph bars showing losses. Isometric 3d red arrow pointing down over decreasing graph bars, concept of business loss
Free with trial Statics arrow down flat and simple set design. Statics arrow down Flat outline Collection in Black and white background. Background decrease decline vectors Statics arrow down flat and simple set design. Statics arrow down Flat outline Collection in Black and white background
Free with trial Three wooden blocks are arranged in a row on a reflective surface against a white background. The leftmost block has two green upward-pointing arrows cut out, revealing a green background. The middle block displays a dark blue percentage symbol. The rightmost block features a red downward-pointing arrow cut out, revealing a red background. Background decrease decline illustrations Wooden blocks with up arrows percentage and down arrow. Three wooden blocks are arranged in a row on a reflective surface against a white background. The. Three wooden blocks are arranged in a row on a reflective surface against a white background. The leftmost block has two green upward-pointing arrows cut out, revealing a green background. The middle block displays a dark blue percentage symbol. The rightmost block features a red downward-pointing arrow cut out, revealing a red background
Free with trial A worried woman stands on a paper boat in rough water, surrounded by downward arrows and a falling graph line on a light blue background. Concept of financial crisis. Vector illustration. Background decrease decline vectors Businesswoman on sinking paper boat concept. Vector illustration. A worried woman stands on a paper boat in rough water, surrounded by downward arrows and a. A worried woman stands on a paper boat in rough water, surrounded by downward arrows and a falling graph line on a light blue background. Concept of financial crisis. Vector illustration
Free with trial Fast downloading arrow icon, perfect for website or app design. Simple and modern design. Background decrease decline vectors Fast Download Arrow Icon, Modern Digital Design Element. Fast downloading arrow icon, perfect for website or app design. Simple and modern design. Fast downloading arrow icon, perfect for website or app design. Simple and modern design.
Free with trial Simple line art illustration of a bar graph with a downward trend, symbolizing negative growth. Background decrease decline illustrations Declining bar graph showing negative trend with arrow pointing down. Simple line art illustration of a bar graph with a downward trend, symbolizing negative. Simple line art illustration of a bar graph with a downward trend, symbolizing negative growth
Free with trial Reduction chart icon. Set. Vector symbols in black and white colors. Background decrease decline vectors Reduction chart icon. Set. Vector symbols in black and white colors
Free with trial Simple graph showing decreasing stacks of money, representing financial loss. Money decreasing graph showing financial loss with stacks of cash and coin currency. Background decrease decline vectors Simple graph showing decreasing stacks of money, representing financial loss. Money decreasing graph showing financial loss with stacks of cash and coin currency
Free with trial Line icon of a flip chart showing decreasing bars, suggesting a negative trend during a business presentation. Background decrease decline vectors Flip chart showing decreasing bars graphic for business presentation. Line icon of a flip chart showing decreasing bars, suggesting a negative trend during a. Line icon of a flip chart showing decreasing bars, suggesting a negative trend during a business presentation
Free with trial 3d curved arrow changing color from blue to red pointing down and right, representing concepts like temperature change, heat transfer, or a transition from cold to hot. Background decrease decline illustrations 3d curved arrow changing from blue to red pointing down right. 3d curved arrow changing color from blue to red pointing down and right, representing concepts. 3d curved arrow changing color from blue to red pointing down and right, representing concepts like temperature change, heat transfer, or a transition from cold to hot
Free with trial A magnifying glass focuses on a digital graph featuring red and orange declining bars and lines, indicating stock market trends. The surrounding environment is filled with digital screens displaying similar financial data, creating an intense, analytical atmosphere. The image highlights the detailed examination of market fluctuations, with vibrant colors contrasting against a computerized background to emphasize the importance of precision in financial analysis. Background decrease decline illustrations Stock Market Analysis: Magnifying Glass On Declining Graph. A magnifying glass focuses on a digital graph featuring red and orange declining bars and lines. A magnifying glass focuses on a digital graph featuring red and orange declining bars and lines, indicating stock market trends. The surrounding environment is filled with digital screens displaying similar financial data, creating an intense, analytical atmosphere. The image highlights the detailed examination of market fluctuations, with vibrant colors contrasting against a computerized background to emphasize the importance of precision in financial analysis.
Free with trial Businessman controlling world economy with arrows pointing downwards, symbolizing recession and economic downturn. Background decrease decline vectors Businessman controlling world economy with arrows pointing downwards. Symbolizing recession and economic downturn
Free with trial This image showcases a clean, modern design featuring three downward-pointing arrows neatly arranged within a rectangular box. Perfect for app interfaces or website design projects needing a clear download indicator. Background decrease decline vectors Triple Download Arrows in Rectangle Box: Modern UI Element. This image showcases a clean, modern design featuring three downward-pointing arrows neatly arranged. This image showcases a clean, modern design featuring three downward-pointing arrows neatly arranged within a rectangular box. Perfect for app interfaces or website design projects needing a clear download indicator.
Free with trial Red graph is rapidly declining, representing a market crash, with percentage and dollar signs indicating financial losses. Background decrease decline illustrations Red graph showing market crashing down with percentage and dollar sign in background. Red graph is rapidly declining, representing a market crash, with. Red graph is rapidly declining, representing a market crash, with percentage and dollar signs indicating financial losses
Free with trial The character is hanging on a falling red arrow. Space for text. Background decrease decline illustrations The character is hanging on a falling red arrow. Space for text. The character is hanging on a falling red arrow. Space for text
Free with trial Dynamic visualization of financial market data showcasing trends and statistics. Ideal for essays, reports, and presentations on economic analysis and investment strategies. Background decrease decline illustrations Financial Market Analysis with Data Chart Display and Trends. Dynamic visualization of financial market data showcasing trends and statistics. Ideal for essays. Dynamic visualization of financial market data showcasing trends and statistics. Ideal for essays, reports, and presentations on economic analysis and investment strategies
Free with trial This image features a simple, bold black down arrow icon, perfect for representing download, next, or other similar concepts. The design is clean and modern, ideal for websites and applications. Background decrease decline vectors Bold Black Down Arrow Icon: Simple and Effective Download Symbol. This image features a simple, bold black down arrow icon, perfect for representing download. This image features a simple, bold black down arrow icon, perfect for representing download, next, or other similar concepts. The design is clean and modern, ideal for websites and applications.
Free with trial Wooden Blocks Forming A Pyramid With Downward Arrow. generative AI. Path to Business Success: Hands Stack Wooden Blocks for Growth and Development. Background decrease decline illustrations Wooden Blocks Forming A Pyramid With Downward Arrow. generative AI. Path to Business Success: Hands Stack Wooden Blocks for Growth and Development
Free with trial Abstract financial graph fluctuating over dark textured surface Images are created using AI. Background decrease decline illustrations Abstract financial graph fluctuating over dark textured surface. Images are created using AI
Free with trial Red falling financial stock market chart and line graph showing economic crash crisis and profit loss down. Trend. Background decrease decline illustrations Red falling financial stock market chart and line graph showing economic crash crisis and profit loss down. Trend
Free with trial A hand holding a pen traces a red downward trending stock market chart, symbolizing a bear market or financial downturn. The background shows stock data. Background decrease decline illustrations Bear Market Analysis: Hand with Pen Tracing a Declining Stock Chart. A hand holding a pen traces a red downward trending stock market chart, symbolizing a bear. A hand holding a pen traces a red downward trending stock market chart, symbolizing a bear market or financial downturn. The background shows stock data
Free with trial A straightforward black and white vector design showcasing its simplicity with clear-cut lines and a captivating interplay of contrasting colors - Artificial intelligence crafted illustration. Background decrease decline vectors Fall - black and white isolated icon - vector illustration. A straightforward black and white vector design showcasing its simplicity with clear-cut lines and a. A straightforward black and white vector design showcasing its simplicity with clear-cut lines and a captivating interplay of contrasting colors - Artificial intelligence crafted illustration
Free with trial Red graph showing decreasing trend on blue digital screen, concept of financial crisis and economy recession. Generative AI. Background decrease decline illustrations Red stock market graph showing decreasing trend on blue digital screen. Red graph showing decreasing trend on blue digital screen, concept of financial crisis. Red graph showing decreasing trend on blue digital screen, concept of financial crisis and economy recession. Generative AI
Free with trial This black and white icon illustrates the impact of economic downturn on consumer spending. Background decrease decline illustrations Shopping cart receiving shock with arrow pointing down indicating economic crisis. This black and white icon illustrates the impact of economic downturn on. This black and white icon illustrates the impact of economic downturn on consumer spending
Free with trial This 3D rendering depicts financial growth, showcasing stacks of gold coins and black bars representing a rising graph. A golden pen rests on a sleek base, symbolizing the precision and detail involved in financial planning. This image was generated by AI and is perfect for illustrating financial s. Background decrease decline illustrations Financial Growth Visualization. This 3D rendering depicts financial growth, showcasing stacks of gold coins and black bars representing a rising graph. A golden. This 3D rendering depicts financial growth, showcasing stacks of gold coins and black bars representing a rising graph. A golden pen rests on a sleek base, symbolizing the precision and detail involved in financial planning. This image was generated by AI and is perfect for illustrating financial s
Free with trial Attractive young european woman working at desk with laptop, notepad and downward red forex chart with map, grid and index on blurry background. Financial crisis and recession concept. Double exposure. Background decrease decline illustrations Attractive young european woman working at desk with laptop, notepad and downward red forex chart with map, grid and index on. Blurry background. Financial. Attractive young european woman working at desk with laptop, notepad and downward red forex chart with map, grid and index on blurry background. Financial crisis and recession concept. Double exposure
Free with trial Breaking red arrow pointing downwards dramatically pierces a financial chart with gold coins, conveying a feeling of economic loss and volatility, ideal for finance and investment related marketing. Background decrease decline illustrations Red Downward Arrow Breaking on Colorful Financial Chart with Gold Coins. Breaking red arrow pointing downwards dramatically pierces a financial chart with gold. Breaking red arrow pointing downwards dramatically pierces a financial chart with gold coins, conveying a feeling of economic loss and volatility, ideal for finance and investment related marketing
Free with trial A bold blue percentage symbol, 3D-rendered, ideal for financial, statistical, and business presentations. Clean design. Background decrease decline illustrations Blue percentage symbol isolated on white background for finance concepts. A bold blue percentage symbol, 3D-rendered, ideal for financial, statistical, and. A bold blue percentage symbol, 3D-rendered, ideal for financial, statistical, and business presentations. Clean design
Free with trial Costs optimization thin line icon set. Costs optimization icon set on white background. Eps 10 stock vector. Background decrease decline vectors Costs optimization thin line icon set. Costs optimization icon set on white background. Eps 10 stock vector
Free with trial Costs optimization thin line icon set. Costs optimization icon set on white background. Eps 10 stock vector. Background decrease decline vectors Costs optimization thin line icon set. Costs optimization icon set on white background. Eps 10 stock vector
Free with trial Costs optimization thin line icon set. Costs optimization icon set on white background. Eps 10 stock vector. Background decrease decline vectors Costs optimization thin line icon set. Costs optimization icon set on white background. Eps 10 stock vector
Free with trial Modern digital illustration showing a glowing neon 'Margin Call' alert over financial charts and data analytics interface, symbolizing trading loss and market downturn. Background decrease decline illustrations Margin Call Concept with Stock Market Chart and Financial Data Visualization. Modern digital illustration showing a glowing neon 'Margin Call' alert over. Modern digital illustration showing a glowing neon 'Margin Call' alert over financial charts and data analytics interface, symbolizing trading loss and market downturn.
Free with trial A simple black and white vector illustration showcasing clean lines and contrasting shades - Artificial intelligence crafted illustration. Background decrease decline vectors Fall - black and white vector illustration. A simple black and white vector illustration showcasing clean lines and contrasting shades - Artificial intelligence. A simple black and white vector illustration showcasing clean lines and contrasting shades - Artificial intelligence crafted illustration
Free with trial A 3D cartoon boy with brown hair, wearing a light blue t-shirt and blue pants, holds a large pink arrow pointing downwards against a white background. Background decrease decline illustrations Cartoon boy in blue shirt and pants holding a large pink downward arrow male child. A 3D cartoon boy with brown hair, wearing a light blue t-shirt and blue pants. A 3D cartoon boy with brown hair, wearing a light blue t-shirt and blue pants, holds a large pink arrow pointing downwards against a white background
Free with trial This image features a simple, bold, black downward-pointing arrow icon, perfect for download buttons or indicating direction. High-resolution, clean design. Background decrease decline vectors Simple Bold Black Down Arrow Icon, Download Button Symbol. This image features a simple, bold, black downward-pointing arrow icon, perfect for download buttons. This image features a simple, bold, black downward-pointing arrow icon, perfect for download buttons or indicating direction. High-resolution, clean design.
Free with trial A red arrow crashes through a stock market graph, symbolizing financial crisis. the image depicts a market crash with a falling trend, representing economic downturn and potential investment loss. Background decrease decline illustrations Red arrow crashing through stock market graph representing financial crisis and market crash. A red arrow crashes through a stock market graph, symbolizing. a red arrow crashes through a stock market graph, symbolizing financial crisis. the image depicts a market crash with a falling trend, representing economic downturn and potential investment loss.
Free with trial Square Format Infographic Poster Bold Typography Charts 1 Upscaled 4X clean composition. Featuring square, format, infographic. Neutral, commercial-friendly, with room for copy. Background decrease decline illustrations Square Format Infographic Poster Bold Typography Charts 1 Upscaled 4X clean composition. Featuring square, format, infographic. Neutral, commercial-friendly
Free with trial A golden bitcoin coin with a prominent B symbol is centered within a green circular frame. A red downward-pointing arrow and a green upward-pointing arrow are positioned to the right of the coin, suggesting financial fluctuation. Background decrease decline illustrations Golden bitcoin symbol with downward red arrow and green arrow cryptocurrency digital currency. A golden bitcoin coin with a prominent B symbol is centered within. A golden bitcoin coin with a prominent B symbol is centered within a green circular frame. A red downward-pointing arrow and a green upward-pointing arrow are positioned to the right of the coin, suggesting financial fluctuation
Free with trial A straightforward black and white vector design showcasing its simplicity with clear-cut lines and a captivating interplay of contrasting colors - Artificial intelligence crafted illustration. Background decrease decline vectors Fall - minimalist and flat logo - vector illustration. A straightforward black and white vector design showcasing its simplicity with clear-cut lines and a. A straightforward black and white vector design showcasing its simplicity with clear-cut lines and a captivating interplay of contrasting colors - Artificial intelligence crafted illustration
Free with trial An elegant monochromatic vector artwork featuring sharp, well-defined contours and a striking interplay of light and dark tones - Artificial intelligence crafted illustration. Background decrease decline vectors Fall - minimalist and flat logo - vector illustration. An elegant monochromatic vector artwork featuring sharp, well-defined contours and a striking interplay of. An elegant monochromatic vector artwork featuring sharp, well-defined contours and a striking interplay of light and dark tones - Artificial intelligence crafted illustration
Free with trial A colorful circular gauge on a chalkboard showing a low score, indicated by crossed wooden sticks, high-resolution background Generative AI. Background decrease decline illustrations A colorful circular gauge on a chalkboard showing a low score, indicated by crossed wooden sticks. High-resolution background Generative AI
Free with trial A 3D rendering of a simple bar graph featuring two green and one orange cylinder. This image is perfect for illustrating business concepts, data representation, or as an infographic element. The clean design makes it versatile for various applications. This image was generated with the assistance of artificial intelligence. Background decrease decline illustrations 3D Bar Graph, Green and Orange Cylinders, Business Chart, Data Visualization, Infographic Element. A 3D rendering of a simple bar graph featuring two green and. A 3D rendering of a simple bar graph featuring two green and one orange cylinder. This image is perfect for illustrating business concepts, data representation, or as an infographic element. The clean design makes it versatile for various applications.This image was generated with the assistance of artificial intelligence.
Free with trial A 3D rendering of a small house model with a dollar sign on a seesaw, balanced against stacks of coins and a downward trending. Arrow. Generative AI. Background decrease decline illustrations A 3D rendering of a small house model with a dollar sign on a seesaw, balanced against stacks of coins and a downward trending. Arrow. Generative AI
Free with trial A basic black-and-white vector artwork exhibiting a clarity of form through its sharp lines and a striking blend of contrasting tones - Artificial intelligence crafted illustration. Background decrease decline vectors Fall - minimalist and simple silhouette - vector illustration. A basic black-and-white vector artwork exhibiting a clarity of form through its sharp lines and a. A basic black-and-white vector artwork exhibiting a clarity of form through its sharp lines and a striking blend of contrasting tones - Artificial intelligence crafted illustration
Free with trial A simple black and white vector illustration showcasing clean lines and contrasting shades - Artificial intelligence crafted illustration. Background decrease decline vectors Fall - minimalist and simple silhouette - vector illustration. A simple black and white vector illustration showcasing clean lines and contrasting shades. A simple black and white vector illustration showcasing clean lines and contrasting shades - Artificial intelligence crafted illustration
Free with trial A line chart depicting a downward finanl trend across four quarters with a red warning flag at the lowest point. Background decrease decline illustrations Business Finanl Loss Graph Arrow Down with Red Flag. A line chart depicting a downward finanl trend across four quarters with a red warning flag at the lowest. A line chart depicting a downward finanl trend across four quarters with a red warning flag at the lowest point
Free with trial Money increase image concept. Stacks of coins in a increase financial concept. The words start and finish with an arrow are written in chalk on a slate blackboard. 3d illustration. Background decrease decline illustrations Money increase image concept. Stacks of coins in a increase financial concept. 3d rendering. Money increase image concept. Stacks of coins in a increase. Money increase image concept. Stacks of coins in a increase financial concept. The words start and finish with an arrow are written in chalk on a slate blackboard. 3d illustration
Free with trial Money increase image concept. Stacks of coins in a increase financial concept. The words start and finish with an arrow are written in chalk on a slate blackboard. 3d illustration. Background decrease decline illustrations Money increase image concept. Stacks of coins in a increase financial concept. 3d rendering. Money increase image concept. Stacks of coins in a increase. Money increase image concept. Stacks of coins in a increase financial concept. The words start and finish with an arrow are written in chalk on a slate blackboard. 3d illustration
Free with trial Vibrant neon stock market graph showing financial data trends and analysis. Perfect for business, finance, and investment themes. Generative AI Illustration. Background decrease decline illustrations Vibrant Neon Stock Market Graph Showing Financial Data Trends and Analysis. Generative AI Illustration. Vibrant neon stock market graph showing financial data. Vibrant neon stock market graph showing financial data trends and analysis. Perfect for business, finance, and investment themes. Generative AI Illustration
Free with trial Glowing golden Bitcoin coin hovering near declining cryptocurrency market candlestick chart signaling volatile trading environment. Background decrease decline illustrations Golden Bitcoin coin showing decreasing candlestick chart in background representing cryptocurrency investment risk. Glowing golden Bitcoin coin hovering near. Glowing golden Bitcoin coin hovering near declining cryptocurrency market candlestick chart signaling volatile trading environment
Free with trial A straightforward black and white vector graphic highlighting its sleek, uncluttered lines and a dynamic play of contrasting hues - Artificial intelligence crafted illustration. Background decrease decline vectors Fall - high quality vector logo - vector illustration ideal for t-shirt graphic. A straightforward black and white vector graphic highlighting its sleek. A straightforward black and white vector graphic highlighting its sleek, uncluttered lines and a dynamic play of contrasting hues - Artificial intelligence crafted illustration
Free with trial A minimalistic black-and-white vector graphic characterized by its straightforward lines and an eye-catching use of contrasting shades - Artificial intelligence crafted illustration. Background decrease decline vectors Fall - high quality vector logo - vector illustration ideal for t-shirt graphic. A minimalistic black-and-white vector graphic characterized by its. A minimalistic black-and-white vector graphic characterized by its straightforward lines and an eye-catching use of contrasting shades - Artificial intelligence crafted illustration
Free with trial A bar chart with a downward-pointing red arrow and decreasing black bars symbolizing loss and failure. Finance, business, and economics concept. Background decrease decline illustrations A bar chart with a downward-pointing red arrow and decreasing black bars symbolizing loss and failure. Finance, business, and. Economics concept
Free with trial Vector illustration symbolizing conflict, trade war, or economic crisis between the USA and China. The US and Chinese flags clash on background financial candlestick chart. Concept represents political tension, economic downturn, recession, stock market crash, or financial instability related to US-China relations and global markets. Background decrease decline vectors Concept of trade war or economic crisis in US-China relations. Vector illustration symbolizing conflict, trade war, or economic crisis between the USA and China. Vector illustration symbolizing conflict, trade war, or economic crisis between the USA and China. The US and Chinese flags clash on background financial candlestick chart. Concept represents political tension, economic downturn, recession, stock market crash, or financial instability related to US-China relations and global markets.
Free with trial A 3D rendered pie chart composed of three pastel-colored segments: pink, blue, and teal. Two coins are positioned around the chart. A yellow coin with an upward-pointing arrow is above the chart, and a pink coin with a downward-pointing arrow is below it, set against a light purple background. Background decrease decline illustrations 3D Pie Chart with Up and Down Arrows on Coins in Pastel Colors Keywords: pie chart, graph, data, analytics, statistics, finance,. A 3D rendered pie chart. A 3D rendered pie chart composed of three pastel-colored segments: pink, blue, and teal. Two coins are positioned around the chart. A yellow coin with an upward-pointing arrow is above the chart, and a pink coin with a downward-pointing arrow is below it, set against a light purple background
Free with trial Stock market plunged falling down, economic crash, investing failure or mistake, price drop, recession, investment risk concept, graph fall down to the floor. Background decrease decline illustrations Economic crash, investing failure or mistake, price drop, recession, investment risk concept, graph fall down to the floor. Stock market plunged falling down. Stock market plunged falling down, economic crash, investing failure or mistake, price drop, recession, investment risk concept, graph fall down to the floor.
 Sign in