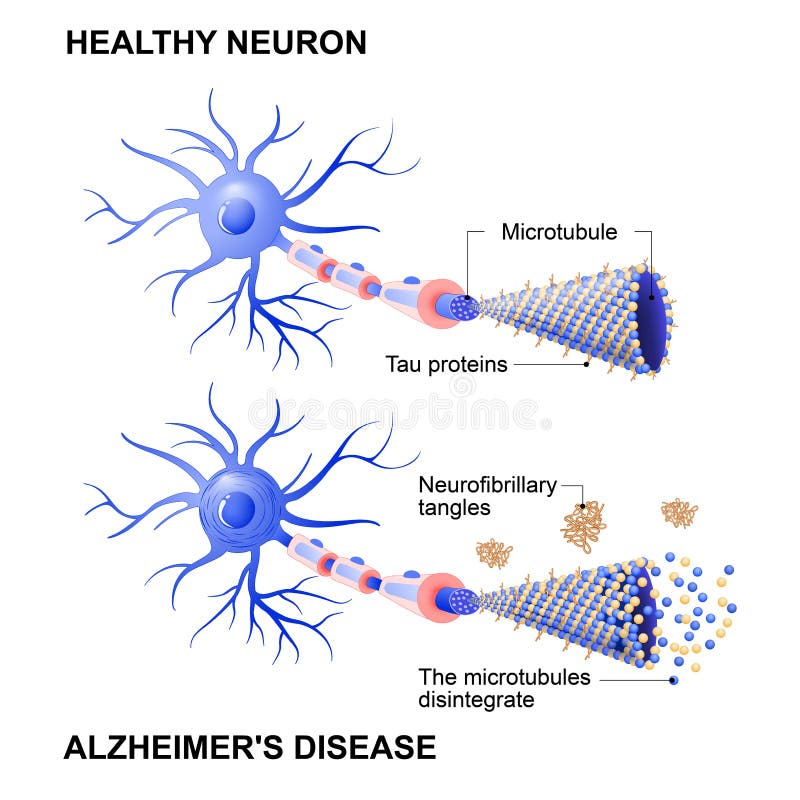
Free with trial Alzheimer`s disease is the change in tau protein that results in the breakdown of microtubules in brain cells. Mechanism of disease. Diagram shows two neurons: healthy cell and neuron with Alzheimer`s disease. Tau hypothesis. Neurofibrillary tangles. Breakdown infographic vectors Healthy cell and neurons with Alzheimer`s disease. Tau hypothesi. Alzheimer`s disease is the change in tau protein that results in the breakdown of microtubules in brain cells. Mechanism of disease. Diagram shows two neurons: healthy cell and neuron with Alzheimer`s disease. Tau hypothesis. Neurofibrillary tangles
Free with trial Vector isometric gas filling station building icon. Breakdown infographic vectors Vector gas filling station. Vector isometric gas filling station building icon
Free with trial Vector isometric Car Service building icon. Breakdown infographic vectors Vector Car Service. Vector isometric Car Service building icon
Free with trial Depression signs and symptoms infographic concept. Vector flat cartoon illustration poster. Sad men character. Breakdown infographic vectors Depression signs and symptoms infographic concept. Vector flat cartoon illustration poster
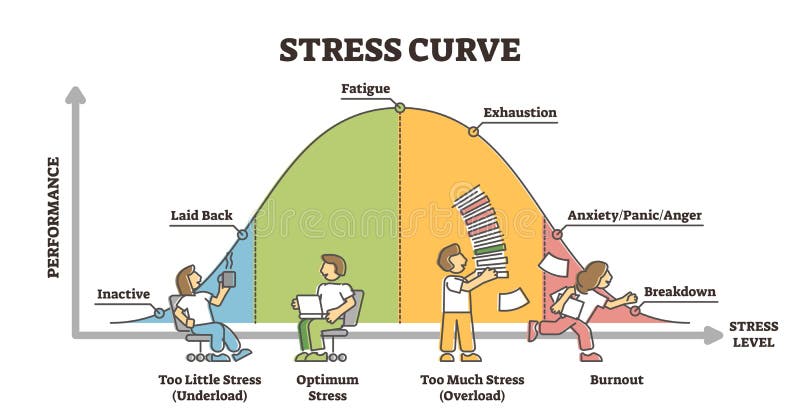
Free with trial Stress curve vector illustration. Flat BW labeled performance level graphic. Healthy performance analysis with underload, optimum, overload and burnout scale. Fatigue, exhaustion and breakdown diagram. Breakdown infographic vectors Stress curve vector illustration. Flat BW labeled performance level graphic
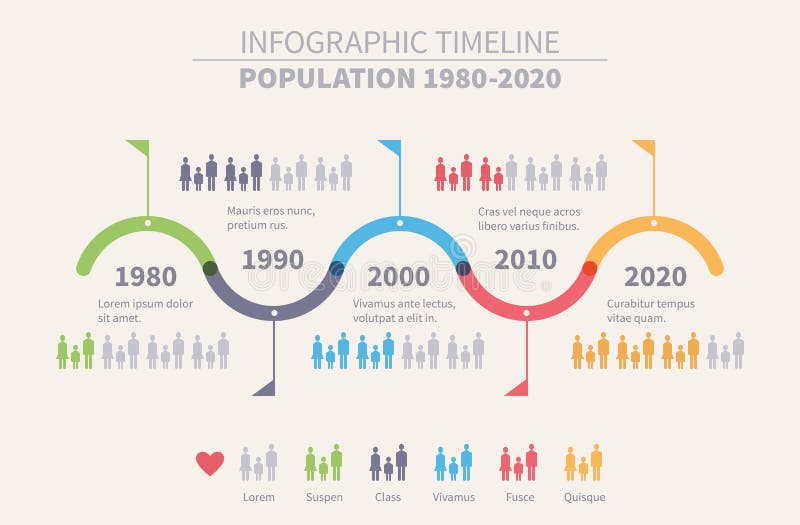
Free with trial Colored Population Timeline Inforgraphic Design from 1980 to 2020 on Off White Background. Breakdown infographic vectors Population Timeline Inforgraphic Design
Free with trial Graphs and charts icons or infographic elements with sixteen different wheel graphs pie graphs pyramid bar graph flow chart analytics designs and templates. Breakdown infographic vectors Graphs and charts icons or infographic elements
Free with trial Auto repair service infographic with mechanics working on a car, text and icons set: repair, tires, diagnostics, performance. Breakdown infographic vectors Auto repair service
Free with trial Ketogenic diet macros diagram, low carbs, high healthy fat vector illustration for infographic title. Breakdown infographic vectors Ketogenic diet macros diagram, low carbs, high healthy fat
Free with trial Vector isometric Car Service building icon. Breakdown infographic vectors Vector Car Service. Vector isometric Car Service building icon
Free with trial Collection of seven different templates of colourful statistical wheel charts with component divisions numbering between two and eight making up the circumference of the wheel. Breakdown infographic vectors Statistical wheel charts
Free with trial Businessman falls down the stairs. Breakdown infographic illustrations Crisis. Businessman falls down the stairs
Free with trial Vector flat Car Service building icon. Breakdown infographic vectors Vector Car Service. Vector flat Car Service building icon
Free with trial Stress curve educational diagram with performance level graph outline concept. Labeled work productivity and efficiency optimum reach vector illustration. Avoid overload and burnout to be effective. Breakdown infographic illustrations Stress curve educational diagram with performance level graph outline concept
Free with trial Vector isolated infographics related icons set. Breakdown infographic vectors Vector isolated infographics related icons
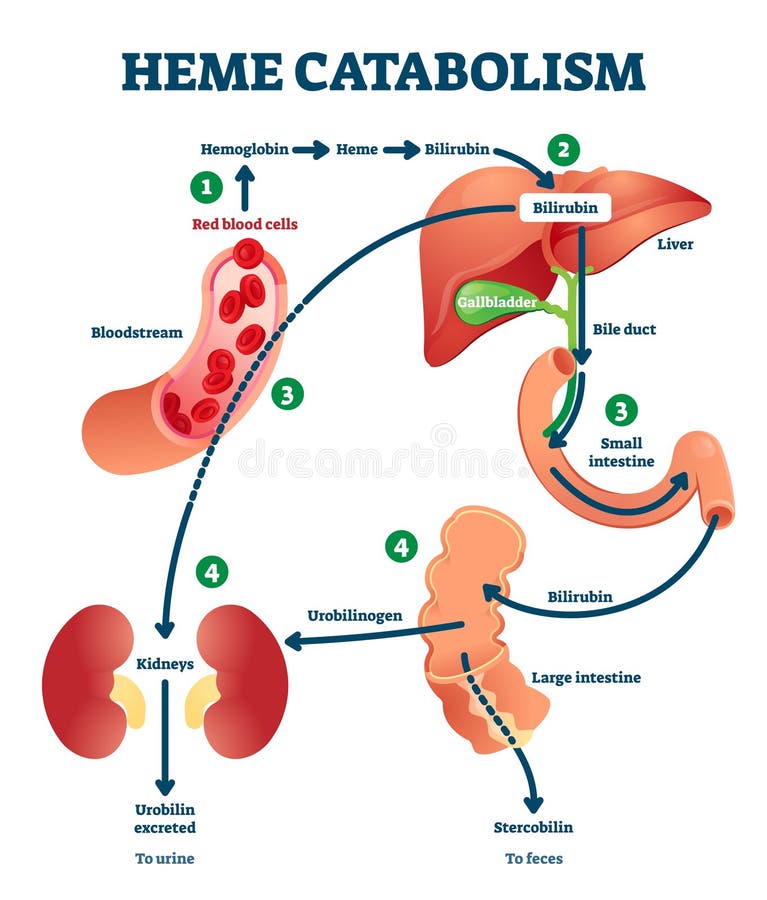
Free with trial Heme catabolism vector illustration. Labeled chemical blood reaction scheme. Diagram with anatomical iron synthesis explanation. Educational hemoglobin, bilirubin, bile duct and urobilinogen model. Breakdown infographic vectors Heme catabolism vector illustration. Labeled chemical blood reaction scheme
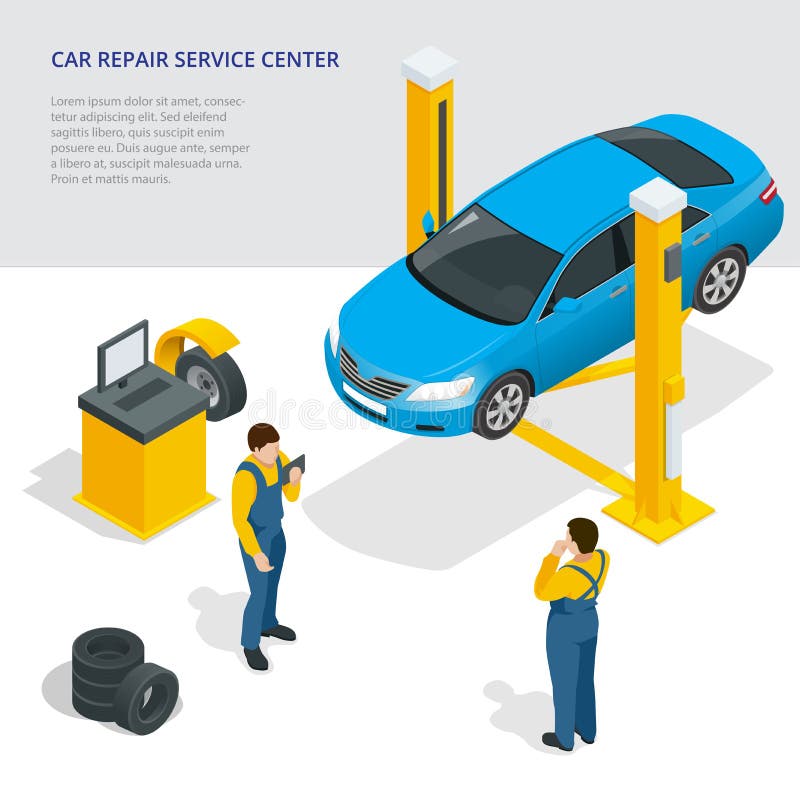
Free with trial Car repair service center. Tire service flat set with shop car repair mechanics. Flat 3d isometric vector illustration. Breakdown infographic vectors Car repair service center. Tire service flat set with shop car repair mechanics. Flat 3d isometric vector illustration.
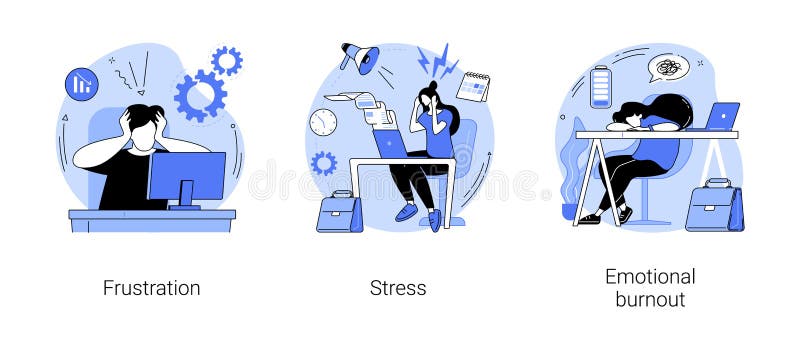
Free with trial Mental disorder abstract concept vector illustration set. Frustration and stress, emotional burnout, anger control, overworking, psychological help, depression diagnosis abstract metaphor. Breakdown infographic vectors Mental disorder abstract concept vector illustrations. Mental disorder abstract concept vector illustration set. Frustration and stress, emotional burnout, anger control, overworking, psychological help, depression diagnosis abstract metaphor.
Free with trial Infographic Guide, Policy Explanation, Visual Communication Concept with Character. Information Visualization Abstract Vector Illustration Set. Policy Breakdown Metaphor. Breakdown infographic illustrations Infographic Guide, Policy Explanation, Visual Communication Concept with Character. Information Visualization Abstract Vector
Free with trial How mobile phone radiation penetrates the brain infographic,vector illustration. Breakdown infographic vectors How mobile phone radiation penetrates the brain infographic
Free with trial The Low Carb Diet Food Pyramid. Vector illustration. Infographic on white background. Breakdown infographic vectors The Low Carb Diet Food Pyramid. Vector illustration. Infographic
Free with trial The Ketogenic Diet Food Pyramid. Vector illustration. Infographic on white background. Breakdown infographic vectors The Ketogenic Diet Food Pyramid. Vector illustration. Infographic
Free with trial This compelling infographic presents a 36% pie chart, a powerful data visualization tool, showcasing the multifaceted relationship between food and various aspects of modern life. The captivating food photography highlights the connection between nutrition, athletic performance, and economic factors. The breakdown within the 36% portion likely represents a specific category of healthy food. Breakdown infographic illustrations Visualizing the Interplay of Economy Health and Performance A 36 Food Photography Pie Chart Infographic. This compelling infographic presents a 36% pie chart, a powerful data visualization tool, showcasing the multifaceted relationship between food and various aspects of modern life. The captivating food photography highlights the connection between nutrition, athletic performance, and economic factors. The breakdown within the 36% portion likely represents a specific category of healthy food
Free with trial Family breakdown abstract concept vector illustration set. Divorce and separation, parental allowance, challenges for divorced dads, husband and wife conflict, single mom, alimony abstract metaphor. Breakdown infographic vectors Family breakdown abstract concept vector illustrations. Family breakdown abstract concept vector illustration set. Divorce and separation, parental allowance, challenges for divorced dads, husband and wife conflict, single mom, alimony abstract metaphor.
Free with trial Anxiety, Obsessive compulsive, ADHD, and Mental disorders concept. Closeup sad young man with a nervous breakdown thoughts above the head. Conceptual vector illustration. Breakdown infographic vectors Anxiety, Obsessive compulsive, Mental disorders concept. Closeup sad young man with a nervous breakdown thoughts above the head. Anxiety, Obsessive compulsive, ADHD, and Mental disorders concept. Closeup sad young man with a nervous breakdown thoughts above the head. Conceptual vector illustration
Free with trial A visually engaging circular infographic with 5 colorful segments and icons, ideal for presentations and data visualization purposes. Breakdown infographic vectors A visually engaging circular infographic with 5 colorful segments and icons, ideal for presentations and data visualization
Free with trial Vector isometric icon representing Car Repair Service garage building. Vector isometric icon or infographic element representing low poly Car Service station. Breakdown infographic vectors Vector isometric icon representing Car Repair Service garage building. Vector isometric icon or infographic element
Free with trial A colorful chart displays the breakdown of real earnings across various categories. The segments include red, green, yellow, blue, and purple, showing income distribution clearly. Breakdown infographic illustrations Real earnings breakdown chart illustrating distribution of income across different categories in a colorful design. A colorful chart displays the breakdown of real earnings across various categories. The segments include red, green, yellow, blue, and purple, showing income distribution clearly.
Free with trial Auto repair service infographic with mechanics working on a car, text and icons set: repair, tires, diagnostics, performance, roadside assistance. Breakdown infographic vectors Auto repair service
Free with trial Illustration of China's Stock Market Down Infographic Elements. Breakdown infographic vectors The Great Fall of China. Illustration of China's Stock Market Down Infographic Elements
Free with trial Neurons in the brain with Alzheimer`s disease, and amyloid plaques. Vector background. Alzheimer`s disease is the change in tau protein that results in the breakdown of microtubules in brain cells. Neurofibrillary tangles. Breakdown infographic vectors Neurons in the brain with Alzheimer`s disease, and amyloid plaques
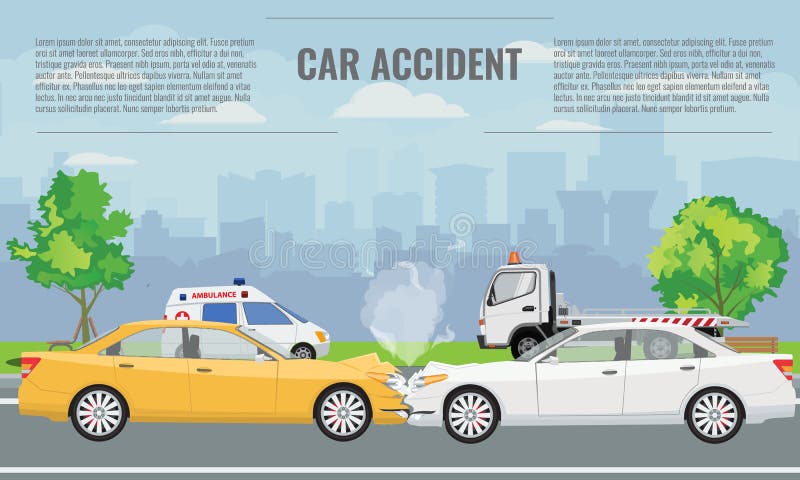
Free with trial Road incident infographic. Traffic motor vehicle collision, auto smash, emergency information and warnings. Vector flat style cartoon illustration isolated on white background. Breakdown infographic vectors Road incident infographic
Free with trial World map infographic vector template showing the demographic areas Europe North America Africa with proportionate percentages of statistics and text columns in blue. Breakdown infographic vectors World map infographic template. World map infographic vector template showing the demographic areas Europe North America Africa with proportionate percentages of statistics and text columns in blue.
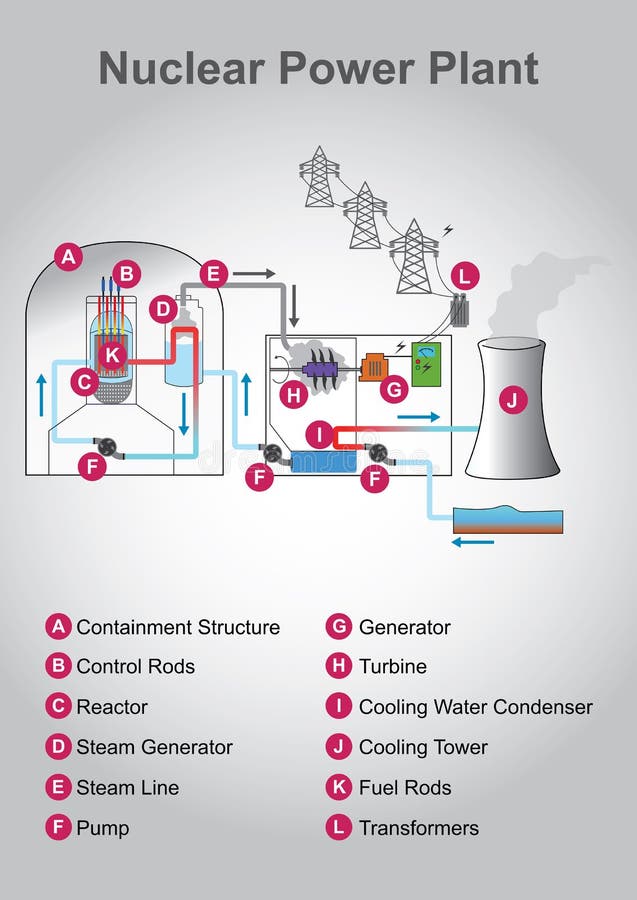
Free with trial Nuclear engineering is the branch of engineering concerned with the application of the breakdown fission as well as the fusion of atomic nuclei and/or the application of other sub-atomic physics. Breakdown infographic vectors Nuclear diagram. Education infographic. Vector design. Nuclear engineering is the branch of engineering concerned with the application of the breakdown fission as well as the fusion of atomic nuclei and/or the application of other sub-atomic physics.
Free with trial Ketogenic diet macros diagram, low carbs, high healthy fat - vector illustration for infographic. Breakdown infographic vectors Ketogenic diet macros diagram, low carbs, high healthy fat
Free with trial Emotional burnout abstract concept vector illustration. Psychological breakdown, burnout, emotional overload, psychologist consultation, mental health, stress and anxiety abstract metaphor. Breakdown infographic vectors Emotional burnout abstract concept vector illustration.
Free with trial Business strategy concept infographic diagram illustration of components of successful business. Breakdown infographic illustrations Business components business diagram illustration. Business strategy concept infographic diagram illustration of components of successful business
Free with trial Emotional burnout abstract concept vector illustration. Psychological breakdown, burnout, emotional overload, psychologist consultation, mental health, stress and anxiety abstract metaphor. Breakdown infographic vectors Emotional burnout abstract concept vector illustration.
Free with trial Business strategy concept infographic diagram illustration of public relations activities. Breakdown infographic illustrations Public relations business diagram illustration. Business strategy concept infographic diagram illustration of public relations activities
Free with trial Car crash or accident concept illustration. Flat and solid color vector illustration for infographic template. Breakdown infographic vectors Car crash or accident concept illustration. Vector illustration for infographic template. Car crash or accident concept illustration. Flat and solid color vector illustration for infographic template.
Free with trial Business strategy concept infographic diagram illustration of action learning. Breakdown infographic illustrations Bd003Action learning business diagram illustration-ActionLearni. Business strategy concept infographic diagram illustration of action learning
Free with trial Vector illustration loading red small car in the truck. One picture - loading process, the other - the car inside the body. Infographic in flat style on white isolated background. Breakdown infographic illustrations Small avto loading into truck. Vector illustration loading red small car in the truck. One picture - loading process, the other - the car inside the body. Infographic in flat style on white isolated background
Free with trial Roadside service abstract concept vector illustration. Roadside assistance, car service provider, truck breakdown, mechanical repair, vehicle towing, professional help to driver abstract metaphor. Breakdown infographic vectors Roadside service abstract concept vector illustration.
Free with trial Ketogenic diet macros pyramid, low carbs, high healthy fat - vector illustration for infographic. Breakdown infographic vectors Ketogenic diet macros pyramid, low carbs, high healthy fat
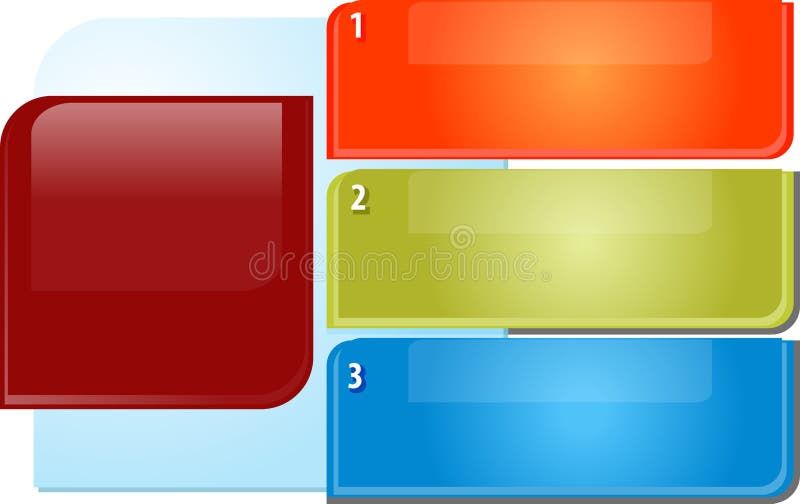
Free with trial Blank business strategy concept infographic diagram illustration of three bullet point topic. Breakdown infographic illustrations Three points Blank business diagram illustration. Blank business strategy concept infographic diagram illustration of three bullet point topic
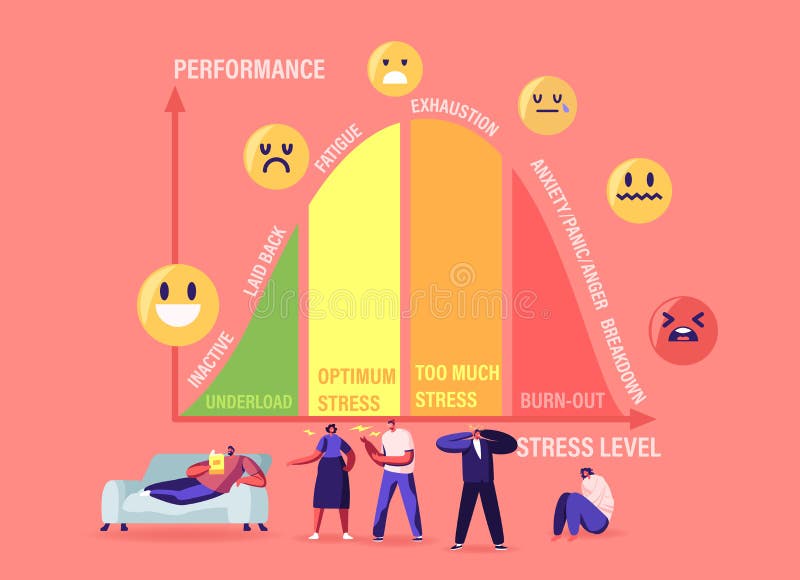
Free with trial Tiny Characters at Huge Stress Curve with Levels Inactive, Laid Back, Fatigue, Exhaustion and Anxiety with Panic and Anger Breakdown. Underload, Optimum, Burnout. Cartoon People Vector Illustration. Breakdown infographic vectors Tiny Characters at Huge Stress Curve with Levels Inactive, Laid Back, Fatigue, Exhaustion and Anxiety with Panic, Anger. Tiny Characters at Huge Stress Curve with Levels Inactive, Laid Back, Fatigue, Exhaustion and Anxiety with Panic and Anger Breakdown. Underload, Optimum, Burnout. Cartoon People Vector Illustration
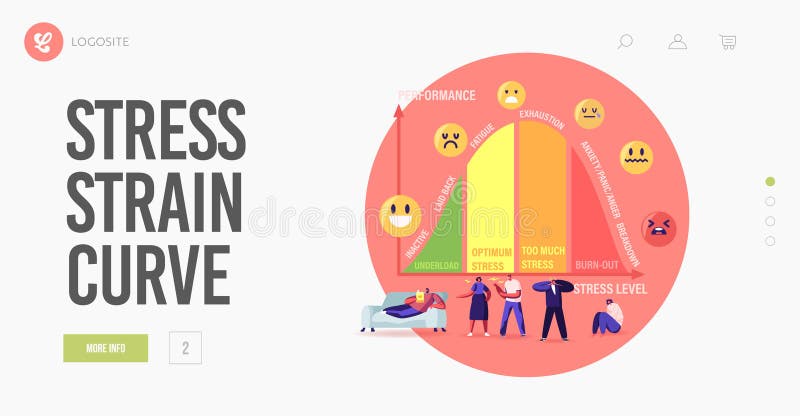
Free with trial Tiny Characters at Huge Stress Curve with Levels Landing Page Template. Inactive, Laid Back, Fatigue, Exhaustion and Anxiety with Panic and Anger Breakdown. Cartoon People Vector Illustration. Breakdown infographic vectors Characters at Huge Stress Curve with Levels Landing Page Template. Inactive, Laid Back, Fatigue, Exhaustion and Anxiety
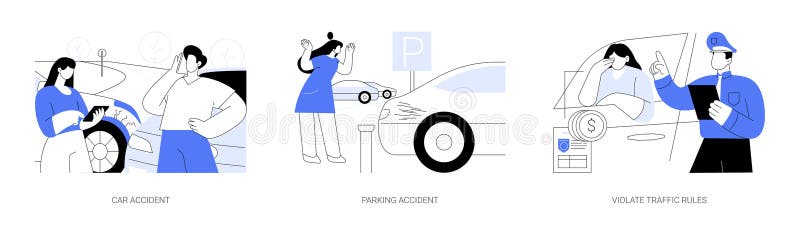
Free with trial Road traffic accident abstract concept vector illustration set. Car accident, scratching a car while parking, violate traffic rules, car breakdown, parking fine ticket abstract metaphor. Breakdown infographic vectors Road traffic accident abstract concept vector illustrations. Road traffic accident abstract concept vector illustration set. Car accident, scratching a car while parking, violate traffic rules, car breakdown, parking fine ticket abstract metaphor.
Free with trial Roadside service abstract concept vector illustration. Roadside assistance, car service provider, truck breakdown, mechanical repair, vehicle towing, professional help to driver abstract metaphor. Breakdown infographic vectors Roadside service abstract concept vector illustration.
Free with trial Emotional burnout abstract concept vector illustration. Psychological breakdown, burnout, emotional overload, psychologist consultation, mental health, stress and anxiety abstract metaphor. Breakdown infographic vectors Emotional burnout abstract concept vector illustration.
Free with trial Macronutrients explained with a clear outline diagram showing protein, carbs, and fats, their sources, and key functions. Main objects, food icons, Venn diagram, nutrient labels. Outline diagram. Breakdown infographic vectors Macronutrients explained with a clear outline diagram showing protein, carbs, ... Macronutrients explained with a clear outline diagram showing protein, carbs, and fats, their sources, and key functions. Main objects, food icons, Venn diagram, nutrient labels. Outline diagram
Free with trial Stress Curve shows the relationship between stress levels and performance, highlighting fatigue, exhaustion, and burnout. Doodle style diagram. Breakdown infographic vectors Stress Curve shows the relationship between stress levels and performance, ... Stress Curve shows the relationship between stress levels and performance, highlighting fatigue, exhaustion, and burnout. Doodle style diagram
Free with trial Modern Tow truck illustration, suitable for book, icon, print, game asset, infographic and other design related occasion. Breakdown infographic vectors Modern Urban Tow Truck Illustration. Modern Tow truck illustration, suitable for book, icon, print, game asset, infographic and other design related occasion.
Free with trial Asthmatic Airway Cells include lung fibroblasts, bronchial epithelial and bronchial smooth muscle cells. Health care education infographic. Vector design. Breakdown infographic vectors Asthmatic. Asthmatic Airway Cells include lung fibroblasts, bronchial epithelial and bronchial smooth muscle cells. Health care education infographic. Vector design.
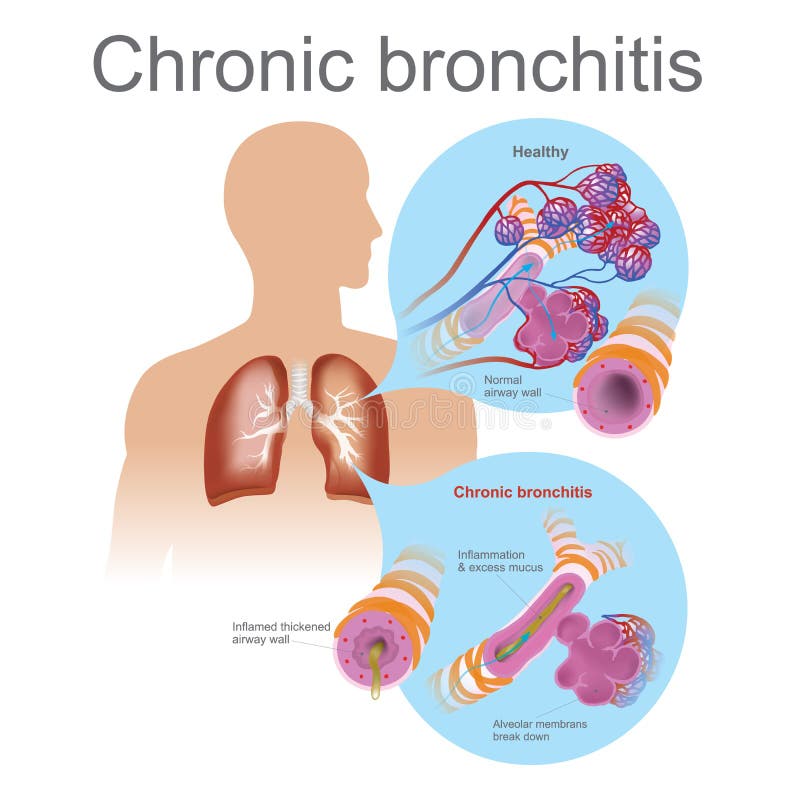
Free with trial Acute bronchitis is usually caused by viruses, typically the same viruses that cause colds and flu. Health care education infographic. Vector design. Breakdown infographic vectors Chronic bronchitis. Acute bronchitis is usually caused by viruses, typically the same viruses that cause colds and flu. Health care education infographic. Vector design.
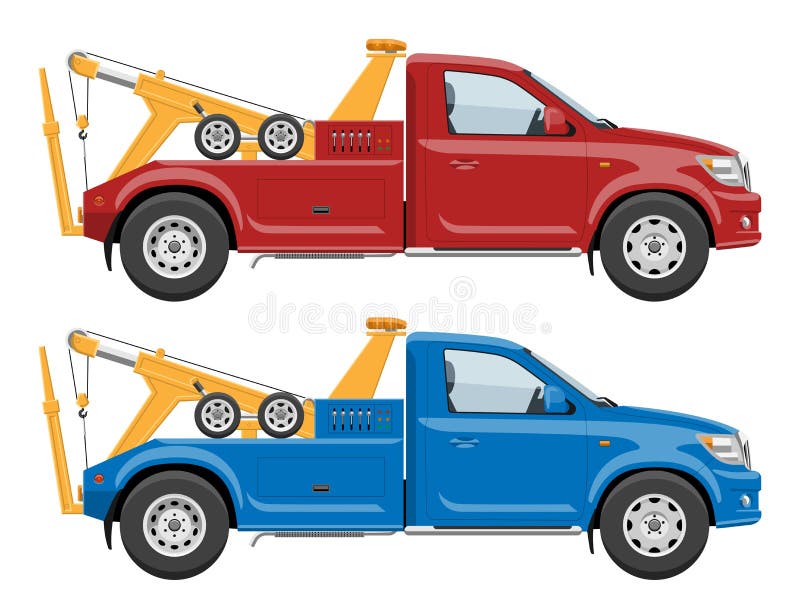
Free with trial Red and blue tow trucks side view vector template with simple colors without gradients and effects. Breakdown infographic vectors Red and blue tow trucks
Free with trial Modern Tow truck illustration, suitable for book, icon, print, game asset, infographic and other design related occasion. Breakdown infographic vectors Modern Urban Tow Truck Illustration. Modern Tow truck illustration, suitable for book, icon, print, game asset, infographic and other design related occasion.
Free with trial Motor Insurance Concept Background with various useful icons. Breakdown infographic illustrations Motor Insurance Background. Motor Insurance Concept Background with various useful icons
Free with trial Modern Tow truck illustration, suitable for book, icon, print, game asset, infographic and other design related occasion. Breakdown infographic vectors Modern Urban Tow Truck Illustration. Modern Tow truck illustration, suitable for book, icon, print, game asset, infographic and other design related occasion.
Free with trial Modern Tow truck illustration, suitable for book, icon, print, game asset, infographic and other design related occasion. Breakdown infographic vectors Modern Urban Tow Truck Illustration. Modern Tow truck illustration, suitable for book, icon, print, game asset, infographic and other design related occasion.
Free with trial Vector isometric car service building icon. Breakdown infographic vectors Vector isometric car Service
Free with trial Healthy Nutrition Education: Food Groups and Balanced Diet Concept. Diet Planning and Macronutrient Breakdown: Vegetables, Protein, Carbs. Healthy Eating Guide: Categorizing Food for a Balanced Diet. Breakdown infographic vectors Healthy Nutrition Education: Food Groups and Balanced Diet Concept
Free with trial Modern Tow truck illustration, suitable for book, icon, print, game asset, infographic and other design related occasion. Breakdown infographic vectors Modern Urban Tow Truck Illustration. Modern Tow truck illustration, suitable for book, icon, print, game asset, infographic and other design related occasion.
Free with trial Evacuation service transport. Car assistance help isometric vector. Breakdown infographic vectors Evacuation service. Car assistance vector. Evacuation service transport. Car assistance help isometric vector
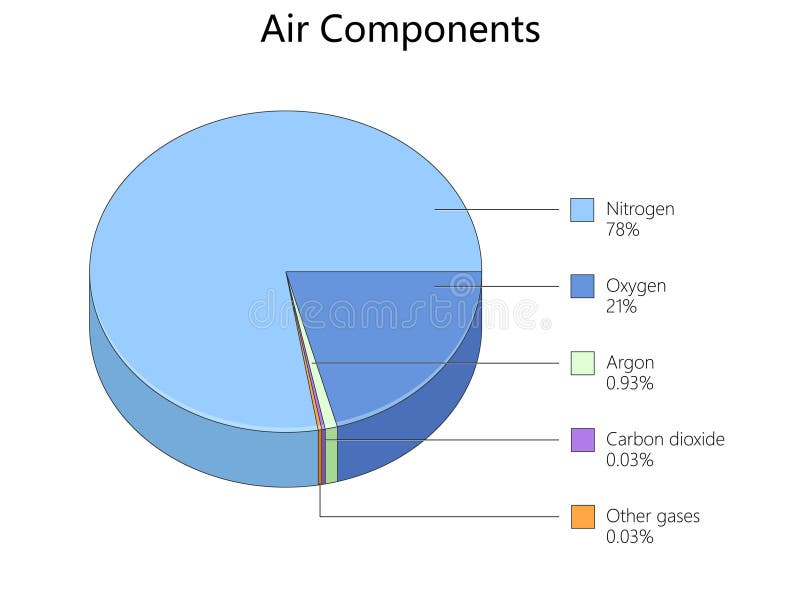
Free with trial Pie chart displaying the composition of Earths atmosphere with nitrogen, oxygen, argon, carbon dioxide, and other gases diagram hand drawn schematic vector. Science educational illustration. Breakdown infographic vectors Pie chart showing air composition percentages. pie chart displaying the composition of Earths atmosphere with nitrogen, oxygen, argon, carbon dioxide, and other gases diagram hand drawn schematic vector. Science educational illustration
Free with trial Tow truck city road assistance service evacuator. Tow truck delivers the damaged vehicle. Vector illustration on white background. Side view. Breakdown infographic vectors Tow truck city road assistance service evacuator. Tow truck delivers the damaged vehicle.
Free with trial Tow truck city road assistance service evacuator. Tow truck delivers the damaged vehicle. Vector illustration isolated on white background. Side view. Breakdown infographic vectors Tow truck city road assistance service evacuator. Tow truck delivers the damaged vehicle.
Free with trial Detailed exploded view diagram showcasing the individual components of a classic American muscle car. All parts are meticulously labeled, including the V8 engine, 4-speed manual transmission, chassis, drivetrain, and exterior body panels, illustrating automotive engineering and design. Breakdown infographic illustrations Exploded View of Classic American Muscle Car Engine, Transmission, Body Parts, and Chassis. Detailed exploded view diagram showcasing the individual components. Detailed exploded view diagram showcasing the individual components of a classic American muscle car. All parts are meticulously labeled, including the V8 engine, 4-speed manual transmission, chassis, drivetrain, and exterior body panels, illustrating automotive engineering and design.
Free with trial Foot arthritis image. Ankle osteoarthritis. Joint pain in human feet. Editable vector illustration in realistic colors on dark background. Medical scheme. Educational poster. Medicine science concept. Breakdown infographic vectors Foot arthritis image
Free with trial Template for the creation of the Ketogenic Diet food menu. Vector illustration. Seven-day vertical meal plan. black and white illustration. Breakdown infographic vectors Template for the creation of the food menu The Ketogenic Diet. Vector illustration. Seven-day vertical meal plan. black. Template for the creation of the Ketogenic Diet food menu. Vector illustration. Seven-day vertical meal plan. black and white illustration
Free with trial Types of Proximal Femur Fractures. Hip Fracture Types by Anatomical Location. Medical Diagram. Breakdown infographic vectors Types of Proximal Femur Fractures. Hip Fracture Types by Anatomical Location.
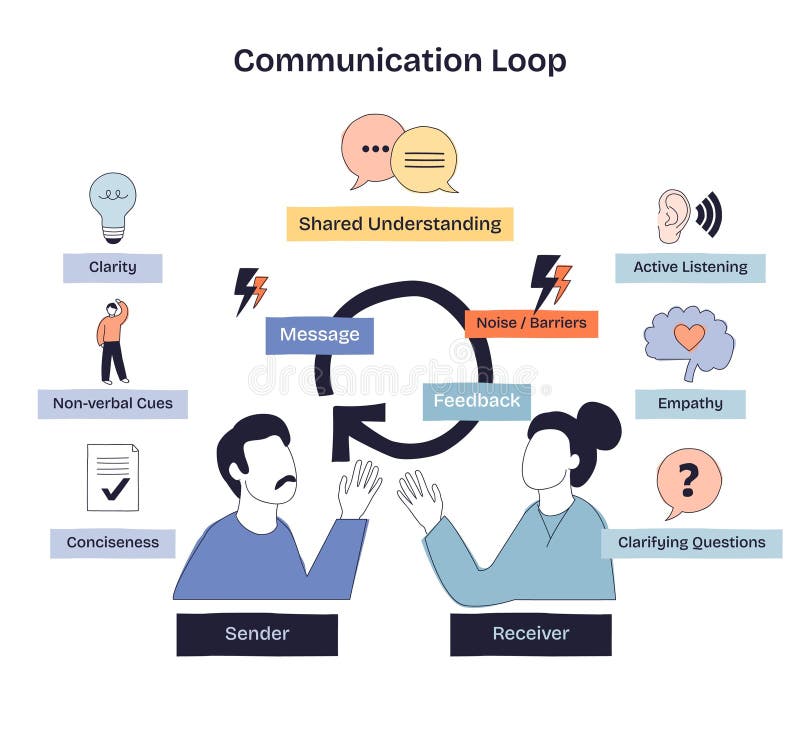
Free with trial Communication Loop shows sender, receiver, and message flow with feedback, highlighting shared understanding and barriers. Doodle style diagram. Breakdown infographic vectors Communication Loop shows sender, receiver, and message flow with feedback, ... Communication Loop shows sender, receiver, and message flow with feedback, highlighting shared understanding and barriers. Doodle style diagram
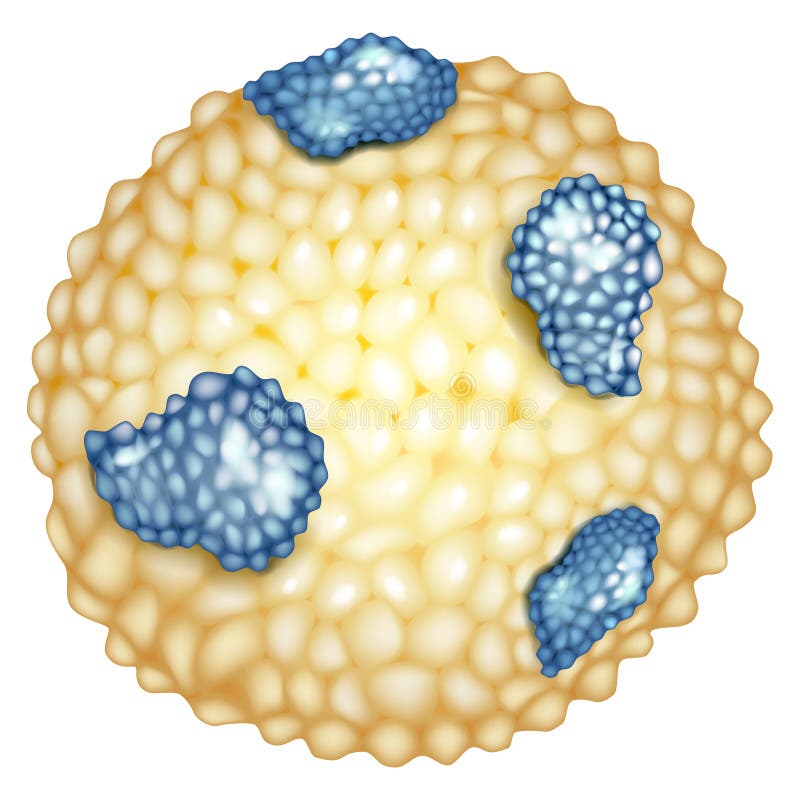
Free with trial Structure of Lipoproteins in the Body. Understanding Lipoproteins. Breakdown infographic vectors Structure of Lipoproteins in the Body. Cholesterol Transport Understanding Lipoproteins. Structure of Lipoproteins in the Body. Understanding Lipoproteins.
Free with trial Hand holding smartphone with map, help button, isometric city road, tow truck evacuator with auto, vector illustration. Online roadside assistance, car towing service mobile app concept for web banner. Breakdown infographic vectors Road assistance vector concept for web banner, website page. Hand holding smartphone with map, help button, isometric city road, tow truck evacuator with auto, vector illustration. Online roadside assistance, car towing service mobile app concept for web banner
Free with trial Car repair service center concept with worker man. Breakdown infographic vectors Car repair service center concept with tuning diagnostics flat elements and worker man. Car repair service center concept with worker man.
Free with trial Isometric Business on falling down the chart. Fail, Risk, Problem. Decline red arrow with businessman isolated on white background. Breakdown infographic vectors Isometric Business on falling down the chart. Fail, Risk, Problem. Decline red arrow with businessman isolated on white
Free with trial A case study business flyer design template is a professional marketing tool that showcases real-life success stories, client testimonials, or project achievements. It features a clean and structured layout with bold headings, engaging visuals, and well-organized content. Key elements include an attention-grabbing title, a summary of the case study, problem-solution breakdown, measurable results, and a strong call to action. The design should be visually appealing with a corporate color scheme and modern typography to maintain credibility. Ideal for business promotions, sales pitches, and client presentations, a well-crafted flyer enhances brand trust and effectively communicates the impact of your services. Breakdown infographic vectors Case study business flyer design template
Free with trial Car Check Up Automobile Service and Maintenance in vector style. Breakdown infographic vectors Car Check Up
Free with trial This pastel-colored pie chart, generated by AI, visually represents data proportions using 3D figures. It features two user icons and a percentage symbol, offering a simple yet effective way to display data breakdowns. The soft color palette adds a modern and approachable aesthetic. Breakdown infographic illustrations AI-Generated Pie Chart of Percentages. This pastel-colored pie chart, generated by AI, visually represents data proportions using 3D figures. It features two user icons and a percentage symbol, offering a simple yet effective way to display data breakdowns. The soft color palette adds a modern and approachable aesthetic.
Free with trial The image is a stylized illustration of a tree, divided into four sections representing different ecosystem services. the top left is green, showing oxygen production and ecosystem services. the top right is blue, representing water filtration. the bottom right is brown, symbolizing water storage and soil stability. each section has icons and text labels explaining the specific service provided by the tree and its environment. it is a visual representation of the importance of trees for ecological balance. Breakdown infographic illustrations Tree illustration: ecosystem services breakdown. the image is a stylized illustration of a tree, divided into four sections representing different ecosystem services. the top left is green, showing oxygen production and ecosystem services. the top right is blue, representing water filtration. the bottom right is brown, symbolizing water storage and soil stability. each section has icons and text labels explaining the specific service provided by the tree and its environment. it is a visual representation of the importance of trees for ecological balance.