Free with trial Finance icons set vector illustration. Contains such icon as calculator, Financial Agreement, Growth, Business Report and more. Expanded Stroke. Calculator financial growth decrease vectors Finance icons set vector illustration. Contains such icon as calculator, Financial Agreement, Growth, Business Report and more. Ex
Free with trial Copywriting icons set vector illustration. Contains such icon as content, writing, ideation, storytelling, editing, connection and more. Expanded Stroke. Calculator financial growth decrease vectors Copywriting icons set vector illustration. Contains such icon as content, writing, ideation, storytelling, editing and more. Expan
Free with trial Finance investment simple line icons. Vector illustration with minimal icon - briefcase, portfolio, certificate, gold bar, mortgage, quotes, car loan pictogram. Green Color Editable Stroke. Calculator financial growth decrease vectors Finance investment simple line icons. Vector illustration with minimal icon - briefcase, portfolio, certificate, gold
Free with trial Line icons about finance. Financial concept. Contains such icons as piggy bank, bank, stock market, investment and accounts. Editable stroke Vector 64x64 pixel perfect. Calculator financial growth decrease vectors Simple set of outline icons about finance. Financial concept. Line icons about finance. Financial concept. Contains such icons as piggy bank, bank, stock market, investment and accounts. Editable stroke Vector 64x64 pixel perfect
Free with trial Line icons about finance. Financial concept. Contains such icons as piggy bank, bank, stock market, investment and accounts. Editable stroke Vector 256x256 pixel perfect. Calculator financial growth decrease vectors Simple set of outline icons about finance. Financial concept. Line icons about finance. Financial concept. Contains such icons as piggy bank, bank, stock market, investment and accounts. Editable stroke Vector 256x256 pixel perfect
Free with trial Financial interest related line icon set. Debt and loan vector linear icon collection. Credit and lending money lined icons. Calculator financial growth decrease vectors Financial interest, Loan and Lending related line icon set. Financial interest related line icon set. Debt and loan vector linear icon collection. Credit and lending money lined icons.
Free with trial The concept of interest rate monitoring. Professionals analyze fluctuations in mortgage rates using a magnifying glass and charts, ensuring profitable financial decisions. Banking ideas. Flat vector. Calculator financial growth decrease vectors The concept of interest rate monitoring. Flat vector. The concept of interest rate monitoring. Professionals analyze fluctuations in mortgage rates using a magnifying glass and charts, ensuring profitable financial decisions. Banking ideas. Flat vector.
Free with trial Bar chart or bar graph decreasing vector icon with drop down arrow. Statistical data of stock, financial in business to loss, negative, decline or crisis. Graphic for report, presentation. 48x48 px. n. Calculator financial growth decrease vectors Bar chart or bar graph decreasing vector icon with drop down arrow. 48x48 pixel perfect and editable stroke. Bar chart or bar graph decreasing vector icon with drop down arrow. Statistical data of stock, financial in business to loss, negative, decline or crisis. Graphic for report, presentation. 48x48 px.n
Free with trial Bar chart or bar graph decreasing vector icon with drop down arrow. Statistical data of stock, financial in business to loss, negative, decline or crisis. Graphic for report, presentation. 48x48 px. n. Calculator financial growth decrease illustrations Bar chart or bar graph decreasing vector icon with drop down arrow. 48x48 pixel perfect and editable stroke. Bar chart or bar graph decreasing vector icon with drop down arrow. Statistical data of stock, financial in business to loss, negative, decline or crisis. Graphic for report, presentation. 48x48 px.n
Free with trial Bar chart or bar graph decreasing vector icon with drop down arrow. Statistical data of stock, financial in business to loss, negative, decline or crisis. Graphic for report, presentation. 48x48 px. n. Calculator financial growth decrease vectors Bar chart or bar graph decreasing vector icon with drop down arrow. 48x48 pixel perfect and editable stroke. Bar chart or bar graph decreasing vector icon with drop down arrow. Statistical data of stock, financial in business to loss, negative, decline or crisis. Graphic for report, presentation. 48x48 px.n
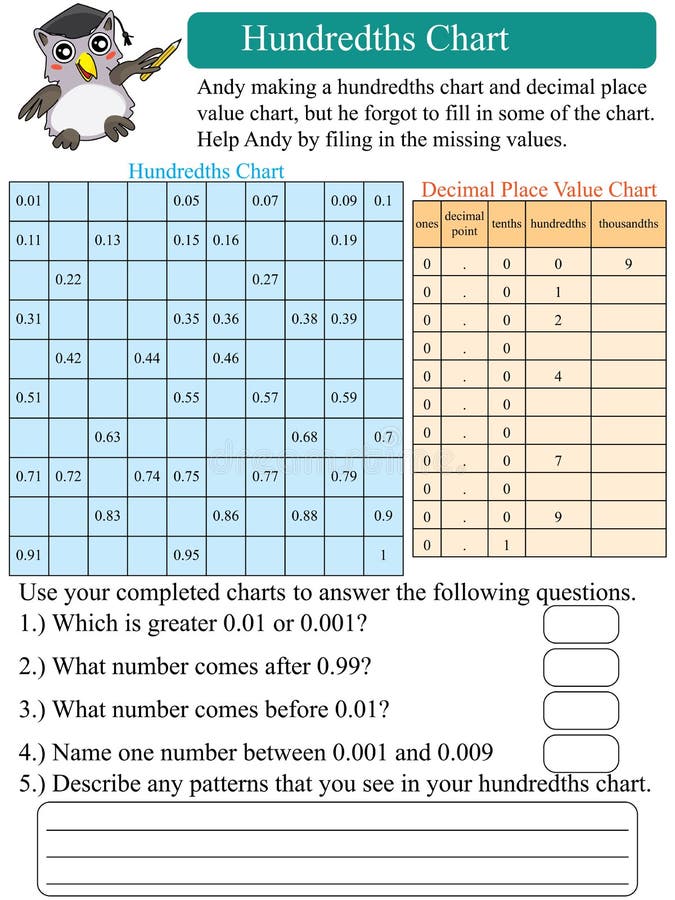
Free with trial Illustration design mathematics hundredths chart question. Calculator financial growth decrease vectors Mathematics hundredths chart
Free with trial Finance thin line icon set 3, vector eps10. Calculator financial growth decrease vectors Finance thin line icon set 3, vector eps10
Free with trial Set line Calculator Pie chart infographic Financial growth decrease and Network cloud connection. Business infographic template. Vector. Calculator financial growth decrease illustrations Set line Calculator, Pie chart infographic, Financial growth decrease and Network cloud connection. Business infographic
Free with trial Set Search data analysis, Pie chart infographic, Calculator, Financial growth decrease, with folder, and icon. Vector. Calculator financial growth decrease vectors Set Search data analysis, Pie chart infographic, Calculator, Financial growth decrease, with folder, and icon. Vector
Free with trial Set line Data analysis, Financial growth, Calculator, Folder and lock, decrease and icon. Vector. Calculator financial growth decrease illustrations Set line Data analysis, Financial growth, Calculator, Folder and lock, decrease and icon. Vector
Free with trial Set Sales funnel with chart, Financial growth decrease, Server and Calculator icon. Vector. Calculator financial growth decrease illustrations Set Sales funnel with chart, Financial growth decrease, Server and Calculator icon. Vector
Free with trial Set line Calculator, Mobile banking, Pos terminal and Financial growth decrease icon. Vector. Calculator financial growth decrease vectors Set line Calculator, Mobile banking, Pos terminal and Financial growth decrease icon. Vector
Free with trial This image depicts a vibrant and modern representation of financial success, featuring 3D bar graphs, pie charts, and a calculator, all set against a clean white background. The upward-trending graph showcases growth and progress. Calculator financial growth decrease illustrations Colorful 3D Financial Charts and Calculator Showing Business Growth. This image depicts a vibrant and modern representation of financial success, featuring 3D bar graphs, pie charts, and a calculator, all set against a clean white background. The upward-trending graph showcases growth and progress.
Free with trial This image depicts a vibrant blue calculator positioned next to a colorful bar graph and stack of gold coins, symbolizing financial success and growth. The scene is clean and bright, perfect for illustrating financial concepts. Calculator financial growth decrease illustrations Colorful Calculator, Bar Graph, and Coins Representing Financial Growth. This image depicts a vibrant blue calculator positioned next to a colorful bar graph and stack of gold coins, symbolizing financial success and growth. The scene is clean and bright, perfect for illustrating financial concepts.
Free with trial This 3D rendering showcases colorful bar graphs, pie charts, and a calculator, vividly illustrating concepts of business growth, financial success, and data analysis. The upward-trending arrow emphasizes positive progress. Calculator financial growth decrease illustrations Colorful 3D Charts and Calculator Illustrating Business Growth and Financial Success. This 3D rendering showcases colorful bar graphs, pie charts, and a calculator, vividly illustrating concepts of business growth, financial success, and data analysis. The upward-trending arrow emphasizes positive progress.
Free with trial Set Data analysis Financial growth decrease Mind map infographic Cloud download and upload Calculator Pie chart and icon. Vector. Calculator financial growth decrease illustrations Set Data analysis, Financial growth decrease, Mind map infographic, Cloud download and upload, Calculator, Pie chart and
Free with trial An overhead shot captures hands engaged in meticulous financial planning on a rustic wooden desk. Stacks of US quarters, a calculator, and a notebook filled with handwritten charts and graphs illustrate concepts of budgeting, savings, and investment. The scene suggests careful analysis of financial data, strategizing for future growth, or managing personal and business finances. Eyeglasses, a pen, and a coffee cup complete this focused work environment, ideal for themes of economy, wealth management, and financial success. Calculator financial growth decrease illustrations Financial Planning and Savings: Hands Analyzing Data with Coins and Calculator. An overhead shot captures hands engaged in meticulous financial planning on a rustic wooden desk. Stacks of US quarters, a calculator, and a notebook filled with handwritten charts and graphs illustrate concepts of budgeting, savings, and investment. The scene suggests careful analysis of financial data, strategizing for future growth, or managing personal and business finances. Eyeglasses, a pen, and a coffee cup complete this focused work environment, ideal for themes of economy, wealth management, and financial success.
Free with trial This image shows a calculator next to colorful 3D bar charts and pie charts illustrating business growth and financial success. The vibrant colors and upward-trending graph create a visually appealing representation of positive financial results. Calculator financial growth decrease illustrations Colorful Calculator and 3D Charts Showing Business Growth. This image shows a calculator next to colorful 3D bar charts and pie charts illustrating business growth and financial success. The vibrant colors and upward-trending graph create a visually appealing representation of positive financial results.
Free with trial Detailed 3D rendering of colorful bar charts, pie charts, line graphs, and calculator showcasing financial data analysis and business growth. Calculator financial growth decrease illustrations Colorful 3D Business Charts, Graphs, and Calculator for Financial Success. Detailed 3D rendering of colorful bar charts, pie charts, line graphs, and calculator showcasing financial data analysis and business growth.
Free with trial This vibrant image showcases a collection of colorful 3D charts and graphs, including bar graphs, pie charts, and a line graph, all illustrating positive growth. A calculator and pencil are included, emphasizing the analytical and planning aspects of business success. Perfect for illustrating finan. Calculator financial growth decrease illustrations Colorful 3D Financial Charts and Graphs with Calculator for Business Growth Presentation. This vibrant image showcases a collection of colorful 3D charts and graphs, including bar graphs, pie charts, and a line graph, all illustrating positive growth. A calculator and pencil are included, emphasizing the analytical and planning aspects of business success. Perfect for illustrating finan
Free with trial This illustration features a collection of five distinct icons representing various financial concepts. From left to right, it shows a Bitcoin symbol with an upward trending graph, an envelope overflowing with cash, a hand holding a gold coin, a calculator with a downward arrow and stacked coins labeled 'Cost Management', and a magnifying glass over a market analysis graph. The icons are stylized with a clean, flat design and vibrant colors, making them ideal for presentations, infographics, and financial content. Calculator financial growth decrease vectors Financial Concepts Icons: Bitcoin Growth, Cash Envelope, Investment, Cost Management, Market Analysis. This illustration features a collection of five distinct icons representing various financial concepts. From left to right, it shows a Bitcoin symbol with an upward trending graph, an envelope overflowing with cash, a hand holding a gold coin, a calculator with a downward arrow and stacked coins labeled 'Cost Management', and a magnifying glass over a market analysis graph. The icons are stylized with a clean, flat design and vibrant colors, making them ideal for presentations, infographics, and financial content.
Free with trial Financial icons including coins, ATM, gold bars, calculator, piggy bank, and credit card, representing money and banking. Calculator financial growth decrease vectors Financial icons including coins, ATM, gold bars, calculator, piggy bank, and credit card
Free with trial A hand-drawn illustration featuring a large percentage symbol at the center, surrounded by various financial and business-related doodles. Icons include bar charts, pie charts, stacks of coins, a calculator, dollar signs, and numerous arrows indicating direction, flow, or change. The style is simple, black and white line art, suitable for representing concepts like finance, economics, growth, discounts, and business analysis. Calculator financial growth decrease illustrations Doodle Financial Icons and Percentage Symbol. A hand-drawn illustration featuring a large percentage symbol at the center, surrounded by various financial and business-related doodles. Icons include bar charts, pie charts, stacks of coins, a calculator, dollar signs, and numerous arrows indicating direction, flow, or change. The style is simple, black and white line art, suitable for representing concepts like finance, economics, growth, discounts, and business analysis.
Free with trial A calculator displaying the word INFLATION with upward arrows, surrounded by stacks of coins, loose change, a pen, and financial charts on a desk, symbolizing economic growth and financial analysis. Calculator financial growth decrease illustrations Inflation Calculator with Coins and Charts on Desk. A calculator displaying the word INFLATION with upward arrows, surrounded by stacks of coins, loose change, a pen, and financial charts on a desk, symbolizing economic growth and financial analysis
Free with trial A detailed financial analysis scene featuring a whiteboard calculator, a magnifying glass hovering over pie charts, and gold coins scattered on documents with bar graphs. This overhead shot on a wooden desk conveys concepts of auditing, investment, and financial planning. This image was generated with the assistance of artificial intelligence. Calculator financial growth decrease illustrations Financial Analysis Calculator, Magnifying Glass, Charts, and Coins on Desk. A detailed financial analysis scene featuring a whiteboard calculator, a magnifying glass hovering over pie charts, and gold coins scattered on documents with bar graphs. This overhead shot on a wooden desk conveys concepts of auditing, investment, and financial planning.This image was generated with the assistance of artificial intelligence.
Free with trial This image shows a calculator with a dollar coin and arrows, symbolizing financial calculations, investments, and accounting on a blue background. Calculator financial growth decrease vectors Vector art of calculator with dollar coin and arrows indicating financial calculation, isolated on blue background it represents. This image shows a calculator with a dollar coin and arrows, symbolizing financial calculations, investments, and accounting on a blue background
Free with trial Calculator and decreasing stacks of coins on a modern office desk. Represents financial analysis, savings, or investment concepts in a professional work environment. Calculator financial growth decrease illustrations Financial Planning in Modern Office: Calculator and Decreasing Coin Stacks on Desk. Calculator and decreasing stacks of coins on a modern office desk. Represents financial analysis, savings, or investment concepts in a professional work environment
Free with trial This image features financial analysis and cryptocurrency icons, including money, calculator, bear market, graphs, bitcoin, and a digital display, all in one place. Calculator financial growth decrease vectors Vector art of financial analysis and cryptocurrency icons, featuring money, calculator, bear market, graphs, bitcoin, and digital. This image features financial analysis and cryptocurrency icons, including money, calculator, bear market, graphs, bitcoin, and a digital display, all in one place
Free with trial This image showcases a businessman illustrating the concept of cost reduction and profit growth holding graphic elements that represent financial data analysis market performance and strategic planning The composition suggests a focus on improving business outcomes through careful financial management and investment decisions leading to increased profitability and overall success in competitive. Calculator financial growth decrease illustrations Cost reduction and profit growth strategy depicted by businessman with graphic elements indicating financial performance and. This image showcases a businessman illustrating the concept of cost reduction and profit growth holding graphic elements that represent financial data analysis market performance and strategic planning The composition suggests a focus on improving business outcomes through careful financial management and investment decisions leading to increased profitability and overall success in competitive
Free with trial Blue calculator and gold coins near downward trending blue graph. Financial loss and budget, calculation concept. Business analytics data. Economic recession illustration. Digital accounting. Calculator financial growth decrease illustrations Blue calculator and gold coins near downward trending blue graph. Financial loss and budget calculation concept. Business. Blue calculator and gold coins near downward trending blue graph. Financial loss and budget, calculation concept. Business analytics data. Economic recession illustration. Digital accounting
Free with trial This set of icons shows different aspects of money circulation, investment, financial growth and profit. Calculator financial growth decrease vectors Money circulation, investment, financial growth and profit flat icons set. This set of icons shows different aspects of money circulation, investment, financial growth and profit
Free with trial Calculator alongside arrows indicating increase and decrease, and a line graph with fluctuations. Ideal for finance, budgeting, economics, analysis, statistics, decision-making, simple flat metaphor. Calculator financial growth decrease illustrations Calculator with Arrows and Graph Representing Financial Analysis and Data Trends. Calculator alongside arrows indicating increase and decrease, and a line graph with fluctuations. Ideal for finance, budgeting, economics, analysis, statistics, decision-making, simple flat metaphor
Free with trial Downward arrows representing decline, calculator symbolizing calculations, and percentage sign for financial analysis. Ideal for business, finance, data analysis, interest rate, savings, growth. Calculator financial growth decrease vectors Decreasing Trends with Financial Calculation and Percentage Concept. Downward arrows representing decline, calculator symbolizing calculations, and percentage sign for financial analysis. Ideal for business, finance, data analysis, interest rate, savings, growth
Free with trial This image features a collection of various financial and business growth icons. It includes symbols representing money, graphs, charts, and other financial metrics. The icons are colorful and designed to illustrate concepts such as investment, profit, growth, and financial planning. Calculator financial growth decrease illustrations Financial and business growth icons
Free with trial A collection of eight thin-line related to finance and business. The depict a stack of coins with a dollar sign, a document with a dollar sign, an upward trending graph over city buildings, and a bar chart with a plus sign. The bottom row coins and currency symbols, a calculator with a dollar sign, a document with a calculator and charts, and a person. Calculator financial growth decrease illustrations Financial set with charts and calculator finance business. A collection of eight thin-line related to finance and business. The depict a stack of coins with a dollar sign, a document with a dollar sign, an upward trending graph over city buildings, and a bar chart with a plus sign. The bottom row coins and currency symbols, a calculator with a dollar sign, a document with a calculator and charts, and a person
Free with trial This image shows a calculator, tablet, and financial charts, all generated by AI for illustrative purposes. The blue color scheme emphasizes the data-driven nature of modern finance and business analytics. The image suggests efficiency and precision in financial planning and analysis. Calculator financial growth decrease illustrations Financial Data Analysis. This image shows a calculator, tablet, and financial charts, all generated by AI for illustrative purposes. The blue color scheme emphasizes the data-driven nature of modern finance and business analytics. The image suggests efficiency and precision in financial planning and analysis.
Free with trial This 3D illustration depicts a purple calculator as the central element, set against a clean white background. Various colorful, stylized icons float around it, representing concepts related to business and finance. The icons include a percentage sign, an upward trend graph, a dollar sign, a notification bell, and a message bubble. The composition suggests themes of accounting, financial analysis. Calculator financial growth decrease illustrations A purple calculator surrounded by business and financial icons in a 3d cartoon style. This 3D illustration depicts a purple calculator as the central element, set against a clean white background. Various colorful, stylized icons float around it, representing concepts related to business and finance. The icons include a percentage sign, an upward trend graph, a dollar sign, a notification bell, and a message bubble. The composition suggests themes of accounting, financial analysis
Free with trial This image depicts stacks of coins diminishing in size as they approach a small house model, with a calculator nearby. It represents financial concepts like declining property value, investment risk, or housing affordability. high-quality professional detailed modern elegant stylish clean. Calculator financial growth decrease illustrations Stacks of coins decreasing towards a miniature house symbolizing financial investment or declining property values. This image depicts stacks of coins diminishing in size as they approach a small house model, with a calculator nearby. It represents financial concepts like declining property value, investment risk, or housing affordability. high-quality professional detailed modern elegant stylish clean
Free with trial This 3D render shows a calculator with a colorful bar chart made of cubes illustrating growth and success in business and finance. Perfect for presentations and infographics. Calculator financial growth decrease illustrations Colorful 3D Calculator with Growing Bar Chart Cubes for Business and Finance. This 3D render shows a calculator with a colorful bar chart made of cubes illustrating growth and success in business and finance. Perfect for presentations and infographics.
Free with trial Calculator with purple screen, upward-trending performance graph, and downward arrow. Ideal for finance, accounting, budgeting, data analysis, cost reduction, investment strategy simple flat. Calculator financial growth decrease vectors Financial calculation with a calculator, performance graph, and downward arrow for data analysis. Calculator with purple screen, upward-trending performance graph, and downward arrow. Ideal for finance, accounting, budgeting, data analysis, cost reduction, investment strategy simple flat
Free with trial This AI-generated image depicts a calculator displaying "TAX-2025" alongside a bar graph, illustrating potential tax revenue projections for the year. The graph, generated by AI, shows a projected decrease in tax revenue over time. This visualization is helpful for financial planning and forecastin. Calculator financial growth decrease illustrations Tax Projections 2025. This AI-generated image depicts a calculator displaying "TAX-2025" alongside a bar graph, illustrating potential tax revenue projections for the year. The graph, generated by AI, shows a projected decrease in tax revenue over time. This visualization is helpful for financial planning and forecastin
Free with trial Icons in two colorsabout finance. Financial concept. Contains such icons as piggy bank, bank, stock market, investment and accounts. Editable stroke. Calculator financial growth decrease vectors Icons in two colors about finance. Financial concept. Icons in two colorsabout finance. Financial concept. Contains such icons as piggy bank, bank, stock market, investment and accounts. Editable stroke
Free with trial Vector graphic showing business profit and loss statement with green upward trends, red declines, percentages, calculator, and money icons. Calculator financial growth decrease illustrations Illustrated Profit and Loss Financial Report with Charts and Graphs. Vector graphic showing business profit and loss statement with green upward trends, red declines, percentages, calculator, and money icons
Free with trial Icons in two tones about finance. Financial concept. Contains such icons as piggy bank, bank, stock market, investment and accounts. Editable stroke. Calculator financial growth decrease vectors Icons in two tones about finance. Financial concept
Free with trial This image showcases a red piggy bank, calculator, and pen, symbolizing financial planning. The realistic scene was generated by AI, emphasizing the tools needed for effective savings and budgeting. Perfect for financial literacy resources. Calculator financial growth decrease illustrations Saving & Budgeting Tools. This image showcases a red piggy bank, calculator, and pen, symbolizing financial planning. The realistic scene was generated by AI, emphasizing the tools needed for effective savings and budgeting. Perfect for financial literacy resources.
Free with trial Hand-drawn financial charts, graphs, and calculators perfect for business, finance, and accounting illustrations. These vector illustrations depict various tools used for data analysis and financial calculations. Calculator financial growth decrease vectors Collection of Hand Drawn Financial Charts and Calculators. Hand-drawn financial charts, graphs, and calculators perfect for business, finance, and accounting illustrations. These vector illustrations depict various tools used for data analysis and financial calculations.
Free with trial Colorful Charts on a Calculator Keyboard. Calculator financial growth decrease illustrations Colorful Charts on a Calculator Keyboard
Free with trial Financial planning graph shows coins and pen. Calculator financial growth decrease illustrations Financial planning graph shows coins and pen
Free with trial A vibrant and playful collection of hand-drawn financial and business icons. The set includes a bar graph, gold bars, a downward arrow, calculators, a smiley face, and cartoon dollar bills. These icons are perfect for illustrating concepts related to finance, economics, investment, and business growth. The simple and cheerful design makes them ideal for educational materials, presentations, and websites. Calculator financial growth decrease vectors Finance and Business Icons Set. A vibrant and playful collection of hand-drawn financial and business icons. The set includes a bar graph, gold bars, a downward arrow, calculators, a smiley face, and cartoon dollar bills. These icons are perfect for illustrating concepts related to finance, economics, investment, and business growth. The simple and cheerful design makes them ideal for educational materials, presentations, and websites.
Free with trial This illustration, generated by AI, depicts a modern workspace with a computer displaying financial charts and graphs, surrounded by icons representing money, calculations, and productivity. It symbolizes financial analysis and data-driven decision-making. Calculator financial growth decrease illustrations AI-Generated Financial Data Visualization. This illustration, generated by AI, depicts a modern workspace with a computer displaying financial charts and graphs, surrounded by icons representing money, calculations, and productivity. It symbolizes financial analysis and data-driven decision-making.
Free with trial Red percentage symbols and arrows indicate financial growth and decline. Abstract concept for sales, discounts, or market fluctuations. Calculator financial growth decrease vectors Red percentage signs and arrows pointing up and down upwards. Red percentage symbols and arrows indicate financial growth and decline. Abstract concept for sales, discounts, or market fluctuations
Free with trial Financial concept illustrating economic recession with declining stacks of coins spelling "CUTS" and downward red arrow, representing budget reductions, economic downturn, or decreased revenue. Calculator, laptop, and pen on wooden desk in office background. Calculator financial growth decrease illustrations Decreasing stacks of coins with cuts word and red arrow pointing downwards. Financial concept illustrating economic recession with declining stacks of coins spelling "CUTS" and downward red arrow, representing budget reductions, economic downturn, or decreased revenue. Calculator, laptop, and pen on wooden desk in office background
Free with trial Collection of white icons arranged on a blue background representing financial and commercial objects in a clean, minimalist style. Calculator financial growth decrease vectors Collection of Business Finance and Banking Icons Representing Investment and Financial Operations. Collection of white icons arranged on a blue background representing financial and commercial objects in a clean, minimalist style.
Free with trial Calculator, coin, dollar sign, green arrows, up, down. Calculator financial growth decrease vectors Calculator, coin, dollar sign
Free with trial A high-quality 3D rendering of a dark gray calculator with a large, red percentage symbol resting on the plus button. The image is clean, modern, and perfect for illustrating concepts related to finance, discounts, interest rates, sales, and percentage calculations. The isolated white background makes it easy to incorporate into various designs. Calculator financial growth decrease vectors 3D Render of Calculator with Percentage Sign. A high-quality 3D rendering of a dark gray calculator with a large, red percentage symbol resting on the plus button. The image is clean, modern, and perfect for illustrating concepts related to finance, discounts, interest rates, sales, and percentage calculations. The isolated white background makes it easy to incorporate into various designs.
Free with trial A set of simple outline icons related to financial and investment themes, featuring dollar signs and clean, minimalistic designs. Calculator financial growth decrease vectors Simple Outline Financial and Investment Icons Symbol Set with Dollar Sign. A set of simple outline icons related to financial and investment themes, featuring dollar signs and clean, minimalistic designs.
Free with trial 3D rendering of a cute cartoon house model, a calculator, and stacks of coins, illustrating the concept of home buying expenses and financial planning. A great image for articles, websites, or presentations related to real estate, mortgages, and financial planning. Calculator financial growth decrease illustrations Cartoon House Model with Calculator and Coins: Home Purchase Cost Calculation. 3D rendering of a cute cartoon house model, a calculator, and stacks of coins, illustrating the concept of home buying expenses and financial planning. A great image for articles, websites, or presentations related to real estate, mortgages, and financial planning.
Free with trial A grid of 28 simple black line art icons on a white background depicting various financial charts graphs and business related symbols including bar charts pie charts computers and money. Calculator financial growth decrease vectors Collection of 28 minimalist line art icons representing financial data charts and business concepts graph. A grid of 28 simple black line art icons on a white background depicting various financial charts graphs and business related symbols including bar charts pie charts computers and money
Free with trial Decline Chart : A decline chart illustrates a decrease in financial performance, sales, or market value over time. Calculator financial growth decrease illustrations Decline Chart
Free with trial Tax Graph Down : A Tax Graph Down represents a decrease in tax revenue or a financial decline. Calculator financial growth decrease vectors Tax Graph Down
Free with trial 3D model of tax percentage sign. Suitable for financial articles, accounting presentations, tax related blog posts or business websites. 3D Rendering. Calculator financial growth decrease illustrations 3D model of tax percentage sign.
Free with trial Financial data analysis tools, vibrant background Generative AI. Calculator financial growth decrease illustrations Financial data analysis tools
Free with trial Computer keyboard keys with TSA, tax sheltered annuary text. Financial, Management, Economic. close up of Computer keyboard keys,Business Concept. Supports PNG files with transparent backgrounds. Calculator financial growth decrease vectors Computer keyboard keys with TSA, tax sheltered annuary text. Financial, Management, Economic.
Free with trial Wooden elements with TSA, tax sheltered annuary text. Financial, Management, Economic. close up of wooden elements,Business Concept. Supports PNG files with transparent backgrounds. Calculator financial growth decrease vectors Wooden elements with TSA, tax sheltered annuary text. Financial, Management, Economic.close up of wooden elements
Free with trial Wooden cubes with TSA, tax sheltered annuary text. Financial, Management, Economic. close up of wooden cubes,Business Concept. Supports PNG files with transparent backgrounds. Calculator financial growth decrease vectors Wooden cubes with TSA, tax sheltered annuary text. Financial, Management, Economic.close up of wooden cubes,Business Concept.
Free with trial A person's hands using a calculator with a red downward trending arrow and the word COST superimposed on a blurred office background. Calculator financial growth decrease illustrations Person calculating cost reduction with red down arrow. A person's hands using a calculator with a red downward trending arrow and the word COST superimposed on a. A person's hands using a calculator with a red downward trending arrow and the word COST superimposed on a blurred office background
Free with trial House is placed on the coin and calculator with illustration of interest concept of calculating interest payments. planning savings money of coins to buy a home concept for property, mortgage, invest. Calculator financial growth decrease illustrations House is placed on the coin and calculator with illustration of interest concept of calculating interest payments. planning
Free with trial Slide switch with TSA, tax sheltered annuary text. Financial, Management, Economic. close up of slide switch,Business Concept. 3D rendering on green background. Calculator financial growth decrease illustrations Slide switch with TSA, tax sheltered annuary text. Financial, Management, Economic.close up of slide switch
Free with trial Slide switch with TSA, tax sheltered annuary text. Financial, Management, Economic. close up of slide switch,Business Concept. 3D rendering on blue background. Calculator financial growth decrease illustrations Slide switch with TSA, tax sheltered annuary text. Financial, Management, Economic.close up of slide switch. slide switch with TSA, tax sheltered annuary text. Financial, Management, Economic.close up of slide switch,Business Concept.3D rendering on blue background.
Free with trial Wooden cubes with TSA, tax sheltered annuary text. Financial, Management, Economic. close up of wooden cubes,Business Concept. Supports PNG files with transparent backgrounds. Calculator financial growth decrease vectors Wooden cubes with TSA, tax sheltered annuary text. Financial, Management, Economic.close up of wooden cubes
Free with trial Yellow button with TSA, tax sheltered annuary text. Financial, Management, Economic. close up button of keyboard,Business Concept. 3D rendering on blue background. Calculator financial growth decrease illustrations Yellow button with TSA, tax sheltered annuary text. Financial, Management, Economic.
Free with trial Wooden cubes with TSA, tax sheltered annuary text. Financial, Management, Economic. close up of wooden cubes,Business Concept. 3D rendering on yellow background. Calculator financial growth decrease illustrations Wooden cubes with TSA, tax sheltered annuary text. Financial, Management, Economic.close up of wooden cubes
Free with trial Wood cube block with TSA, tax sheltered annuary text. Financial, Management, Economic. close up of wooden elements,Business Concept. 3D rendering on blue background. Calculator financial growth decrease illustrations Wood cube block with TSA, tax sheltered annuary text. Financial, Management, Economic.
Free with trial Wood cube block with TSA, tax sheltered annuary text. Financial, Management, Economic. close up of wooden elements,Business Concept. 3D rendering on red background. Calculator financial growth decrease illustrations Wood cube block with TSA, tax sheltered annuary text. Financial, Management, Economic.
Free with trial Wood cube block with TSA, tax sheltered annuary text. Financial, Management, Economic. close up of wooden elements,Business Concept. 3D rendering on black background. Calculator financial growth decrease illustrations Wood cube block with TSA, tax sheltered annuary text. Financial, Management, Economic.