Free with trial 3D stock market diagram on white grid background. Computer render. Candlestick graph data illustrations Stock market chart. 3D stock market diagram on white grid background. Computer render.
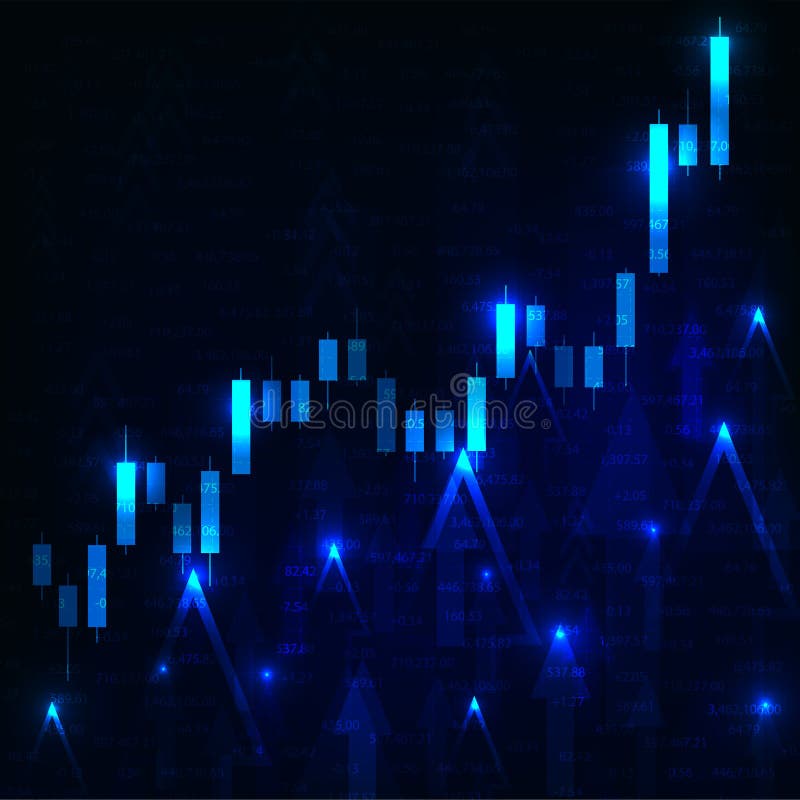
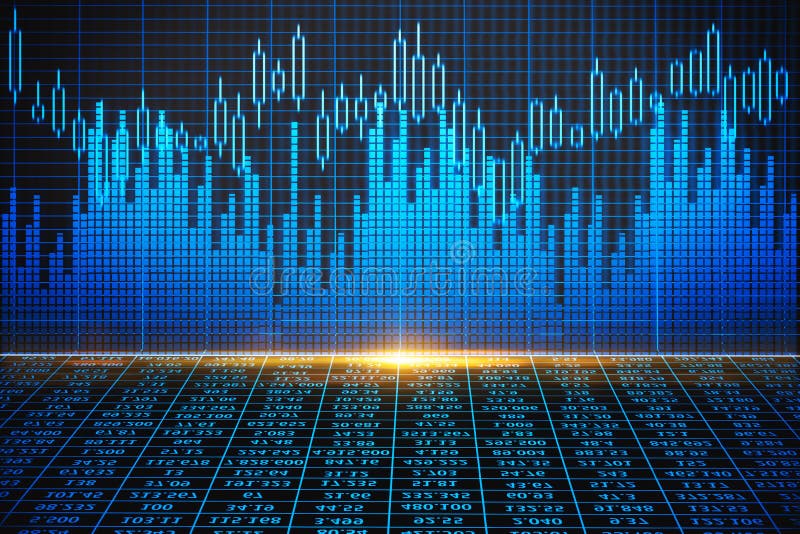
Free with trial Finance chart. Stock graph market. Growth business blue vector background. Bond data online bank. Candlestick graph data vectors Finance chart. Stock graph market. Growth business blue vector background. Bond data online bank
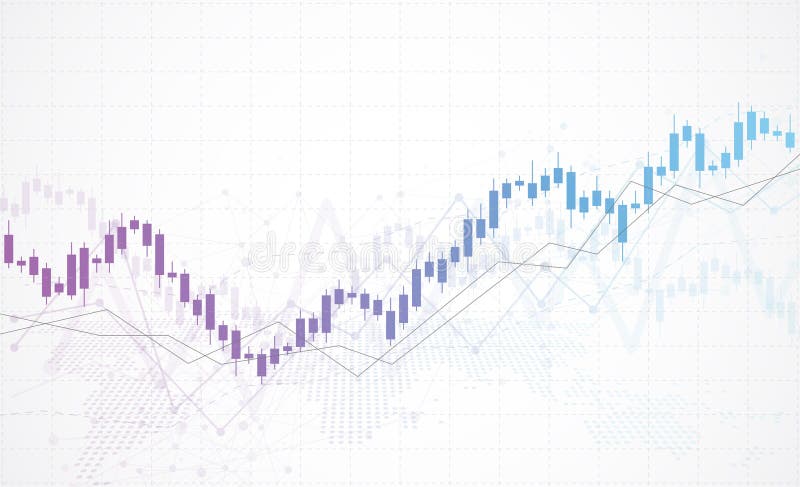
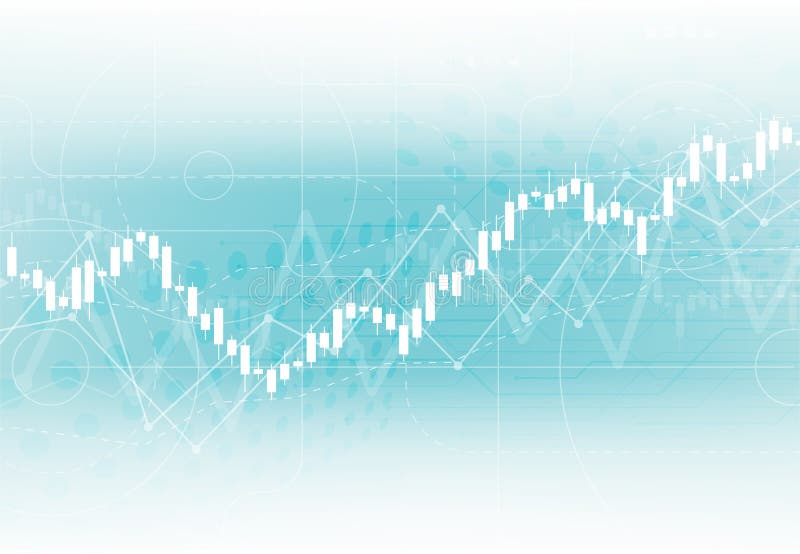
Free with trial Financial chart candle stick graph business data analysis of stock market investment trading. vector background. Candlestick graph data vectors Business candle stick graph chart of stock market investment trading on blue background. vector illustration. Financial chart candle stick graph business data analysis of stock market investment trading. vector background
Free with trial Simple Set of Graph and Diagram Related Color Vector Line Icons. Contains such Icons as Presentation, Pie Chart, Round Diagram, Candlestick Chart and more. Editable Stroke. 64x64 Pixel Perfect. Candlestick graph data vectors Line Diagram Icons. Simple Set of Graph and Diagram Related Color Vector Line Icons. Contains such Icons as Presentation, Pie Chart, Round Diagram, Candlestick Chart and more. Editable Stroke. 64x64 Pixel Perfect.
Free with trial Doubtful stock exchange market trader holding hand on chin analyzing index candlestick graph deciding to buy or sell shares or equity. Financial market business man. Flat style vector illustration. Candlestick graph data vectors Stock market trader analyzing candlestick graph. Doubtful stock exchange market trader holding hand on chin analyzing index candlestick graph deciding to buy or sell shares or equity. Financial market business man. Flat style vector illustration.
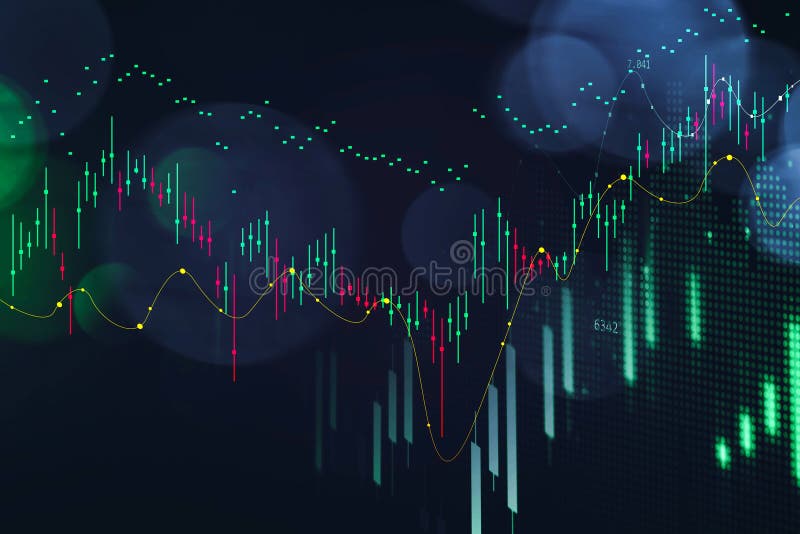
Free with trial Stock market price digital display abstract. Modern virtual technology, illustration binary code on abstract technology background. Media gray and black image with graphs and icons. New modern computer and business strategy as concept. Financial diagram with candlestick chart used in market analysis for variation report of share price Stock market chart, graph on green background Shallow DOF effect. Candlestick graph data illustrations Display of Stock market quotes chart graph on m Abstract financial background trade colorful green, blue, red abstract. Data on li. Stock market price digital display abstract. Modern virtual technology, illustration binary code on abstract technology background. Media gray and black image with graphs and icons. New modern computer and business strategy as concept. Financial diagram with candlestick chart used in market analysis for variation report of share price Stock market chart, graph on green background Shallow DOF effect
Free with trial Stock market price digital display abstract. Modern virtual technology, illustration binary code on abstract technology background. Media gray and black image with graphs and icons. New modern computer and business strategy as concept. Financial diagram with candlestick chart used in market analysis for variation report of share price Stock market chart, graph on green background Shallow DOF effect. Candlestick graph data illustrations World economics graph. Finance concept. Forex stock market charts on computer display. Financial graphs on the computer monitor. Stock market price digital display abstract. Modern virtual technology, illustration binary code on abstract technology background. Media gray and black image with graphs and icons. New modern computer and business strategy as concept. Financial diagram with candlestick chart used in market analysis for variation report of share price Stock market chart, graph on green background Shallow DOF effect
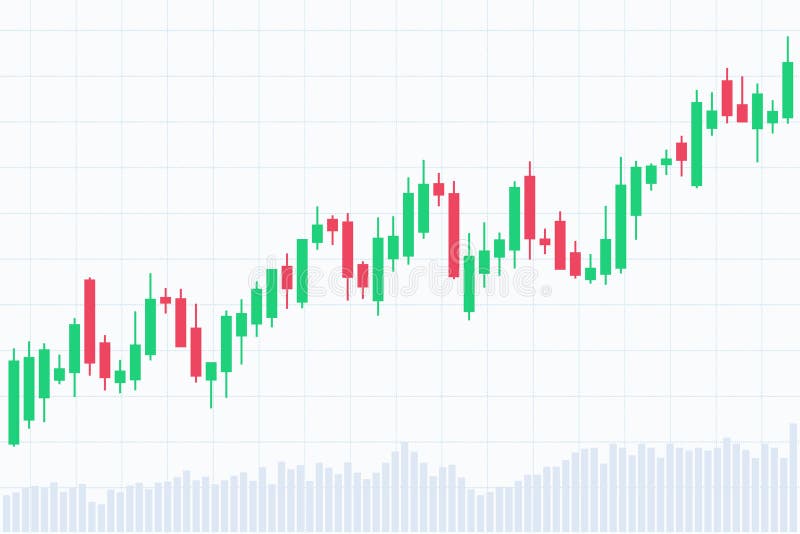
Free with trial Abstract Business chart with up trend line graph, bar chart and stock numbers in bull market on white color background. Candlestick graph data illustrations Abstract Business chart with up trend line graph, bar chart and stock numbers on white color background
Free with trial Vector illustration of Forex growth candlestick diagram. Candlestick graph data vectors Forex chart diagram. Vector illustration of Forex growth candlestick diagram
Free with trial Vector uptrend market of stock chart on black background. Graph pattern. Candlestick graph data vectors Vector uptrend market of stock chart. Vector uptrend market of stock chart on black background. Graph pattern.
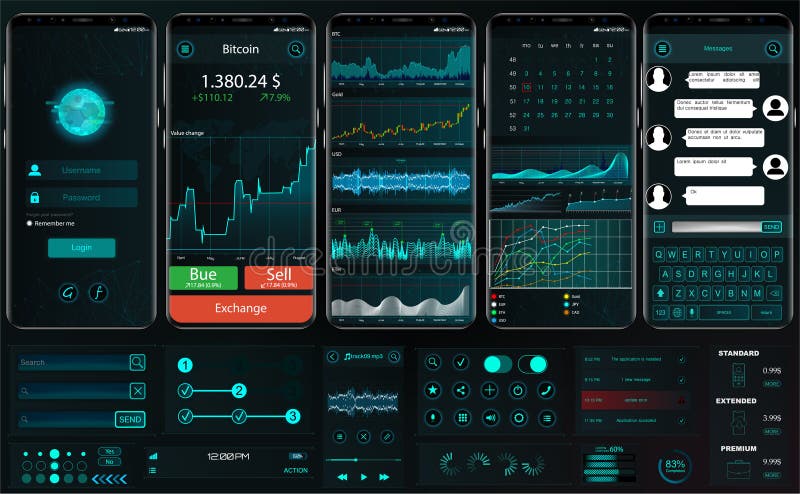
Free with trial Interface app template for trading platform. UI, UX, Kit. Professional trader tools for successful trading. Trade exchange app on phone screen. Mobile banking cryptocurrency ui. Vector set elements. Candlestick graph data vectors Interface app template for trading platform. ui ux. Interface app template for trading platform. UI, UX, Kit. Professional trader tools for successful trading. Trade exchange app on phone screen. Mobile banking cryptocurrency ui. Vector set elements
Free with trial The schedule forex in the form of candles against the white background. Candlestick graph data illustrations Schedule forex
Free with trial Stock market candle line chart of bullish trend. Candlestick graph data vectors Stock market candle line chart of bullish trend
Free with trial Business candlestick and financial graph chart suitable for Forex stock market investment trading concept, Global network connection and Business analytics on abstract background. Candlestick graph data vectors Business candlestick and financial graph chart suitable for Forex stock market investment trading concept. Business candlestick and financial graph chart suitable for Forex stock market investment trading concept, Global network connection and Business analytics on abstract background.
Free with trial Business candlestick and financial graph chart suitable for Forex stock market investment trading concept, Global network connection and Business analytics on abstract background. Candlestick graph data vectors Business candlestick and financial graph chart suitable for Forex stock market investment trading concept. Business candlestick and financial graph chart suitable for Forex stock market investment trading concept, Global network connection and Business analytics on abstract background.
Free with trial Stock market price digital display abstract. Modern virtual technology, illustration binary code on abstract technology background. Media gray and black image with graphs and icons. New modern computer and business strategy as concept. Financial diagram with candlestick chart used in market analysis for variation report of share price Stock market chart, graph on green background. Stock market graph. Bar graphs, diagrams, financial figures. Trading on market concept. Closeup photo. Stock trade live. Online forex data screen concept. Finance business diagram on the screen. Shallow DOF effect. Candlestick graph data illustrations Stock market graph. Bar graphs, diagrams, financial figures. Trading on market concept. Closeup photo. Stock trade live forex. Stock market price digital display abstract. Modern virtual technology, illustration binary code on abstract technology background. Media gray and black image with graphs and icons. New modern computer and business strategy as concept. Financial diagram with candlestick chart used in market analysis for variation report of share price Stock market chart, graph on green background. Stock market graph. Bar graphs, diagrams, financial figures. Trading on market concept. Closeup photo. Stock trade live. Online forex data screen concept. Finance business diagram on the screen. Shallow DOF effect
Free with trial Candlestick trading graph isolated on png or transparent background, investing stocks market,buy and sell sign candlestick, vector illustration. Candlestick graph data vectors Candlestick trading graph isolated on png or transparent background, investing stocks market,buy and sell sign candlestick. Candlestick trading graph isolated on png or transparent background, investing stocks market,buy and sell sign candlestick, vector illustration
Free with trial Trading candlestick chart on electronic devices vector illustration. Stock exchange market graph on smartphone, desktop and tablet creative concept. Vector. Candlestick graph data vectors Trading candlestick chart on electronic devices vector illustration. Stock exchange market graph on smartphone
Free with trial Stock market concept. Candle stick chart world map. Global financial marketing, exchange investment abstract forex vector concept. Profit data graph stock, finance chart candlestick illustration. Candlestick graph data vectors Stock market concept. Candle stick chart world map. Global financial marketing, exchange investment abstract forex
Free with trial Digital stock market or forex trading graph and candlestick chart suitable for financial investment. Financial Investment trends for business background concept. Candlestick graph data illustrations Digital stock market or forex trading graph and candlestick chart suitable for financial investment. Financial Investment trends
Free with trial Digital stock market or forex trading graph and candlestick chart suitable for financial investment. Financial Investment trends for business background concept. Candlestick graph data illustrations Digital stock market or forex trading graph and candlestick chart suitable for financial investment. Financial Investment trends
Free with trial Business candle stick graph chart of stock market investment trading with world map. Stock market and exchange. Stock market data. Trend of graph. Vector illustration for your design. Candlestick graph data vectors Business candle stick graph chart of stock market investment trading with world map. Stock market and exchange. Stock
Free with trial Japan candlestick chart (vector format enable). Candlestick graph data vectors Japan candlestick
Free with trial Candlestick chart on display close-up. Candlestick graph data illustrations Candlestick chart
Free with trial Blue candlestick chart in a dark background. Candlestick graph data vectors Candlestick chart abstract background. Blue candlestick chart in a dark background.
Free with trial Stock market chart. Business graph background, Financial Background, Economic Background. Candlestick graph data illustrations Stock market graph. Abstract finance background, Stock market chart. Business graph background, Financial Background. Stock market chart. Business graph background, Financial Background, Economic Background
Free with trial Business charts and data icons thin line set. Flat style color vector symbols isolated on white. Candlestick graph data vectors Business charts and data icons thin line set
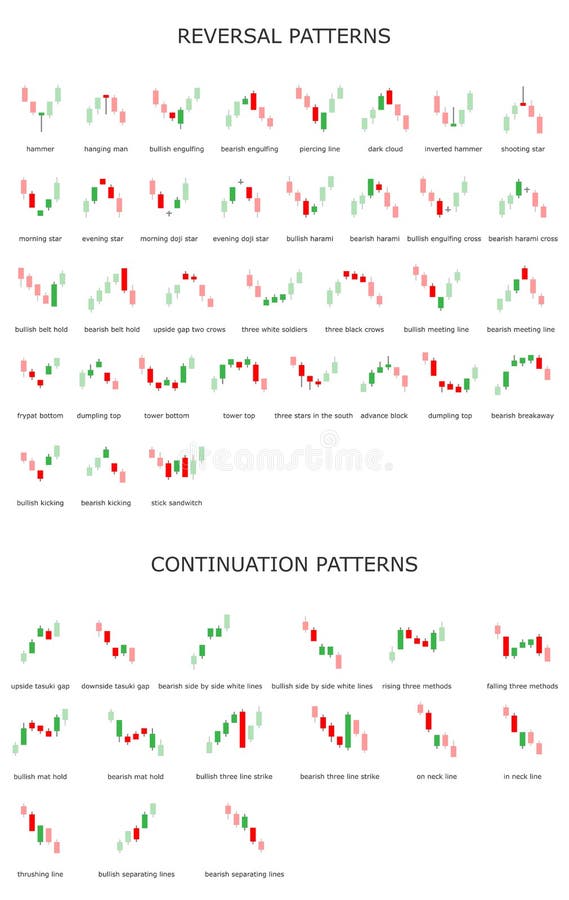
Free with trial Candlestick patterns is a style of financial chart, Suitable for forex stock market investment trading concept and used to describe price movements of a security, derivative, or currency. Candlestick graph data vectors Candlestick strategy indicator with bullish and bearish engulfing pattern. Candlestick patterns is a style of financial chart, Suitable for forex stock market investment trading concept and used to describe price movements of a security, derivative, or currency.
Free with trial Forex candlestick chart over dark background. Candlestick graph data illustrations Forex candlestick chart over dark
Free with trial The schedule for changing the stock market graph in a positive direction. The investment economy and the development of new financial tools for trade online. Vector illustration. Candlestick graph data vectors The schedule for changing the stock market graph in a positive direction. The investment economy and the development of
Free with trial Business candle stick graph chart of stock market investment trading on white background design. Bullish point, Trend of graph. Vector illustration. Candlestick graph data vectors Business candle stick graph chart of stock market investment trading on white background design. Bullish point, Trend of graph.
Free with trial Forex trading candlestick chart. Bullish pattern. Suitable also for stock exchange and crypto price analysis. Candlestick graph data vectors Forex trading candlestick chart uptrend. Forex trading candlestick chart. Bullish pattern. Suitable also for stock exchange and crypto price analysis
Free with trial Business candle stick graph chart of stock market investment trading on white background design. Bullish point, Trend of graph. Vector illustration. Candlestick graph data vectors Business candle stick graph chart of stock market investment trading on white background design. Bullish point, Trend of graph.
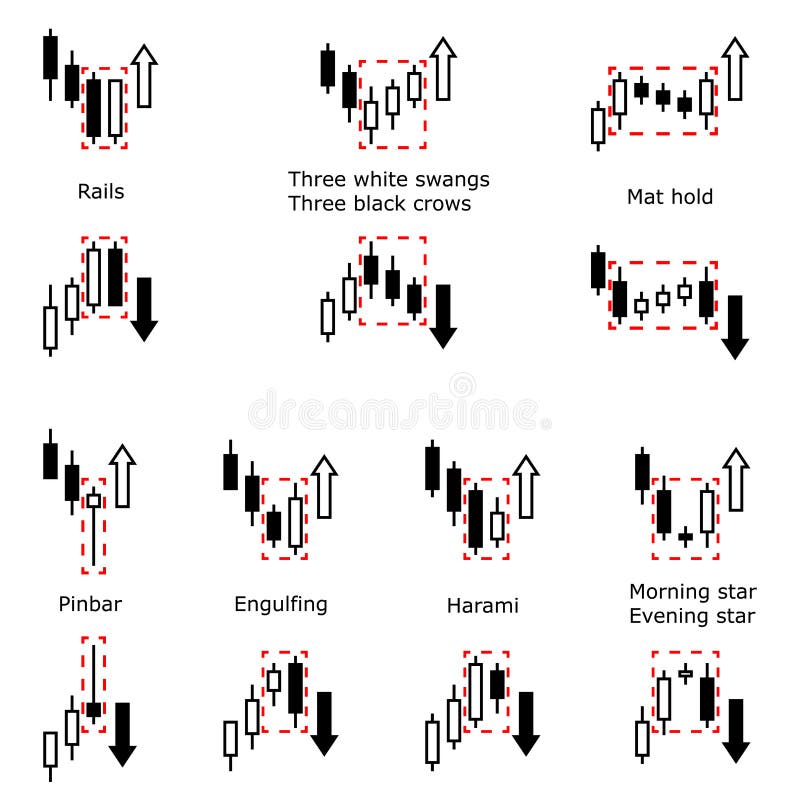
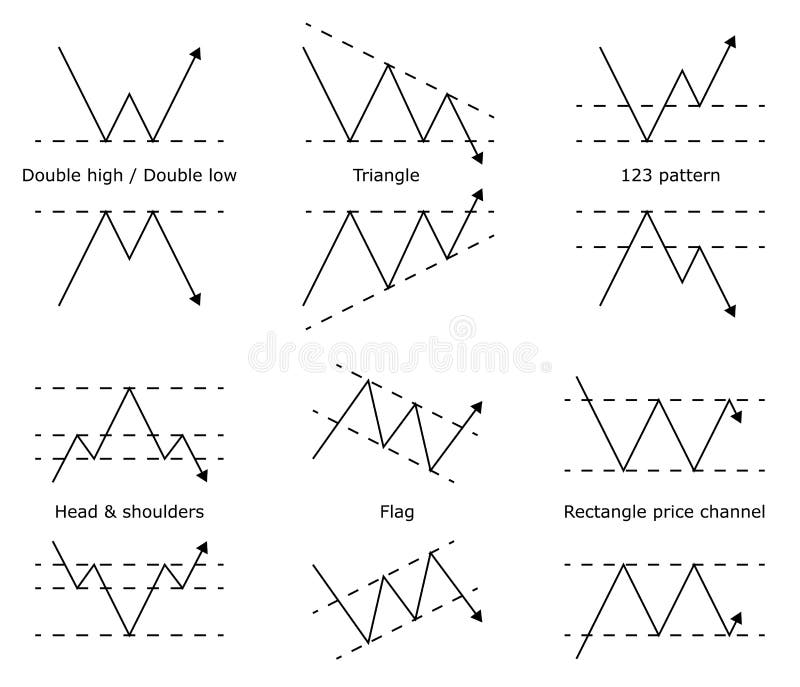
Free with trial Forex stock trade pattern. Forex stock graphic models. Price prediction. Trading signal. Candlestick patters. Vector illustration. Candlestick graph data vectors Forex stock trade pattern. Trading signal. Candlestick patters. Forex stock trade pattern. Forex stock graphic models. Price prediction. Trading signal. Candlestick patters. Vector illustration.
Free with trial Forex stock trade pattern. Forex stock graphic models. Price prediction. Trading signal. Candlestick patters. Vector illustration. Candlestick graph data vectors Forex stock trade pattern. Trading signal. Candlestick patters. Forex stock trade pattern. Forex stock graphic models. Price prediction. Trading signal. Candlestick patters. Vector illustration.
Free with trial Stock market or forex trading graph and chart, market and financial investment concept background design, vector illustration. Candlestick graph data vectors Stock market or forex trading graph and chart, market and financial
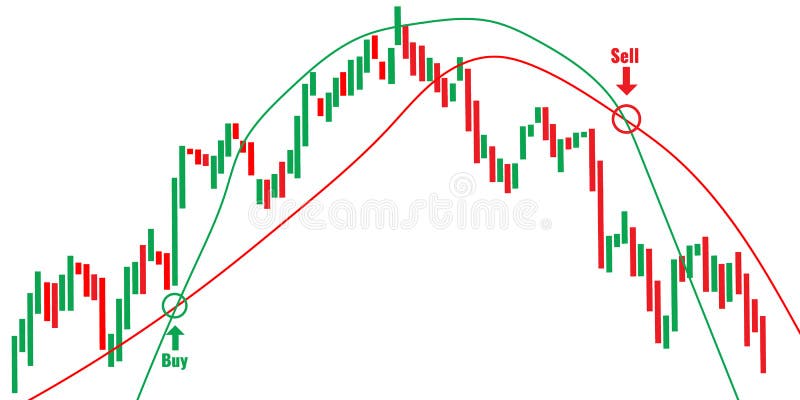
Free with trial Forex Trade Signals and online trading concept. Sell and Buy indicators on candlestick chart graphic design. Vector illustration. Candlestick graph data vectors Forex Trade Signals concept. Sell and Buy indicators on candlestick chart graphic design. Forex Trade Signals and online trading concept. Sell and Buy indicators on candlestick chart graphic design. Vector illustration.
Free with trial Vector abstract illustration. Financial market data. Forex trading concept. Stock exchange symbol. 3D Vector illustration. Candlestick graph data vectors Vector abstract illustration. Financial market data. Forex trading concept. Stock exchange symbol.3D Vector illustration
Free with trial Stock market or Forex trading graph in graphic concept for financial investment or economic trends business idea design. Worldwide finance background. Vector illustration. Candlestick graph data vectors Stock market or Forex trading graph in graphic concept for financial investment or economic trends business idea design. Worldwide finance background. Vector
Free with trial Atm money, Shopping basket and Coins line icons set. Loan percent, Candlestick graph and Growth chart signs. Column diagram, Online payment symbols. Dollar currency, Sale offer. Finance set. Vector. Candlestick graph data vectors Atm money, Shopping basket and Coins icons set. Loan percent, Candlestick graph and Growth chart signs. Vector. Atm money, Shopping basket and Coins line icons set. Loan percent, Candlestick graph and Growth chart signs. Column diagram, Online payment symbols. Dollar currency, Sale offer. Finance set. Vector
Free with trial Vector uptrend market of stock chart on black background. Graph pattern. Candlestick graph data vectors Vector uptrend market of stock chart. Vector uptrend market of stock chart on black background. Graph pattern.
Free with trial Forex stock market investment trading concept, Candlestick pattern with bullish and bearish is a style of financial chart, Suitable for describe price movements of a security, derivative, or currency. Candlestick graph data vectors Forex stock market investment trading concept
Free with trial Forex stock market investment trading concept, Candlestick pattern with bullish and bearish is a style of financial chart, Suitable for describe price movements of a security, derivative, or currency. Candlestick graph data vectors Forex stock market investment trading concept
Free with trial Candle stick graph chart of stock market investment trading, Stock exchange concept design and background. Vector illustrations. Candlestick graph data vectors Stock exchange background. Candle stick graph chart of stock market investment trading, Stock exchange concept design and background. Vector illustrations
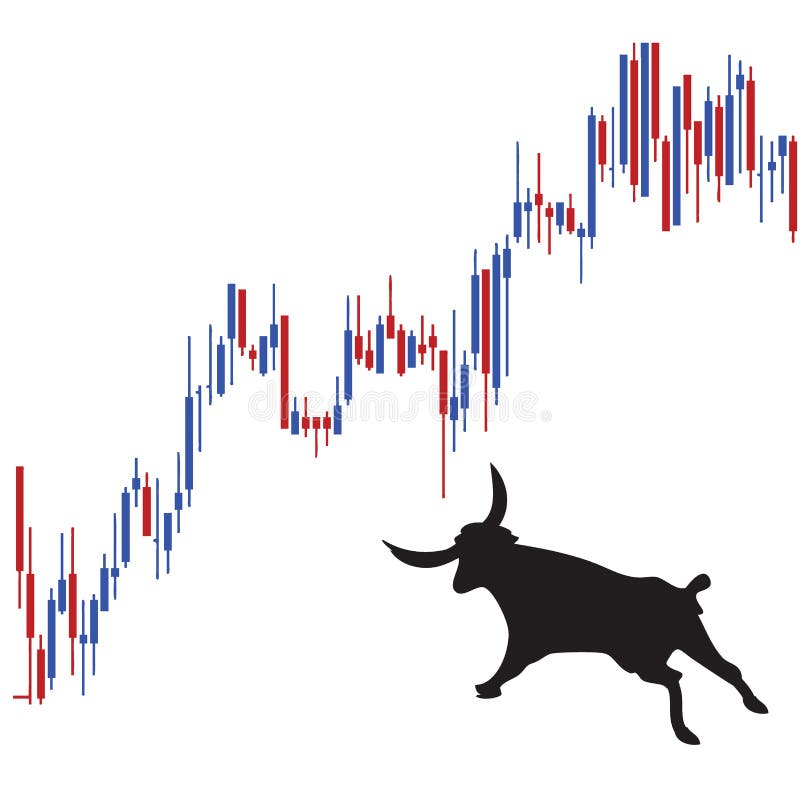
Free with trial Conceptual bull market illustration rocket to the moon. Candlestick graph data illustrations Stock Chart. Conceptual bull market illustration rocket to the moon
Free with trial The schedule forex in the form of candles against. Candlestick graph data illustrations Forex
Free with trial Blue symbols of dollar currency lying on trading chart. Candlestick graph data illustrations Dollar chart. Blue symbols of dollar currency lying on trading chart
Free with trial Simple Set of Charts and Diagrams Related Vector Line Icons. Contains such Icons as Dot Plot, 3D Chart, Trend and more. Editable Stroke. 48x48 Pixel Perfect. Candlestick graph data vectors Line Charts and Diagrams Icons. Simple Set of Charts and Diagrams Related Vector Line Icons. Contains such Icons as Dot Plot, 3D Chart, Trend and more. Editable Stroke. 48x48 Pixel Perfect.
Free with trial This candlesticks are in strong bullish trend. Candlestick graph data vectors Exchange - bullish trend. This candlesticks are in strong bullish trend.
Free with trial Forex trading with the blue chart. Candlestick graph data illustrations Forex trading
Free with trial Commodity trading market investment concept economy vector. Candlestick graph data vectors Commodity trading market investment concept in economy. Commodity trading market investment concept economy vector
Free with trial Stock market ticker wall in yellow with various numbers and graphs. Candlestick graph data illustrations Stock market ticker wall in yellow
Free with trial Vector stock charts and market analysis in blue theme. Illustration about stock investment. Ideal for technology concept background. Candlestick graph data vectors Vector stock charts and market analysis in blue theme.
Free with trial Creative blue forex wall background. Market, stock, fund management and economy concept. 3D Rendering. Candlestick graph data illustrations Blue forex background. Creative blue forex wall background. Market, stock, fund management and economy concept. 3D Rendering
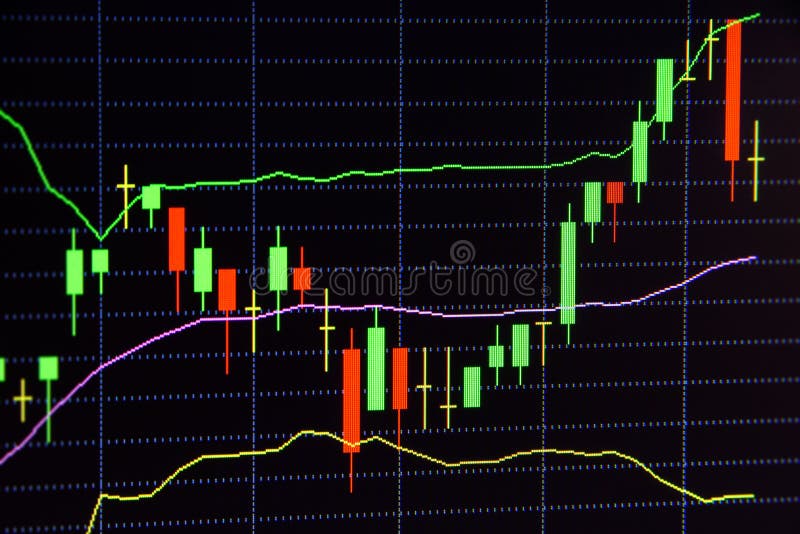
Free with trial Charts of financial instruments with various type of tools and indicators for technical analysis including Japanese candlestick in Bollinger band analysis on the monitor of a computer. Candlestick graph data illustrations Charts of financial instruments with various type of tools and indicators
Free with trial Flat style web banner on stock trading concept, stock market analysis, business and investment, forex exchange. Candlestick graph data vectors Stock market analysis
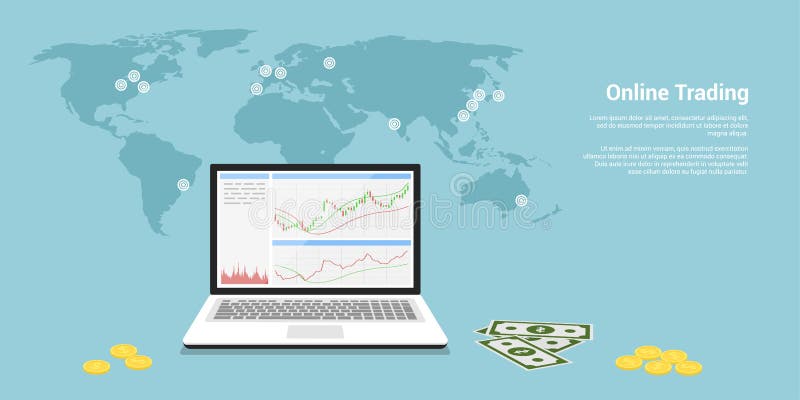
Free with trial Flat style web banner on stock trading concept, online trading, stock market analysis, business and investment, forex exchange. Candlestick graph data vectors Online trading banner. Flat style web banner on stock trading concept, online trading, stock market analysis, business and investment, forex exchange
Free with trial Forex stock trade pattern. Forex stock graphic models. Price prediction. Trading signal. Vector illustration. Candlestick graph data vectors Forex stock trade pattern. Price prediction model. Forex stock trade pattern. Forex stock graphic models. Price prediction. Trading signal. Vector illustration.
Free with trial Isometric Forex Trading Concept. Traders Are Analysing the Chart. Vector illustration. Candlestick graph data vectors Isometric Forex Trading Concept. Traders Are Analysing the Chart. Vector illustration
Free with trial Creative digital globe with forex chart on blurry city background with skyscraper. Global trade and growth concept. Double exposure. Candlestick graph data illustrations Global trade and growth concept
Free with trial Trading Chart Analyzing Stock Market. Flat Vector Icon illustration. Simple black symbol on white background. Trading Chart Analyzing Stock Market sign design template for web and mobile UI element. Candlestick graph data vectors Trading Chart Analyzing Stock Market Flat Vector Icon. Trading Chart Analyzing Stock Market. Flat Vector Icon illustration. Simple black symbol on white background. Trading Chart Analyzing Stock Market sign design template for web and mobile UI element
Free with trial Diagrams line icons. Business data chart pie increase analytic candlestick chart trend information graph. Diagram vector set. Candlestick graph data vectors Diagrams line icons. Business data chart pie increase analytic candlestick chart trend information graph. Diagram vector
Free with trial Candlestick graph chart with digital data, uptrend or down trend of price of stock market or stock exchange trading, investment and financial concept. Candlestick graph data illustrations Candlestick graph chart with digital data, uptrend or down trend of price of stock market or stock exchange trading, investment
Free with trial Candlestick graph chart with digital data, uptrend or down trend of price of stock market or stock exchange trading, investment and financial concept. Candlestick graph data illustrations Candlestick graph chart with digital data, uptrend or down trend of price of stock market or stock exchange trading, investment
Free with trial Candlestick graph chart with digital data, uptrend or down trend of price of stock market or stock exchange trading, investment and financial concept. Candlestick graph data illustrations Candlestick graph chart with digital data, uptrend or down trend of price of stock market or stock exchange trading, investment
Free with trial Candlestick chart. Financial market growth graph. Forex trading and stocks investment business vector concept. Illustration of data stock and graph market. Candlestick graph data vectors Candlestick chart. Financial market growth graph. Forex trading and stocks investment business vector concept
Free with trial Forex candlestick chart. Financial data graph on LED display. Concept of forecasting and stock market analysis. 3d rendering. Blurry drops. Candlestick graph data illustrations Forex candlestick chart. Financial data graph on LED display. Concept of forecasting and stock market analysis. 3d rendering.
Free with trial Forex candlestick blurry chart. Financial data graph on LED display. Concept of forecasting and stock market analysis. 3d rendering. Candlestick graph data illustrations Forex candlestick blurry chart. Financial data graph on LED display. Concept of forecasting and stock market analysis. 3d
Free with trial Message, Candlestick graph and Chemistry flask line icons set. Diploma certificate, save planet, group of people. Medical help, Recovery data and World money signs. Vector. Candlestick graph data vectors Message, Candlestick graph and Chemistry flask icons set. Medical help, Recovery data and World money signs. Vector. Message, Candlestick graph and Chemistry flask line icons set. Diploma certificate, save planet, group of people. Medical help, Recovery data and World money signs. Vector
Free with trial Business candlestick graph chart of stock market investment trading. Financial chart with up trend line graph. Candlestick graph data illustrations Business candlestick graph chart of stock market investment trading
Free with trial Stock candlestick chart icon illustration vector set. Contains such icon as Bullish, Bearish, Doji, Graph, and more. Expanded Stroke. Candlestick graph data vectors Stock candlestick chart icon vector set. Contains such icon as Bullish, Bearish, Doji, Graph trend, and more. Expanded. Stock candlestick chart icon illustration vector set. Contains such icon as Bullish, Bearish, Doji, Graph, and more. Expanded Stroke
Free with trial Candlestick downtrend stock price graph vector, financial analysing tool dark background. Candlestick graph data vectors Candlestick downtrend stock price graph vector, financial analysing tool
Free with trial Candlestick and financial graph charts, Infographic presentations template, Global network connection and Business analytics, Forex stock market investment trading, Bullish point, Bearish point. Candlestick graph data vectors Candlestick and financial graph charts, Infographic presentations template. Candlestick and financial graph charts, Infographic presentations template, Global network connection and Business analytics, Forex stock market investment trading, Bullish point, Bearish point.
Free with trial Candlestick and financial graph charts, Infographic presentations template, Global network connection and Business analytics, Forex stock market investment trading, Bullish point, Bearish point. Candlestick graph data vectors Candlestick and financial graph charts, Infographic presentations template. Candlestick and financial graph charts, Infographic presentations template, Global network connection and Business analytics, Forex stock market investment trading, Bullish point, Bearish point.
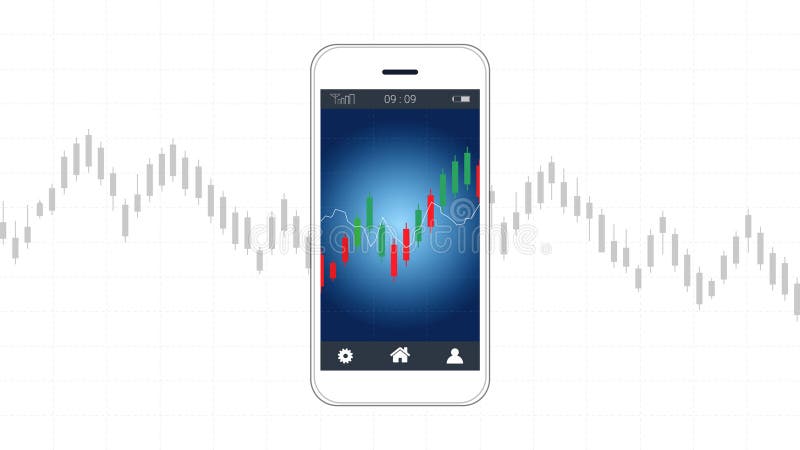
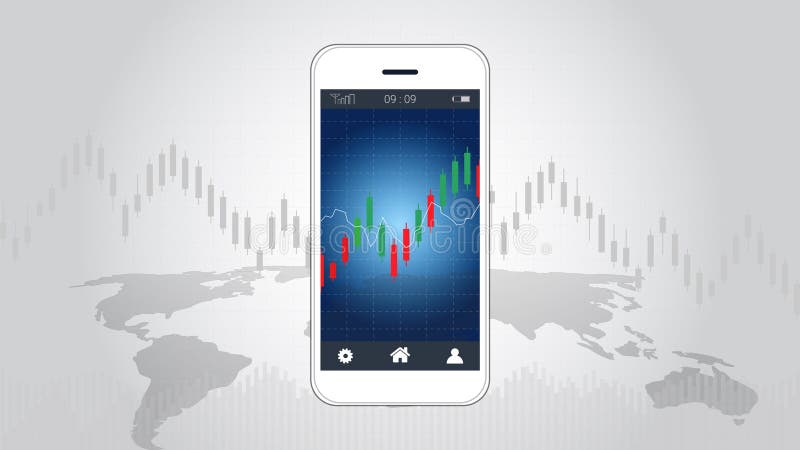
Free with trial Smart phone screen showing candlestick and financial graph charts, Infographic presentations template, Global network connection and Business analytics, Forex stock market investment trading. Candlestick graph data vectors Smart phone screen showing candlestick and financial graph charts. Smart phone screen showing candlestick and financial graph charts, Infographic presentations template, Global network connection and Business analytics, Forex stock market investment trading.
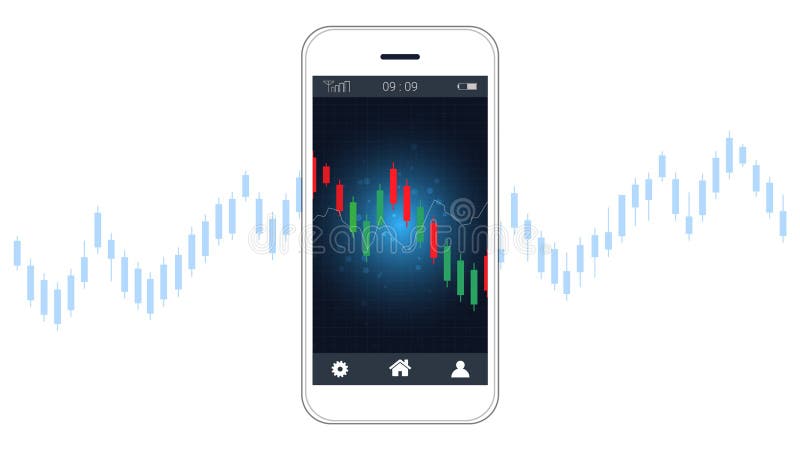
Free with trial Smart phone screen showing candlestick and financial graph chart, Infographic presentations template, Global network connection and Business analytics Blurred background gradient mesh for an example. Candlestick graph data vectors Smart phone screen showing candlestick and financial graph chart. Smart phone screen showing candlestick and financial graph chart, Infographic presentations template, Global network connection and Business analytics Blurred background gradient mesh for an example
Free with trial Smart phone screen showing candlestick and financial graph charts, Global network connection and Business analytics, Suitable for forex stock market investment trading concept. Candlestick graph data vectors Smart phone screen showing candlestick and financial graph charts. Smart phone screen showing candlestick and financial graph charts, Global network connection and Business analytics, Suitable for forex stock market investment trading concept.
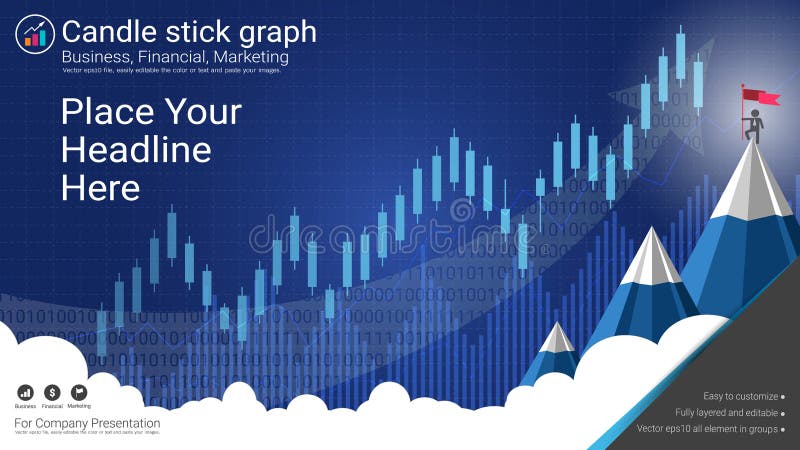
Free with trial Smart phone screen showing financial and candlestick graph charts climbing up presentations template, Global network connection and Business analytics, Forex stock market investment trading concept. Candlestick graph data vectors Smart phone screen showing financial and candlestick graph charts climbing up presentations template. Smart phone screen showing financial and candlestick graph charts climbing up presentations template, Global network connection and Business analytics, Forex stock market investment trading concept.
Free with trial Cryptocurrency bitcoin on the road to success and Candlestick financial graph charts climbing up, Global network connection and Business analytics, Forex stock market investment concept. Candlestick graph data vectors Cryptocurrency bitcoin on the road to success and Candlestick financial graph charts climbing up. Cryptocurrency bitcoin on the road to success and Candlestick financial graph charts climbing up, Global network connection and Business analytics, Forex stock market investment concept.
Free with trial Growth stock diagram financial graph. candlestick with arrow up Trading stock or forex 3d icon vector illustration style. Candlestick graph data vectors Growth stock diagram financial graph. candlestick with arrow up Trading stock or forex 3d icon vector illustration style