Free with trial Feedback rating scale of red, orange, yellow and green emoticons, 3d Smiley icons in different colours. Category survey illustrations Feedback rating scale of red, orange, yellow and green emoticons, 3d Smiley icons in different colours.
Free with trial Concept of selection, represented by a set of 3D buttons related to letters, each of one is linked to an alternative of choice. Category survey illustrations Selection
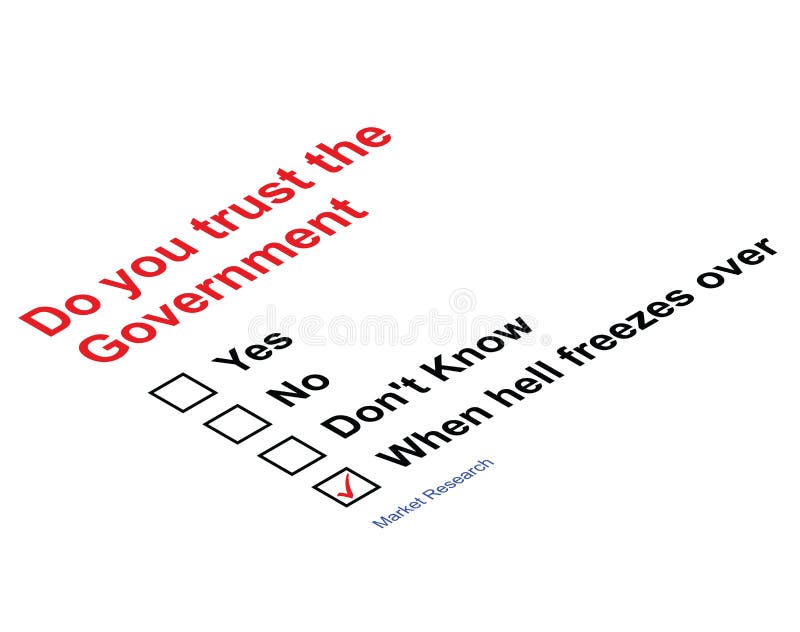
Free with trial Trust Government Market research questionnaire isolated on white background. Category survey vectors Trust Government
Free with trial Writing note showing Quick Survey. Business photo showcasing Conduct fast check on condition value situation of something Man holding Megaphone loudspeaker screaming talk speech bubble. Category survey illustrations Writing note showing Quick Survey. Business photo showcasing Conduct fast check on condition value situation of something Man hold
Free with trial Inspiration showing sign Quick Survey, Concept meaning Conduct fast check on condition value situation of something Abstract Helping Build Community, Society Working Together Concept. Category survey illustrations Inspiration showing sign Quick Survey. Business overview Conduct fast check on condition value situation of something. Inspiration showing sign Quick Survey, Concept meaning Conduct fast check on condition value situation of something Abstract Helping Build Community, Society Working Together Concept
Free with trial Text sign showing Who s is Your Audience question. Conceptual photo asking someone about listeners category Coaching Creative artwork type idea text script message colourful bubble oval design. Category survey illustrations Text sign showing Who s is Your Audience question. Conceptual photo asking someone about listeners category Coaching
Free with trial Word writing text Who s is Your Audience question. Business concept for asking someone about listeners category Coaching Mobile text message messenger smart touch typing social media network. Category survey illustrations Word writing text Who s is Your Audience question. Business concept for asking someone about listeners category Coaching Mobile te
Free with trial Handwriting text writing Who s is Your Audience question. Concept meaning asking someone about listeners category Coaching Multiline text notice board recall reassure public message yellow surface. Category survey illustrations Handwriting text writing Who s is Your Audience question. Concept meaning asking someone about listeners category Coaching Multili
Free with trial Check boxes with three gender options, red tick and pencil. Non binary gender identity concept. Category survey vectors Gender options check boxes. Check boxes with three gender options, red tick and pencil. Non binary gender identity concept
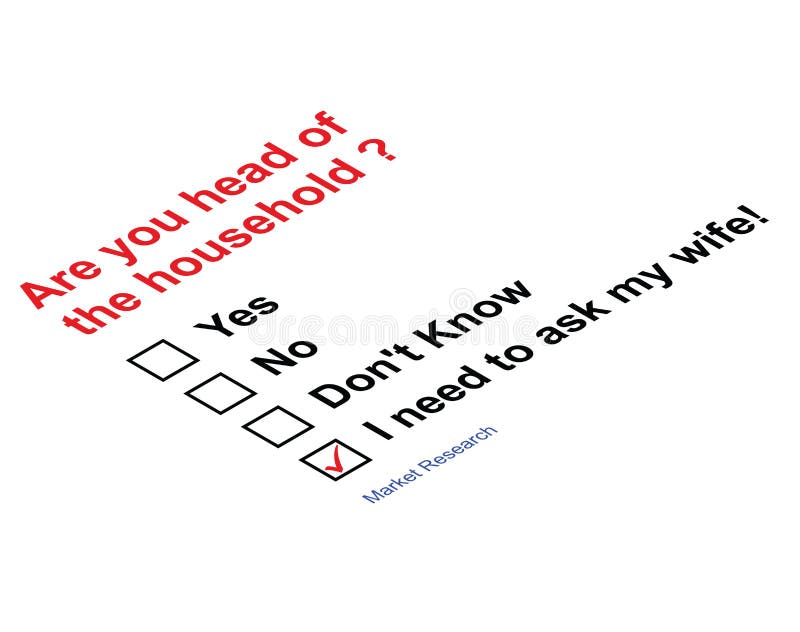
Free with trial Market research questionnaire asking head of household. Category survey illustrations Head of household
Free with trial Check boxes with three personal gender pronouns options. Red tick against the singular they them. Non binary and gender neutral pronouns concept. Category survey vectors Gender pronouns check boxes. Check boxes with three personal gender pronouns options. Red tick against the singular they them. Non binary and gender neutral pronouns concept
Free with trial Illustration of section through a house showing a color scale going from red through yellow to lightest shade of green indicating its energy saving efficiency. Category survey illustrations Energy saving
Free with trial Vector illustration of Do and Don`t button choice. Suitable for elements of advice info graphic information or tips. Check mark and cross mark icon. Category survey vectors Vector illustration of Do and Don`t button choice. Suitable for elements of advice info graphic information or tips.
Free with trial Feedback letter with star colored icon. Client satisfaction, happy customer, positive review symbol and sign vector illustration design. Isolated on white background. Category survey vectors Feedback letter with star colored icon. Client satisfaction, happy customer, positive review symbol
Free with trial Survey presenting data illustration sample sections, groups percentage, respondents category survey presenting data. Category survey illustrations Survey presenting data
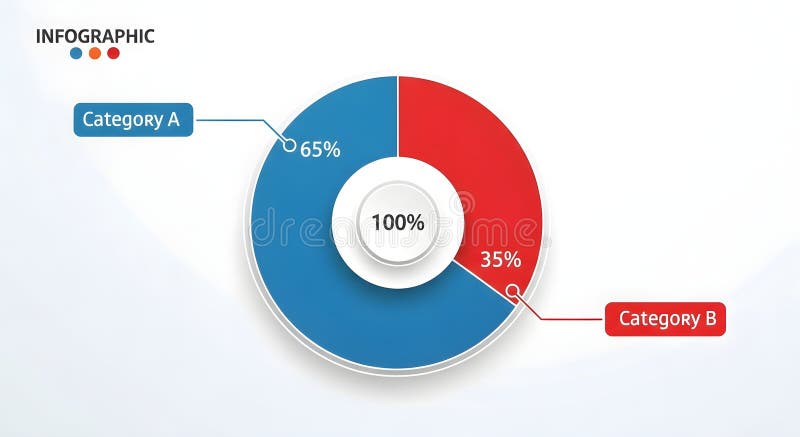
Free with trial A clean and modern infographic featuring a pie chart divided into two segments representing 'Category A' (65%) and 'Category B' (35%). The chart has a central circle displaying '100%'. The infographic uses a simple color scheme of blue and red, with clear labels and connecting lines. This visual is ideal for presenting data, statistics, market share, or survey results in a clear and easily understandable format. Category survey illustrations Pie Chart Infographic: Category A vs. Category B. A clean and modern infographic featuring a pie chart divided into two segments representing 'Category A' (65%) and 'Category B' (35%). The chart has a central circle displaying '100%'. The infographic uses a simple color scheme of blue and red, with clear labels and connecting lines. This visual is ideal for presenting data, statistics, market share, or survey results in a clear and easily understandable format.
Free with trial Laptop illustration displaying an online checklist tool. A stylized browser window with checkboxes is in front of the screen. Each item has a checkmark, with a cursor pointing to the last box. The color scheme includes black, white, and orange accents, set against a circular orange background. The design emphasizes technology and productivity. Category survey vectors Laptop with Task Checklist - Online Productivity Tool, Online Survey Illustration concept Category Technology. Laptop illustration displaying an online checklist tool. A stylized browser window with checkboxes is in front of the screen. Each item has a checkmark, with a cursor pointing to the last box. The color scheme includes black, white, and orange accents, set against a circular orange background. The design emphasizes technology and productivity.
Free with trial Intricate architectural illustration featuring a structure with a large central dome flanked by smaller domes, reflecting Indo-Saracenic style. The building showcases ornate arches, decorative patterns, and minarets, combining elements of Mughal and Gothic design. The illustration is rendered in shades of green and teal, emphasizing the intricate detailing and symmetry. The style reflects historical architectural influences found in Indian subcontinent architecture adapted during the colonial period, focusing on grandeur and embellishment. Most major buildings are now classified under the Heritage buildings category as laid down by the Archaeological Survey of India (ASI), and protected. Category survey illustrations Indo Saracenic style architecture or Indo Gothic, Mughal Gothic, Neo Mughal original illustration art. Intricate architectural illustration featuring a structure with a large central dome flanked by smaller domes, reflecting Indo-Saracenic style. The building showcases ornate arches, decorative patterns, and minarets, combining elements of Mughal and Gothic design. The illustration is rendered in shades of green and teal, emphasizing the intricate detailing and symmetry. The style reflects historical architectural influences found in Indian subcontinent architecture adapted during the colonial period, focusing on grandeur and embellishment. Most major buildings are now classified under the Heritage buildings category as laid down by the Archaeological Survey of India (ASI), and protected.
Free with trial Intricate architectural illustration featuring a structure with a large central dome flanked by smaller domes, reflecting Indo-Saracenic style. The building showcases ornate arches, decorative patterns, and minarets, combining elements of Mughal and Gothic design. The illustration is rendered in shades of green and teal, emphasizing the intricate detailing and symmetry. The style reflects historical architectural influences found in Indian subcontinent architecture adapted during the colonial period, focusing on grandeur and embellishment. Most major buildings are now classified under the Heritage buildings category as laid down by the Archaeological Survey of India (ASI), and protected. Category survey illustrations Indo Saracenic style architecture or Indo Gothic, Mughal Gothic, Neo Mughal original illustration art. Intricate architectural illustration featuring a structure with a large central dome flanked by smaller domes, reflecting Indo-Saracenic style. The building showcases ornate arches, decorative patterns, and minarets, combining elements of Mughal and Gothic design. The illustration is rendered in shades of green and teal, emphasizing the intricate detailing and symmetry. The style reflects historical architectural influences found in Indian subcontinent architecture adapted during the colonial period, focusing on grandeur and embellishment. Most major buildings are now classified under the Heritage buildings category as laid down by the Archaeological Survey of India (ASI), and protected.
Free with trial Intricate architectural illustration featuring a structure with a large central dome flanked by smaller domes, reflecting Indo-Saracenic style. The building showcases ornate arches, decorative patterns, and minarets, combining elements of Mughal and Gothic design. The illustration is rendered in shades of green and teal, emphasizing the intricate detailing and symmetry. The style reflects historical architectural influences found in Indian subcontinent architecture adapted during the colonial period, focusing on grandeur and embellishment. Most major buildings are now classified under the Heritage buildings category as laid down by the Archaeological Survey of India (ASI), and protected. Category survey illustrations Indo Saracenic style architecture or Indo Gothic, Mughal Gothic, Neo Mughal original illustration art. Intricate architectural illustration featuring a structure with a large central dome flanked by smaller domes, reflecting Indo-Saracenic style. The building showcases ornate arches, decorative patterns, and minarets, combining elements of Mughal and Gothic design. The illustration is rendered in shades of green and teal, emphasizing the intricate detailing and symmetry. The style reflects historical architectural influences found in Indian subcontinent architecture adapted during the colonial period, focusing on grandeur and embellishment. Most major buildings are now classified under the Heritage buildings category as laid down by the Archaeological Survey of India (ASI), and protected.
Free with trial Choice showing hand selecting a red checkmark in a survey box next to four yellow stars on a blue background. Category survey illustrations Hand selecting a red checkmark in a survey box next to four yellow stars on a blue background. Choice showing hand selecting a red checkmark in a survey box next. Choice showing hand selecting a red checkmark in a survey box next to four yellow stars on a blue background
Free with trial Sign displaying Quick Survey, Concept meaning Conduct fast check on condition value situation of something. Category survey illustrations Writing displaying text Quick Survey. Business concept Conduct fast check on condition value situation of something. Sign displaying Quick Survey, Concept meaning Conduct fast check on condition value situation of something
Free with trial A vibrant vector illustration featuring four stylized human icons, each standing on a distinctively colored and numbered platform. The figures, in green, light blue, purple, and pink, all have one arm raised, symbolizing participation, voting, selection, or asking a question. The platforms are numbered 1, 2, 2, and 3, suggesting ranking, multiple options, or survey results. This clean, flat design is ideal for infographics, presentations, educational materials, or any project depicting choices, competition, or group decisions. Category survey vectors Ranking and Choices: Colorful People Icons on Numbered Platforms. A vibrant vector illustration featuring four stylized human icons, each standing on a distinctively colored and numbered platform. The figures, in green, light blue, purple, and pink, all have one arm raised, symbolizing participation, voting, selection, or asking a question. The platforms are numbered 1, 2, 2, and 3, suggesting ranking, multiple options, or survey results. This clean, flat design is ideal for infographics, presentations, educational materials, or any project depicting choices, competition, or group decisions.
Free with trial A detailed vector pie chart displaying data distribution across multiple categories with clear percentage labels. Ideal for market analysis, demographic studies, or survey results, offering a precise and visually engaging representation of proportions, vector design Generative AI. Category survey vectors Multi-Category Pie Chart with Percentage Labels, vector design Generative AI. A detailed vector pie chart displaying data distribution across multiple categories with clear percentage labels. Ideal for market analysis, demographic studies, or survey results, offering a precise and visually engaging representation of proportions, vector design Generative AI
Free with trial The image shows a bar chart with four categories of data, each represented by a different colored bar. A magnifying glass is examining the fourth category, which has the highest value. Category survey illustrations A magnifying glass examining a bar chart with four categories of data. The image shows a bar chart with four categories of data, each represented by a different colored bar. A magnifying glass is examining the fourth category, which has the highest value
Free with trial Audience segmentation, demographic research of target marketing. Tiny people work with survey results in pie chart to identify customers segment and potential client group cartoon vector illustration. Category survey vectors Audience segmentation, tiny people work with pie chart to identify customers segment. Audience segmentation, demographic research of target marketing. Tiny people work with survey results in pie chart to identify customers segment and potential client group cartoon vector illustration
Free with trial Stylish data visualization with colorful graphs and digital elements representing financial growth and analysis, Generative AI. Category survey illustrations Insightful big data analytics report graphs charts illustrating business category distribution on abstract background. Stylish data visualization with colorful graphs and digital elements representing financial growth and analysis, Generative AI.
Free with trial An informative infographic vector illustration featuring a stacked horizontal bar chart, ideal for comparing different categories and their components. This graphic is perfect for demonstrating budget allocations, survey results, or resource distribution. Provided in high resolution and suitable for both web and print use, vector design Generative AI. Category survey vectors Stacked Horizontal Bar Chart Infographic, vector design Generative AI. An informative infographic vector illustration featuring a stacked horizontal bar chart, ideal for comparing different categories and their components. This graphic is perfect for demonstrating budget allocations, survey results, or resource distribution. Provided in high resolution and suitable for both web and print use, vector design Generative AI
Free with trial Target audience and focus group analysis set. Tiny people research customer survey results and clients profiles with magnifying glass, analyze segments of pie chart cartoon vector illustration. Category survey vectors Target audience and focus group analysis set, tiny people research clients profile in aim. Target audience and focus group analysis set. Tiny people research customer survey results and clients profiles with magnifying glass, analyze segments of pie chart cartoon vector illustration
Free with trial A colorful stacked bar chart illustrating data contribution and overall percentages. Perfect for breaking down totals by categories, sales performance, or survey responses. High-resolution vector for clear and insightful data visualization, vector design Generative AI. Category survey vectors Stacked Bar Chart with Percentages - Data Contribution, vector design Generative AI. A colorful stacked bar chart illustrating data contribution and overall percentages. Perfect for breaking down totals by categories, sales performance, or survey responses. High-resolution vector for clear and insightful data visualization, vector design Generative AI
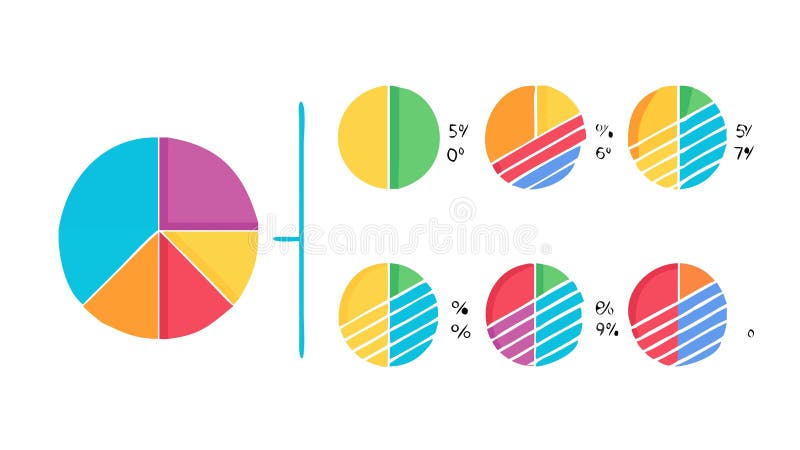
Free with trial An infographic featuring multiple pie charts for comparative data analysis and distribution. Ideal for presenting market segments, demographic breakdowns, or survey results across different categories. High-resolution vector for versatile data visualization, vector design Generative AI. Category survey vectors Multi-Pie Chart Infographic - Comparative Data Analysis, vector design Generative AI. An infographic featuring multiple pie charts for comparative data analysis and distribution. Ideal for presenting market segments, demographic breakdowns, or survey results across different categories. High-resolution vector for versatile data visualization, vector design Generative AI
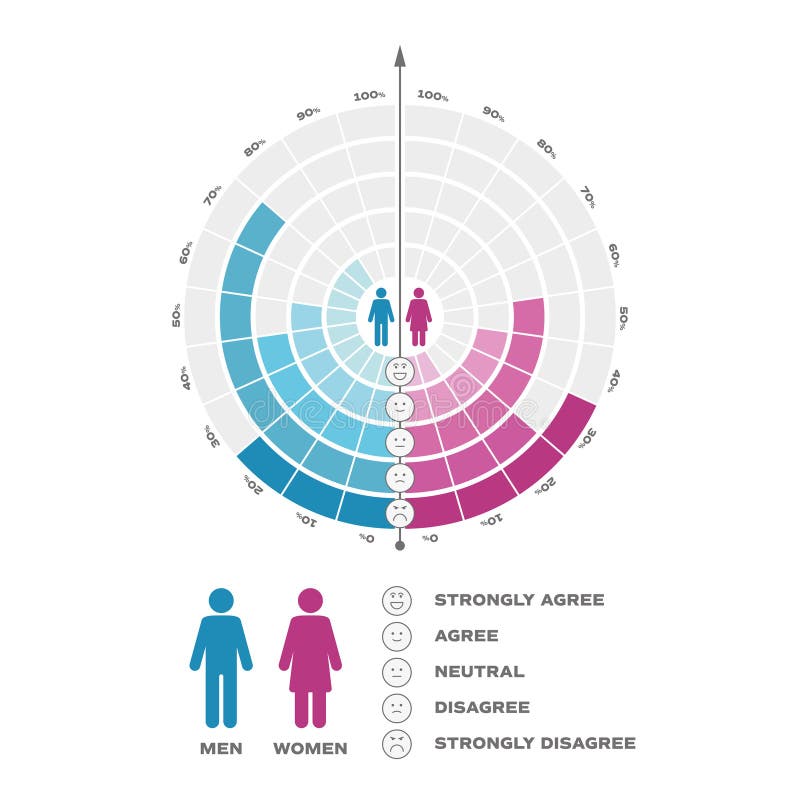
Free with trial Visual template comparing opinion metrics between men and women on shared topic. Category survey vectors Concentric radial chart comparing gender responses to single-question survey using modular segments. Visual template comparing opinion metrics between men and women on shared topic
Free with trial Vibrant digital cityscape with colorful bars representing data visualization and technology evolution in a futuristic setting, Generative AI. Category survey illustrations Insightful big data analytics report graphs charts illustrating business category distribution on abstract background. Vibrant digital cityscape with colorful bars representing data visualization and technology evolution in a futuristic setting, Generative AI.
Free with trial A vibrant digital visualization of data trends, showcasing colorful graphs and lines against a dark background for a tech atmosphere, Generative AI. Category survey illustrations Insightful big data analytics report graphs charts illustrating business category distribution on abstract background. A vibrant digital visualization of data trends, showcasing colorful graphs and lines against a dark background for a tech atmosphere, Generative AI
Free with trial Abstract digital visualization of financial analytics, featuring colorful graphs and data trends for technology and business concepts, Generative AI. Category survey illustrations Insightful big data analytics report graphs charts illustrating business category distribution on abstract background. Abstract digital visualization of financial analytics, featuring colorful graphs and data trends for technology and business concepts, Generative AI
Free with trial Three data comparison charts with highlighted values, probability graph of people distribution, and a checklist. Ideal for data analysis, planning, evaluation, research, decision-making, probability. Category survey vectors Comparison of Three Data Categories with Graph and Checklist for Decision-Making. Three data comparison charts with highlighted values, probability graph of people distribution, and a checklist. Ideal for data analysis, planning, evaluation, research, decision-making, probability
Free with trial Top-down 3D render of a pastel pie chart with four colored slices�'yellow, beige, pink and mint�'on a soft mint background. No people. Category survey illustrations Pastel pie chart on mint green background. Top-down 3D render of a pastel pie chart with four colored slices�'yellow, beige, pink and mint�'on a soft mint background. No people
Free with trial User profiles with star ratings, product categories, and a globe symbolizing online connectivity. Ideal for e-commerce, product feedback, global reach, digital marketing, consumer resources, online. Category survey vectors Online Product Reviews and Global E-Commerce Concept with Ratings, Products, and Web Connectivity. User profiles with star ratings, product categories, and a globe symbolizing online connectivity. Ideal for e-commerce, product feedback, global reach, digital marketing, consumer resources, online
Free with trial Option showing green grass check mark symbol on white background with shadow. Category survey illustrations Green Grass Check Mark Symbol on White Background with Shadow
Free with trial Line graph with connected data points and a demographic graph showing percentages by categories. Ideal for statistics, trends, data science, insights, analytics, demographics, business tools. Simple. Category survey illustrations Data analysis with line chart and demographic distribution for trends and insights visualization. Line graph with connected data points and a demographic graph showing percentages by categories. Ideal for statistics, trends, data science, insights, analytics, demographics, business tools. Simple
Free with trial Digital data organizer icon. Generative AI. Category survey illustrations Blue and yellow file folder illustration. Digital data organizer icon. Generative AI
Free with trial A vibrant and modern pie chart graphic, showcasing data segmentation and analysis with clear visual representation of proportions and trends for business. Creative ai. Category survey illustrations Colorful pie chart with data visualization. A vibrant and modern pie chart graphic, showcasing data segmentation and analysis with clear visual representation of proportions and trends for business.Creative ai.
Free with trial A clean, minimalist image featuring five stars arranged on a white shelf against a plain white background. Four of the stars are a bright, cheerful yellow, while the fifth star is white, subtly suggesting a lower rating or a different category. This visual metaphor is ideal for representing customer feedback, product reviews, service quality, or any scenario where a star rating system is employed. Category survey vectors Four Yellow Stars and One White Star Rating. A clean, minimalist image featuring five stars arranged on a white shelf against a plain white background. Four of the stars are a bright, cheerful yellow, while the fifth star is white, subtly suggesting a lower rating or a different category. This visual metaphor is ideal for representing customer feedback, product reviews, service quality, or any scenario where a star rating system is employed.
Free with trial A simple illustration of a bar chart with different colored bars (red, blue, and green) arranged on a horizontal black line. The bars vary in height, representing different values or categories. The chart is clean and minimalist, suitable for presentations, reports, or infographics. It can be used to visualize data, compare values, and highlight trends. Category survey vectors Colorful Bar Chart Illustration. A simple illustration of a bar chart with different colored bars (red, blue, and green) arranged on a horizontal black line. The bars vary in height, representing different values or categories. The chart is clean and minimalist, suitable for presentations, reports, or infographics. It can be used to visualize data, compare values, and highlight trends.
Free with trial Colorful bar chart displays data visualization insights vibrant chart shows quantitative analysis using bars ,. Category survey illustrations Colorful bar chart displays data visualization insights vibrant chart shows quantitative analysis using bars
Free with trial Isolated showing simple black checkmark symbol on a white background keywords: check, checkmark, tick, mark, symbol, icon, correct, right, yes. Category survey illustrations Simple black checkmark symbol on a white background Keywords: check, checkmark, tick, mark, symbol, icon, correct
Free with trial Ranking word block on white background. Category survey illustrations Ranking word block on white
Free with trial Isolated showing clipboard with three green checkmarks on a white background keywords: clipboard, checklist, checkmark, check, tick, green, list. Category survey illustrations Clipboard with three green checkmarks on a white background Keywords: clipboard, checklist, checkmark, check, tick
Free with trial South showing blue compass with red and white needle on gray background keywords: compass, navigation, direction, travel, journey, exploration. Category survey illustrations Blue Compass with Red and White Needle on Gray Background Keywords: compass, navigation, direction, travel, journey
Free with trial Kit showing metal ruler with inch and centimeter markings isolated on white background keywords: ruler, metal ruler. Category survey illustrations Metal Ruler with Inch and Centimeter Markings Isolated on White Background Keywords: ruler, metal
Free with trial Consumer or customer product rating bubble person icons set with customer review vector illustration eps. Category survey vectors Consumer or customer product rating bubble person icons set with customer review vector illustration
Free with trial Approved showing circular icon with checklist and pencil on black background. Category survey illustrations Circular Icon with Checklist and Pencil on Black Background
Free with trial Right showing black icon of a clipboard with horizontal lines and a check mark in a circle. Category survey illustrations Black Icon of a Clipboard with Horizontal Lines and a Check Mark in a Circle
Free with trial A 3D rendering of a pie chart with different colored segments. The chart is composed of red, green, yellow, purple, and blue sections, representing different proportions. The pie chart sits on a metallic base with concentric rings, set against a neutral gray background. It is suitable for illustrating data, statistics, market share, business analysis, and financial reports. Category survey illustrations Colorful 3D Pie Chart on Gray Background. A 3D rendering of a pie chart with different colored segments. The chart is composed of red, green, yellow, purple, and blue sections, representing different proportions. The pie chart sits on a metallic base with concentric rings, set against a neutral gray background. It is suitable for illustrating data, statistics, market share, business analysis, and financial reports.
Free with trial Atmosphere. showing modern shopping mall interior with escalators and shops on multiple levels. Category survey illustrations Modern Shopping Mall Interior with Escalators and Shops on Multiple Levels
Free with trial Image showing simple document icon with bulleted list and folded corner on white background. Category survey illustrations Simple Document Icon with Bulleted List and Folded Corner on White Background
Free with trial 3D render of a pastel pie chart with separated raised slices on a dark teal background, glossy reflections on the surface. No people. Category survey illustrations Pastel 3D pie chart with raised slices on dark teal. 3D render of a pastel pie chart with separated raised slices on a dark teal background, glossy reflections on the surface. No people
Free with trial A horizontal bar graph isolated on white background, showing data comparison with varying bar lengths. A clear, minimalist design for data visualization. Vector image. Category survey vectors Vector art of horizontal bar graph, illustrating data comparison with varying bar lengths and a clear, minimalist design. A horizontal bar graph isolated on white background, showing data comparison with varying bar lengths. A clear, minimalist design for data visualization. Vector image
Free with trial This image shows a notepad with a red table icon, perfect for illustrating data analysis, statistics, or report generation in a business or academic setting. Category survey vectors Vector art of a notepad with a red table icon, symbolizing data analysis, statistics, or report generation in a business context. This image shows a notepad with a red table icon, perfect for illustrating data analysis, statistics, or report generation in a business or academic setting
Free with trial Gradient showing horizontal slider bar with gradient blue speech bubbles indicating progress or selection keywords: slider, progress bar, selection. Category survey illustrations Horizontal slider bar with gradient blue speech bubbles indicating progress or selection Keywords: slider, progress
Free with trial Virus showing customer satisfaction 40 line icons set with business and people symbols keywords: customer satisfaction, icons, line icons, business, people, service, feedback, rating, review. Category survey illustrations Customer Satisfaction 40 Line Icons Set with Business and People Symbols Keywords: customer satisfaction, icons, line icons
Free with trial Vector research featuring abstract circular graph with wavy line inside keywords: graph, chart, data, analytics, statistics, information, research, analysis, science, technology, business. Category survey vectors Abstract circular graph with wavy line inside Keywords: graph, chart, data, analytics, statistics
Free with trial Miscellaneous showing collection of business and feedback icons with star ratings and charts keywords: feedback, icon, rating, star, comment, chart. Category survey illustrations Collection of business and feedback icons with star ratings and charts Keywords: feedback, icon, rating, star
Free with trial Vector yis12omuj featuring house icon with 360 degree rotation arrows transparent background keywords: house, home, real estate, property, virtual tour, 360 degree, rotation, panoramic, view. Category survey vectors House Icon with 360 Degree Rotation Arrows Transparent Background Keywords: house, home, real estate
Free with trial The image displays two types of charts comparing the preferences of fresh food consumption. The pie chart on the left shows the distribution percentages of different food preferences, with segments labeled 26%, 20%, 19%, and 35%. The bar chart on the right visually represents the same data with an additional category, showing 11%, 12%, 22%, and 55%. The title 'Fresorde Pie Tiektuant' suggests a. Category survey illustrations Comparison of fresh food consumption preferences among viewers in a pie and bar chart format. The image displays two types of charts comparing the preferences of fresh food consumption. The pie chart on the left shows the distribution percentages of different food preferences, with segments labeled 26%, 20%, 19%, and 35%. The bar chart on the right visually represents the same data with an additional category, showing 11%, 12%, 22%, and 55%. The title 'Fresorde Pie Tiektuant' suggests a
Free with trial A colorful bar chart graphically represents data with varying heights, indicating different values for comparison and analysis ,Generative AI. Category survey illustrations Colorful bar chart illustrating data trends and comparisons a. A colorful bar chart graphically represents data with varying heights, indicating different values for comparison and analysis ,Generative AI
Free with trial A close-up of a form being filled out with a pen, highlighting a selection process, aesthetic wallpaper background. Category survey illustrations A close-up of a form being filled out with a pen, highlighting a selection process
Free with trial Feedback rating scale of red, orange, yellow and green emoticons, 3d Smiley icons in different colours. Category survey illustrations Feedback rating scale of red, orange, yellow and green emoticons, 3d Smiley icons in different colours