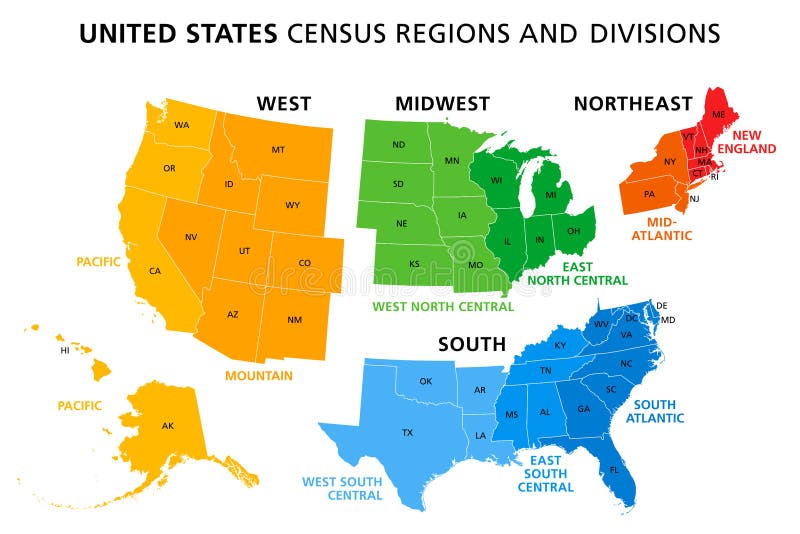
Free with trial Map of United States split into Census regions and divisions. Region definition, widely used for data collection and analysis. Most commonly used classification system. English. Illustration. Vector. Census vectors Map of United States split into Census regions and divisions
Free with trial Joseph guides Mary on a donkey as they journey toward Bethlehem for the Roman census. This historical scene highlights their faith and determination in a challenging time. Census illustrations Mary and Joseph travel on a donkey to Bethlehem during the Roman census in a woodcut print. Joseph guides Mary on a donkey as they journey toward Bethlehem for the Roman census. This historical scene highlights their faith and determination in a challenging time
Free with trial Census 2020 USA Banner Red white and blue American Flag. Census illustrations Census 2020 United States of America. Census 2020 USA Banner Red white and blue American Flag
Free with trial 2020 Census Banner Starburst with red white and blue background. Census illustrations 2020 Census Banner Starburst
Free with trial Colorful 2020 U. S. Census Banner with People and American Flag. Census vectors 2020 Census Banner with People and Flag. Colorful 2020 U.S. Census Banner with People and American Flag
Free with trial A vibrant red distressed rubber stamp displaying "CENSUS DATA" for statistical analysis and demographic information. Census vectors Red grunge rubber stamp mark identifying important census data for statistical analysis and research. A vibrant red distressed rubber stamp displaying "CENSUS DATA" for statistical analysis and demographic information
Free with trial United States Population Census 2020 banner. Vector illustration with American striped flag and stars. Can be used for landing page web template, badge or advertisement poster and flier graphic design. Census vectors United States Population Census 2020 banner. Vector illustration with American striped flag and stars. Can be used for landing
Free with trial United States Population Census 2020 banner. Vector illustration with American striped flag and stars. Can be used for landing page web template, badge or advertisement poster and flier graphic design. Census vectors United States Population Census 2020 banner. Vector illustration with American striped flag and stars. Can be used for landing
Free with trial USA People Map. Map of the United States Made Up of a Crowd of People Icons. Background for Presentation - Advertising - Marketing - Poster - Infographic. Census vectors USA People Map. Map of the United States Made Up of a Crowd of People Icons
Free with trial A comprehensive flat design vector illustration set featuring various tools and equipment essential for modern data collection, census operations, and logistics. It includes mobile phones, tablets displaying charts and text, barcode scanners, a laptop, a GPS pin, a clipboard, and different types of cardboard boxes and durable cases. Some boxes are explicitly labeled "CENSUS DATA," highlighting their relevance to surveys and demographic studies. This versatile collection is ideal for projects related to technology, information management, shipping, inventory, and field work. Census illustrations Data Collection, Census, and Logistics Equipment Vector Set. A comprehensive flat design vector illustration set featuring various tools and equipment essential for modern data collection, census operations, and logistics. It includes mobile phones, tablets displaying charts and text, barcode scanners, a laptop, a GPS pin, a clipboard, and different types of cardboard boxes and durable cases. Some boxes are explicitly labeled "CENSUS DATA," highlighting their relevance to surveys and demographic studies. This versatile collection is ideal for projects related to technology, information management, shipping, inventory, and field work.
Free with trial United States, Census regions and divisions, political map. Region definition widely used for data collection and analysis. The most commonly used classification system. English. Illustration. Vector. Census vectors United States, Census regions and divisions, political map
Free with trial Lady conducting house to house marketing survey or census data collection. Census vectors In-home marketing survey or census. Lady conducting house to house marketing survey or census data collection
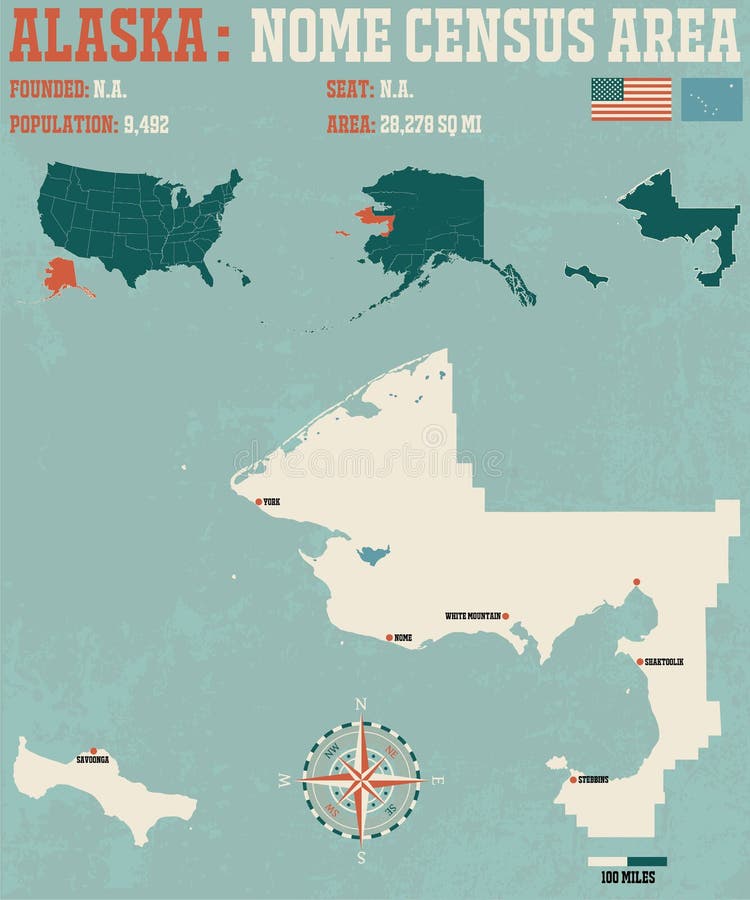
Free with trial Large and detailed map and infographic of Nome Census Area in Alaska. Census vectors Alaska: Nome Census Area. Large and detailed map and infographic of Nome Census Area in Alaska.
Free with trial The image is a heatmap of New York City, with varying shades of pink and gray indicating population density across different census blocks. Darker shades of pink represent higher population densities, particularly concentrated in Manhattan, parts of Brooklyn, and the Bronx. Lighter shades and gray areas indicate lower population densities in the outer boroughs like Staten Island and parts of. Census illustrations Heatmap of new york city\'s population density by census block. The image is a heatmap of New York City, with varying shades of pink and gray indicating. The image is a heatmap of New York City, with varying shades of pink and gray indicating population density across different census blocks. Darker shades of pink represent higher population densities, particularly concentrated in Manhattan, parts of Brooklyn, and the Bronx. Lighter shades and gray areas indicate lower population densities in the outer boroughs like Staten Island and parts of
Free with trial Census. Clipboard in pen in hand. Vector illustration flat design. Folder with documents. icon vector illustration. Census illustrations Census. Clipboard in pen in hand. Vector illustration flat design. Folder with documents
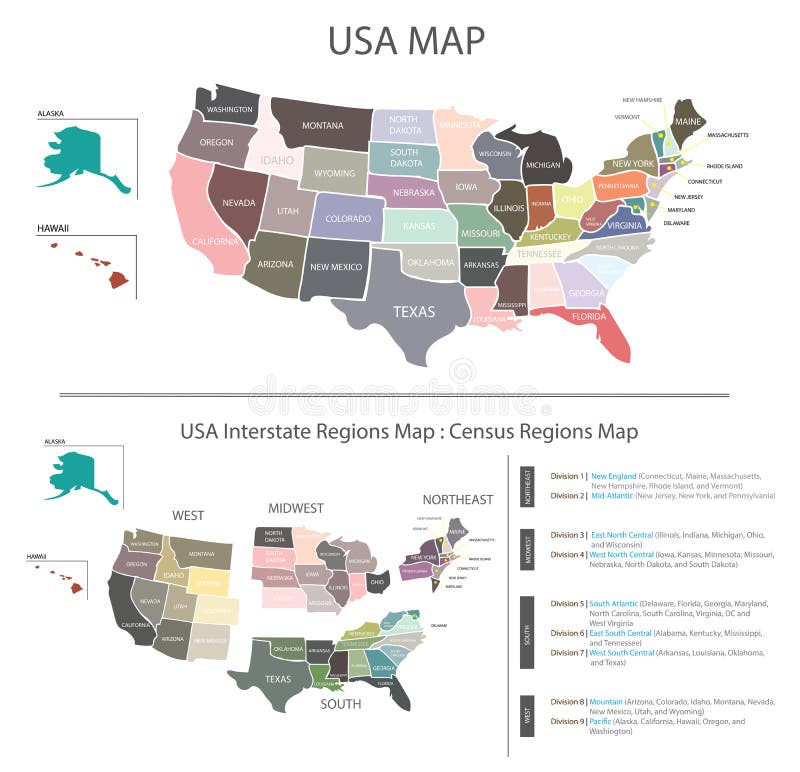
Free with trial USA MAP vector graphic with Census regions interstates map pastel colours tone with Region divisions details, Easy editable vector America map. Census vectors USA MAP vector graphic with Census regions interstates map pastel colours tone
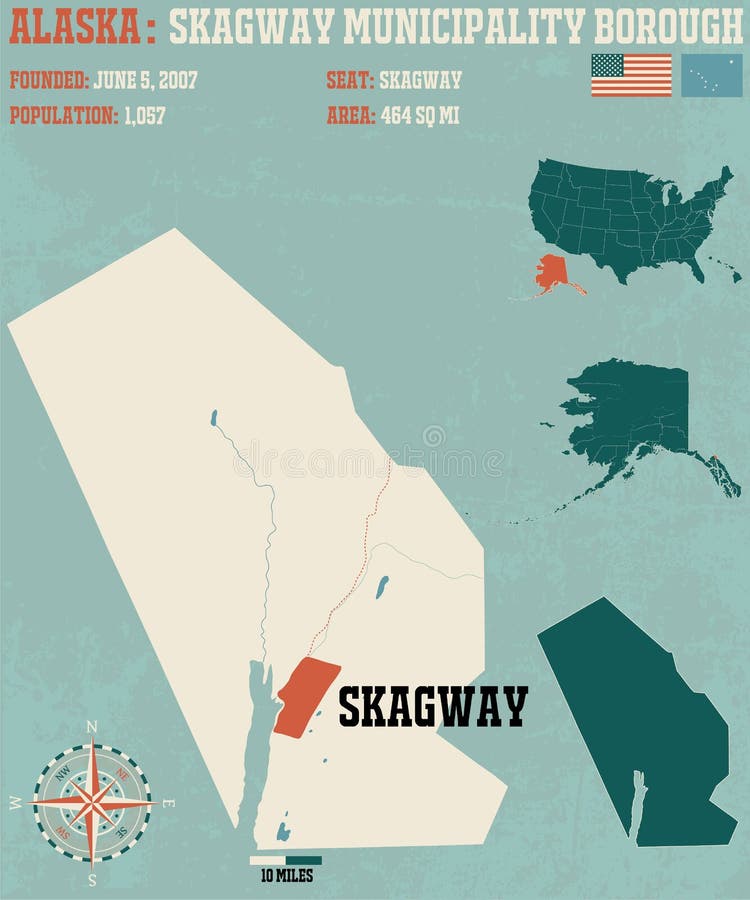
Free with trial Large and detailed map and infographic of Skagway Census Area in Alaska. Census vectors Alaska: Skagway Census Area. Large and detailed map and infographic of Skagway Census Area in Alaska.
Free with trial A modern handheld tablet displays a detailed census data dashboard featuring forms, charts, and a colorful donut chart. The scene highlights on? screen data entry, demographic fields, and analytical visuals, conveying themes of digital data collection, government statistics, and mobile analytics. Suitable for stock uses in reports, presentations, and marketing materials about data science, population studies, urban planning, and tech-enabled governance. Census vectors Mobile Census Dashboard on Tablet with Data Visualization. A modern handheld tablet displays a detailed census data dashboard featuring forms, charts, and a colorful donut chart. The scene highlights on?screen data entry, demographic fields, and analytical visuals, conveying themes of digital data collection, government statistics, and mobile analytics. Suitable for stock uses in reports, presentations, and marketing materials about data science, population studies, urban planning, and tech-enabled governance.
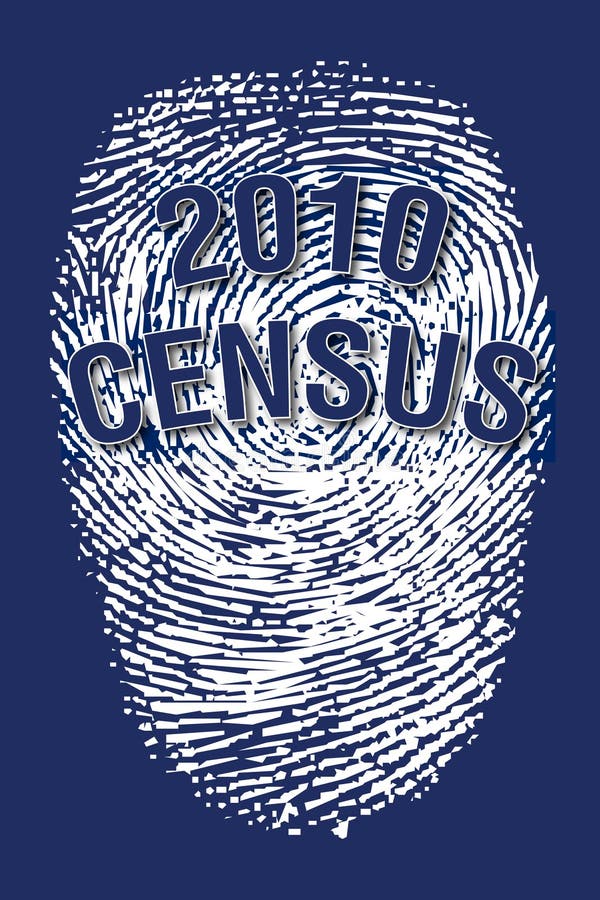
Free with trial Illustration of fingerprints for the 2010 Census. Census illustrations 2010 Census fingerprints. Illustration of fingerprints for the 2010 Census.
Free with trial Graphic for print and web design for the upcoming 2010 Census in the United States, run by the Commerce Department of the federal government. Census illustrations 2010 Census Graphic. Graphic for print and web design for the upcoming 2010 Census in the United States, run by the Commerce Department of the federal government.
Free with trial Road sign - 2010 census, black on yellow. Census illustrations Road sign - 2010 census
Free with trial The image is a chloropleth map of California divided into census tracts, with color gradients representing population density. The northern and central regions, including areas like the Bay Area and Sierra Nevada, show lower density (lighter green), while the southern coastal and urban regions, including Los Angeles, San Diego, and the Central Valley, exhibit high density (darker shades of green. Census illustrations Chloropleth map showing population density in california by census tract. The image is a chloropleth map of California divided into census tracts, with color gradients representing population density. The northern and central regions, including areas like the Bay Area and Sierra Nevada, show lower density (lighter green), while the southern coastal and urban regions, including Los Angeles, San Diego, and the Central Valley, exhibit high density (darker shades of green
Free with trial Illustration of fingerprint for the 2010 Census. Census illustrations 2010 Census fingerprint. Illustration of fingerprint for the 2010 Census.
Free with trial Vector Illustration For 2020 Population Census. Digital Concept With Survey And Check. Can Use For Landing Page, Template, Web, Mobile App, Poster, Banner, Flyer, Background, Website, Advertisement. Census vectors Vector Illustration For 2020 Population Census. Digital Concept With Survey And Check. Can Use For Landing Page, Template, Web
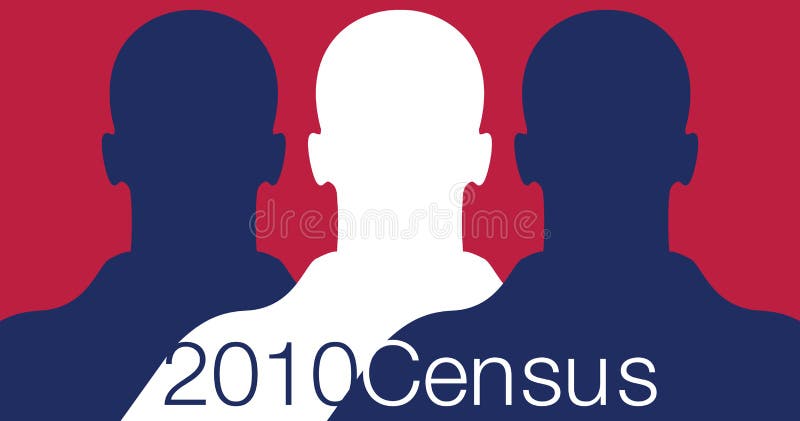
Free with trial Illustration American flag colors with silhouettes of men, for the 2010 Census. Census illustrations 2010 Census
Free with trial A group of siblings huddled around a computer eagerly clicking through census records and baptismal certificates.. Vector illustration. Census vectors A group of siblings huddled around a computer eagerly clicking through census records and baptismal certificates
Free with trial Census 2020 U. S. A. Banner with stars and stripes header. Census illustrations Census 2020 U.S.A. Banner
Free with trial Illustration with fingerprint for the 2010 Census. Census illustrations 2010 Census fingerprint. Illustration with fingerprint for the 2010 Census.
Free with trial Illustration with three silhouettes focusing on the 2010 Census. Colors of the American flag. Census illustrations 2010 Census American flag. Illustration with three silhouettes focusing on the 2010 Census. Colors of the American flag.
Free with trial Regions and Divisions of United States - statistical units defined by US Census Bureau. Grey vector map. Census vectors Regions and Divisions of United States
Free with trial Illustration with silhouettes of people for the 2010 Census. Colors of the American flag. Census illustrations 2010 Census
Free with trial Illustration with bar coded silhouette of man for the 2010 Census. Colors of the American flag. Census illustrations 2010 Census
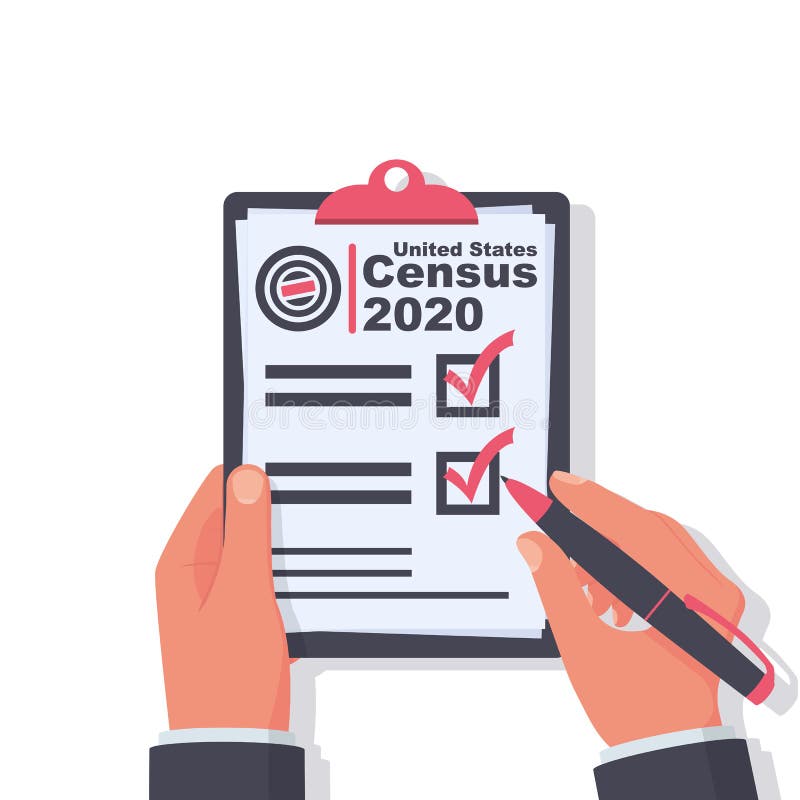
Free with trial Census 2020. The process of collecting and analyzing population demographic data. A government worker makes a census. Clipboard in pen in hand. Vector illustration flat design. Folder with documents. Census vectors Census 2020. The process of collecting and analyzing population demographic data.
Free with trial A conceptual illustration showing public population clusters on a regional map with various family and individual icons representing demographic distribution and census data. Census vectors Public Population Clusters Map with Family Icons and Regional Data. A conceptual illustration showing public population clusters on a regional map with various family and individual icons representing demographic distribution and census data.
Free with trial Mary and Joseph reach Bethlehem for the census. Census illustrations On route to Bethlehem. Mary and Joseph reach Bethlehem for the census.
Free with trial Mary and Joseph reach Bethlehem for the census. Census illustrations Mary and Joseph by Bethlehem. Mary and Joseph reach Bethlehem for the census.
Free with trial A 3d map of the United States, with the most populated states in dark blue and the least populated in light blue, data from 2000 U. S. Census. Census illustrations U.S. Population - Map of Most Populated States. A 3d map of the United States, with the most populated states in dark blue and the least populated in light blue, data from 2000 U.S. Census
Free with trial Florida map by people, infographic to check outbreak or cases. Census vectors Florida State People Census Map illustration. Florida People outbreak. Florida map by people, infographic to check outbreak or cases
Free with trial Population growth abstract concept vector illustration. Census service, world population explosion, human quantity growth, natural increase rate, overpopulation, demographics abstract metaphor. Census vectors Population growth abstract concept vector illustration.
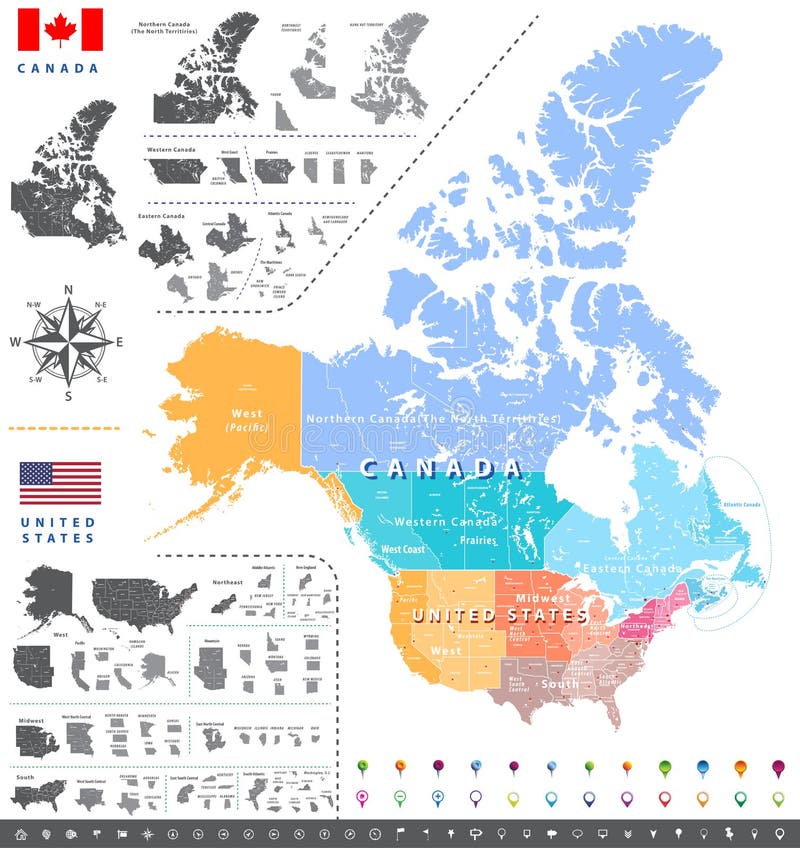
Free with trial United States census bureau regions ans divisions map; Canadian regions, provinces and territories map. Flags and location navigation icons. All layers detached and labeled. Census vectors United States census bureau regions ans divisions map; Canadian regions, provinces and territories map.
Free with trial Text and flag on the the keyboard. 3D. Census illustrations Online Census text and flag of the USA on the keyboard. Conceptual 3D rendering. Text and flag on the the keyboard. 3D
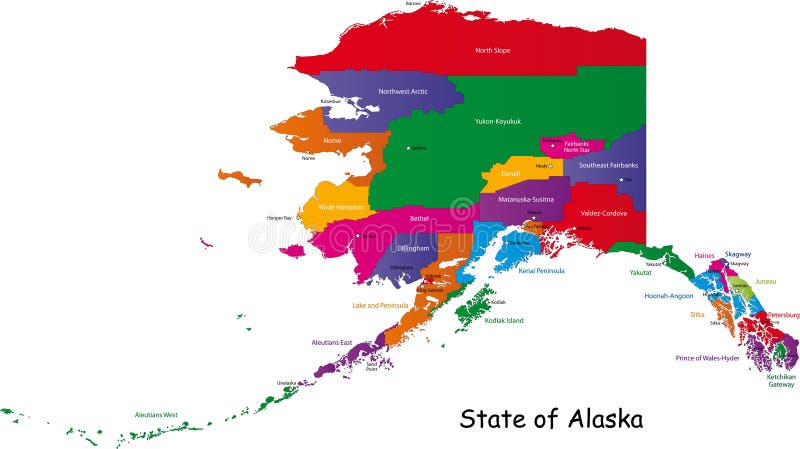
Free with trial Colorful illustrated design of the map of Alaska (USA), including counties and county seats. Isolated against a white background. Census vectors Alaska map. Colorful illustrated design of the map of Alaska (USA), including counties and county seats. Isolated against a white background.
Free with trial Diversity identity and privacy concept and personal private data symbol as diverse finger prints or fingerprint icons and census population in a 3D illustration style. Census illustrations Diversity Identity Symbol. Diversity identity and privacy concept and personal private data symbol as diverse finger prints or fingerprint icons and census population in a 3D illustration style.
Free with trial Illustrated design of the map of Alaska (USA), including counties and county seats. Isolated against a white background. Census vectors State of Alaska. Illustrated design of the map of Alaska (USA), including counties and county seats. Isolated against a white background.
Free with trial An illustration featuring your choice of humanlike figures in groups of 3 to 10 for illustrating statistics, for example: 2 out of 3 people love s. Census illustrations 2 Out of Every Statistic Figures. An illustration featuring your choice of humanlike figures in groups of 3 to 10 for illustrating statistics, for example: 2 out of 3 people love s
Free with trial Human crowd forms large number five. Abstract view of massive population statistics and census information. Teamwork concept. Census illustrations Huge gathering of miniature human figures forming shape of large number five. Human crowd forms large number five. Abstract view of massive population statistics and census information. Teamwork concept
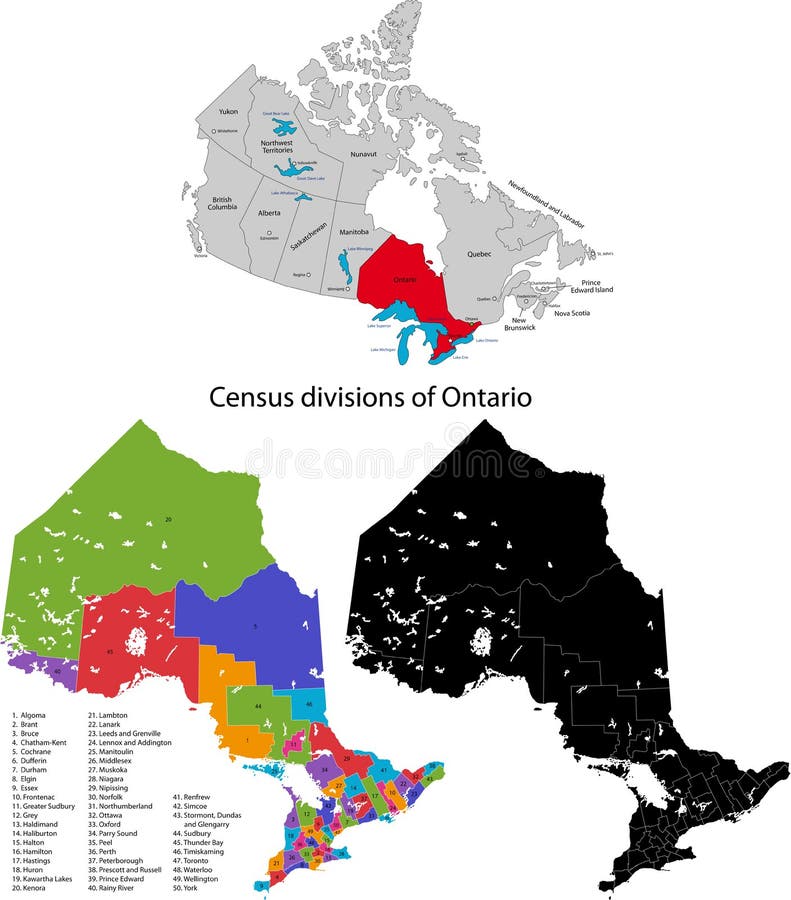
Free with trial Administrative division of Canada. Map of Ontario with census divisions, vector illustration. Census vectors Province of Canada - Ontario. Administrative division of Canada. Map of Ontario with census divisions, vector illustration
Free with trial A city crowd seen from above (vector). Census vectors Aerial view. A city crowd seen from above (vector)
Free with trial Human crowd forms large number six. Top view abstract concept of large population census statistics. Countdown beginning. Census illustrations Crowd of people forming shape of number six standing on isolated light blue background. Human crowd forms large number six. Top view abstract concept of large population census statistics. Countdown beginning
Free with trial Graphic depicting a USA map with silhouette people over the words: We the People (concept: 4th of July or Democracy). Census illustrations We-people_02. Graphic depicting a USA map with silhouette people over the words: We the People (concept: 4th of July or Democracy)
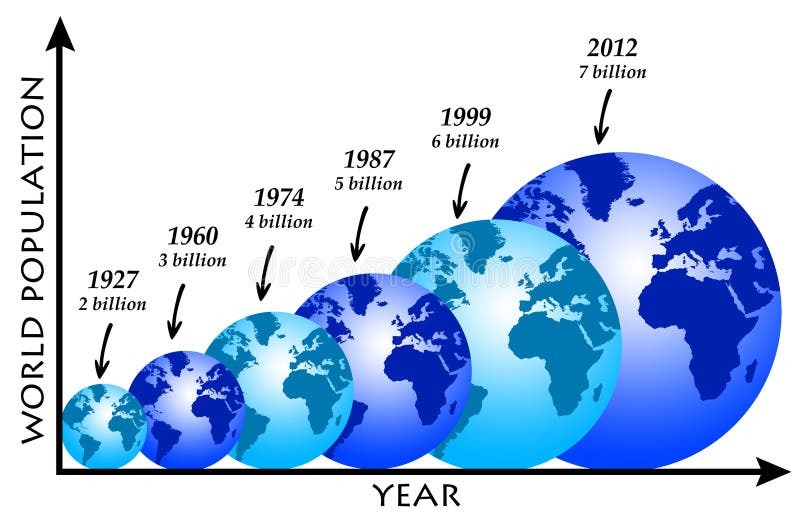
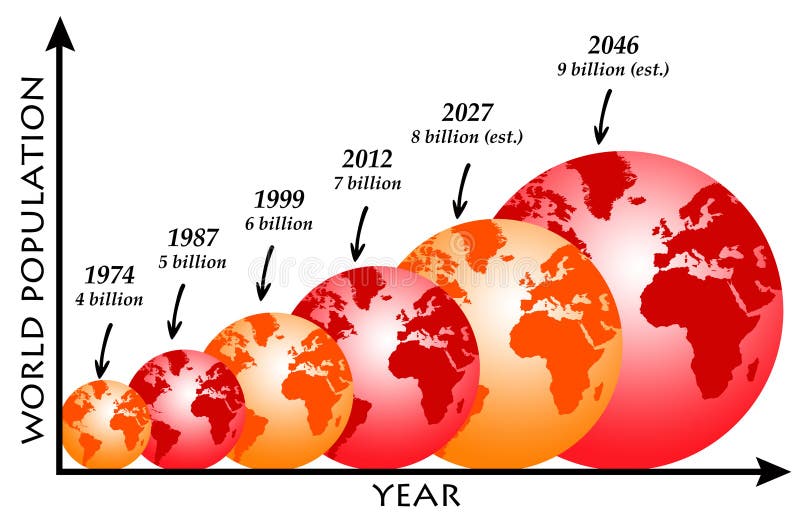
Free with trial Growth of world population over the last century. Census illustrations World population
Free with trial Group of small people creating number six on white floor. Population census statistic concept unity synergy collaboration society. Census illustrations Large assembly of tiny human figures forming curvilinear design of number six symbol idea. Group of small people creating number six on white floor. Population census statistic concept unity synergy collaboration society
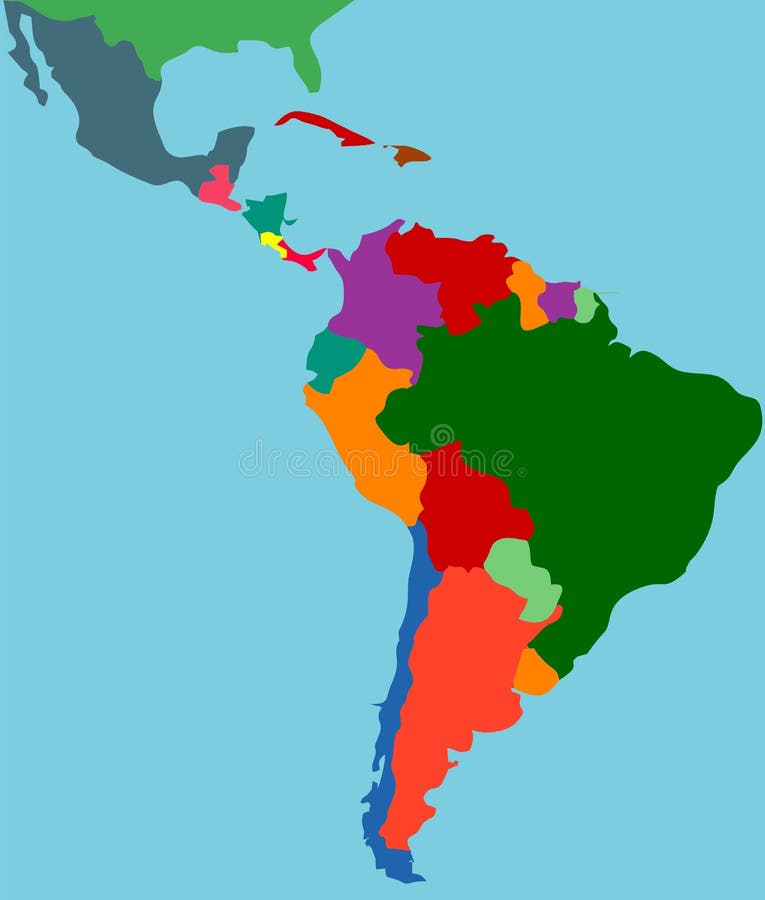
Free with trial The name Latin America was introduced by the French Emperor Napoleon III as a political term. Latin America and Indochina were considered while in the territory of the specific national interests of the Second Empire. This term originally meant those parts of America, which speak Romance languages, that is, the territory inhabited by people from the Iberian Peninsula and France during the XV-XVI centuries. Census vectors Latin America
Free with trial Stair stepped, blue column/bar graph with a simplistic representation of different races on each bar. Each person is wearing different colored clothing. Column surface is shiny and metallic. Illustration works well in depicting demographic data; population characteristics. Census illustrations Demographic Chart. Stair stepped, blue column/bar graph with a simplistic representation of different races on each bar. Each person is wearing different colored clothing. Column surface is shiny and metallic. Illustration works well in depicting demographic data; population characteristics.
Free with trial Demography change and demographic changes in population diversity as society becoming diverse in a 3D illustration style. Census illustrations Demography Change
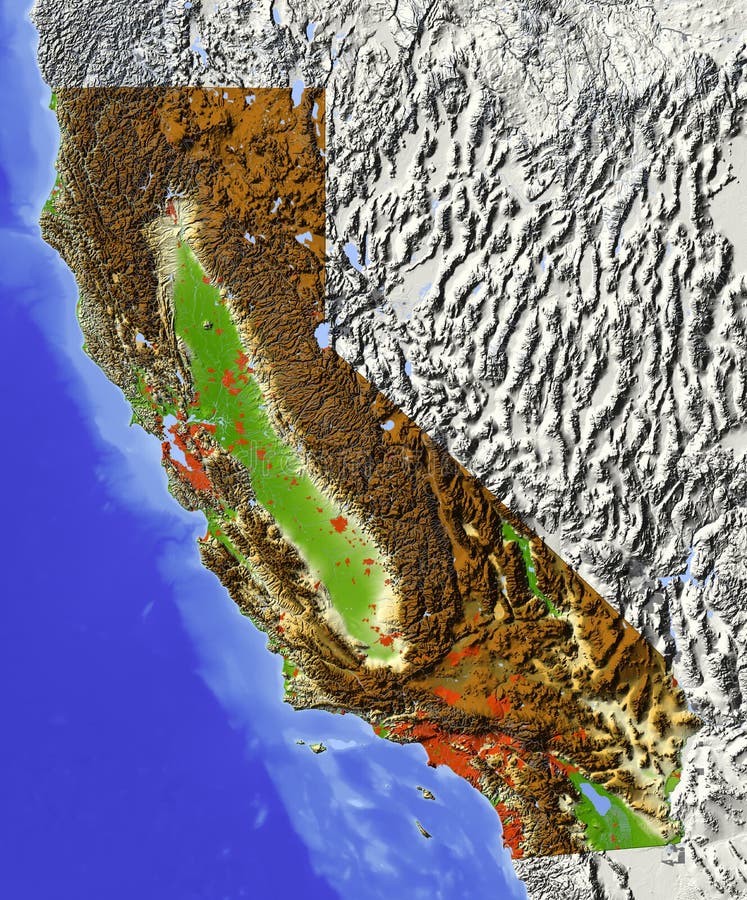
Free with trial California. Shaded relief map. Shows major urban areas and rivers, surrounding territory greyed out. Colored according to relative terrain height. Clipping path for the state area included. Data sources: US Census Bureau, NASA. Census illustrations California, relief map. California. Shaded relief map. Shows major urban areas and rivers, surrounding territory greyed out. Colored according to relative terrain height. Clipping path for the state area included. Data sources: US Census Bureau, NASA
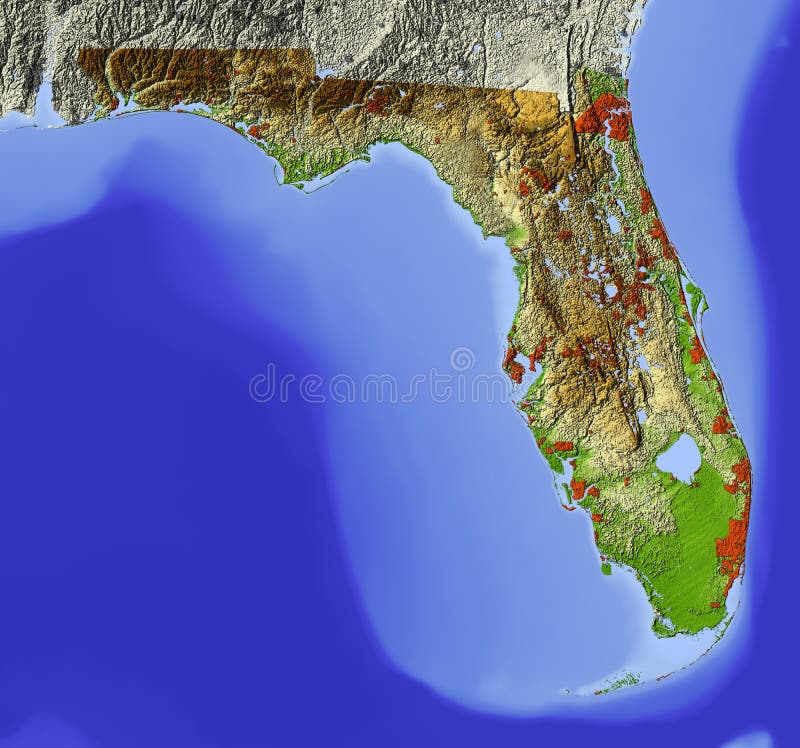
Free with trial Shaded relief map of Florida. Shows major urban areas, surrounding territory greyed out. Colored according to relative terrain height. Data sources: US Census Bureau, NASA. Census illustrations Florida, shaded relief map. Shaded relief map of Florida. Shows major urban areas, surrounding territory greyed out. Colored according to relative terrain height. Data sources: US Census Bureau, NASA
Free with trial Graphic depicting a USA map with silhouette people. Census illustrations We-people_03. Graphic depicting a USA map with silhouette people
Free with trial Different people caught from the sea to illustrate successful marketing. Census vectors Marketing
Free with trial Funny comic character with question sign for presentations etc.. Available as vector too. Census vectors Question Worm. Funny comic character with question sign for presentations etc.. Available as vector too.
Free with trial Kentucky. Shaded relief map. Shows major urban areas and rivers, surrounding territory greyed out. Colored according to relative terrain height. Clipping path for the state area included. Data sources: US Census Bureau, NASA. Census illustrations Kentucky, relief map. Kentucky. Shaded relief map. Shows major urban areas and rivers, surrounding territory greyed out. Colored according to relative terrain height. Clipping path for the state area included. Data sources: US Census Bureau, NASA
Free with trial A business professional is seen from behind, hands typing on a modern laptop. The laptop features a striking holographic display projecting intricate data visualizations, including maps, bar charts, and a layered 3D representation of urban data. Key metrics like 'Population Density,' 'Building Footprint,' and 'Census Data' are prominently displayed, suggesting advanced urban planning, smart city development, and geospatial analysis. This image embodies cutting-edge technology for big data insights and strategic decision-making in a digital era. Census illustrations Futuristic Urban Data Analysis on Holographic Laptop Display. A business professional is seen from behind, hands typing on a modern laptop. The laptop features a striking holographic display projecting intricate data visualizations, including maps, bar charts, and a layered 3D representation of urban data. Key metrics like 'Population Density,' 'Building Footprint,' and 'Census Data' are prominently displayed, suggesting advanced urban planning, smart city development, and geospatial analysis. This image embodies cutting-edge technology for big data insights and strategic decision-making in a digital era.
Free with trial An illustration of a cartoon pencil writing on a survey clipboard. Census vectors Cartoon Survey Clipboard with Pencil. An illustration of a cartoon pencil writing on a survey clipboard
Free with trial An illustration of a cartoon pencil character writing on a survey clipboard. Census vectors Cartoon Pencil Man and Survey Clipboard. An illustration of a cartoon pencil character writing on a survey clipboard
Free with trial A mouse connected to a survey questionnaire. Concept for online internet survey, test, census, election or research questionnaire. Census vectors Online survey or questionnaire concept. A mouse connected to a survey questionnaire. Concept for online internet survey, test, census, election or research questionnaire.
Free with trial Group of people in form of world map. Group of people making a earth planet shape. A large group of people in the shape of a world map. Population. Globalization. People from different countries. Census vectors Group of people in form of world map
Free with trial Groups of people as data statistics inside pieces of a pie chart. Census vectors People statistics population data pie chart. Groups of people as data statistics inside pieces of a pie chart
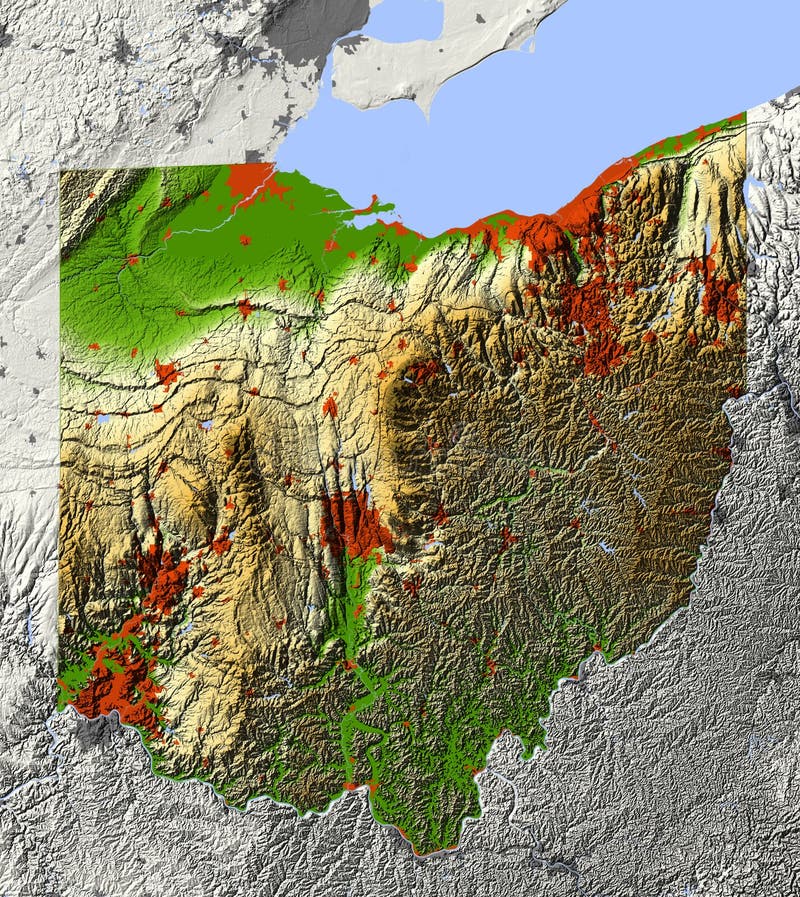
Free with trial Ohio. Shaded relief map. Shows major urban areas and rivers, surrounding territory greyed out. Colored according to relative terrain height. Clipping path for the state area included. Data sources: US Census Bureau, NASA. Census illustrations Ohio, relief map. Ohio. Shaded relief map. Shows major urban areas and rivers, surrounding territory greyed out. Colored according to relative terrain height. Clipping path for the state area included. Data sources: US Census Bureau, NASA
Free with trial Fragile earth. Conceptual image: save the planet. 3D image. Globe Save. Census illustrations Globe Save