Free with trial Graph and chart of the development of digital global technologies of the future against the background of the world map. Binary code earth map, abstract electronics. Digital technology concept, internet of things, cloud service, big data, vector infographics. Chart data code vectors Graph chart of development of digital global technologies of against background of world map. Binary code earth map, abstract. Graph and chart of the development of digital global technologies of the future against the background of the world map. Binary code earth map, abstract electronics. Digital technology concept, internet of things, cloud service, big data, vector infographics
Free with trial Displaying translucent area chart over dashboard, with data charts, code blocks, hexagon network. Analytics, cybersecurity, futuristic, digital, visualization, interface, technology. Chart data code illustrations Displaying translucent area chart over dashboard, with data charts, code blocks, hexagon network
Free with trial Glowing binary code data digits flowing on computer display. Chart data code illustrations Binary code data flowing on display. Glowing binary code data digits flowing on computer display
Free with trial Glowing binary code data digits flowing on computer display. Chart data code illustrations Binary code data flowing on display. Glowing binary code data digits flowing on computer display
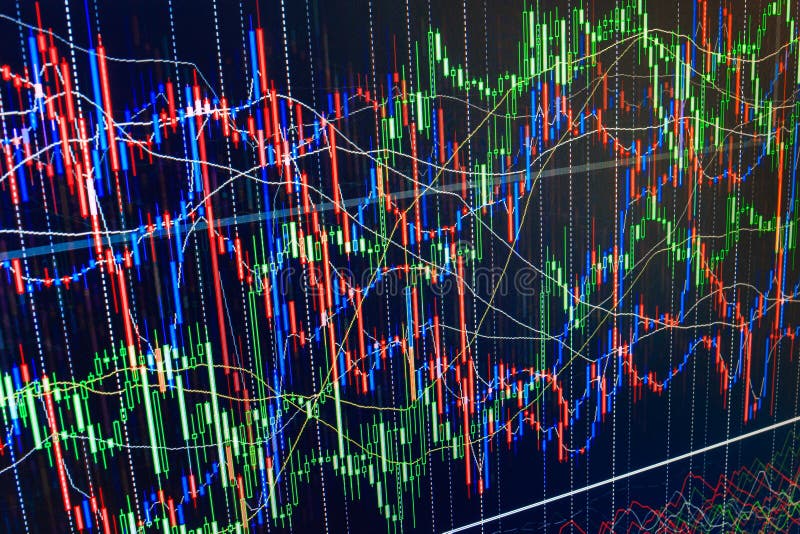
Free with trial Stock market price digital display abstract. Modern virtual technology, illustration binary code on abstract technology background. Media gray and black image with graphs and icons. New modern computer and business strategy as concept. Financial diagram with candlestick chart used in market analysis for variation report of share price Stock market chart, graph on green background Shallow DOF effect. Chart data code illustrations Display of Stock market quotes chart graph on m Abstract financial background trade colorful green, blue, red abstract. Data on li. Stock market price digital display abstract. Modern virtual technology, illustration binary code on abstract technology background. Media gray and black image with graphs and icons. New modern computer and business strategy as concept. Financial diagram with candlestick chart used in market analysis for variation report of share price Stock market chart, graph on green background Shallow DOF effect
Free with trial Displaying central gray pie chart icon on interface, with chart icons, data nodes and code snippets. Technology, analytics, data, visualization, digital, innovation, interface. Chart data code illustrations Displaying central gray pie chart icon on interface, with chart icons, data nodes and code snippets
Free with trial Creative glowing map with forex chart on binary code background. Global business and data concept. 3D Rendering. Chart data code illustrations Global business and data concept
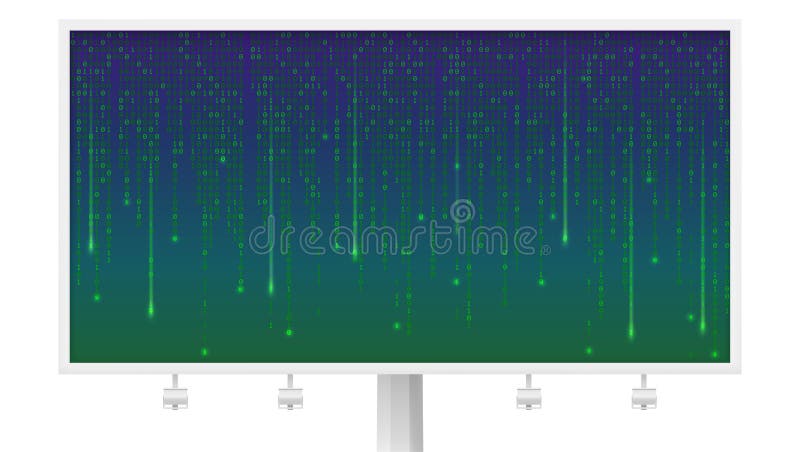
Free with trial Billboard of floating binary computer code. Code listing of matrix. Technology background. Data pattern with zero and one. Template for concept of security, programming and hacking, internet service. Chart data code vectors Billboard of floating binary computer code. Code listing of matrix. Technology background. Data pattern with zero and
Free with trial Binary computer code. Technology horizontal background isolated on white. Data pattern with zero and one. Template for concept of security, programming and hacking, deep decryption and encryption. Chart data code vectors Binary computer code. Technology horizontal background isolated on white. Data pattern with zero and one. Template for
Free with trial Glowing word TECH shining in digital environment, with pie chart segments, data nodes, binary code. Technology, data visualization, digital interface, neon, analytics, network, innovation. Chart data code illustrations Glowing word TECH shining in digital environment, with pie chart segments, data nodes, binary code
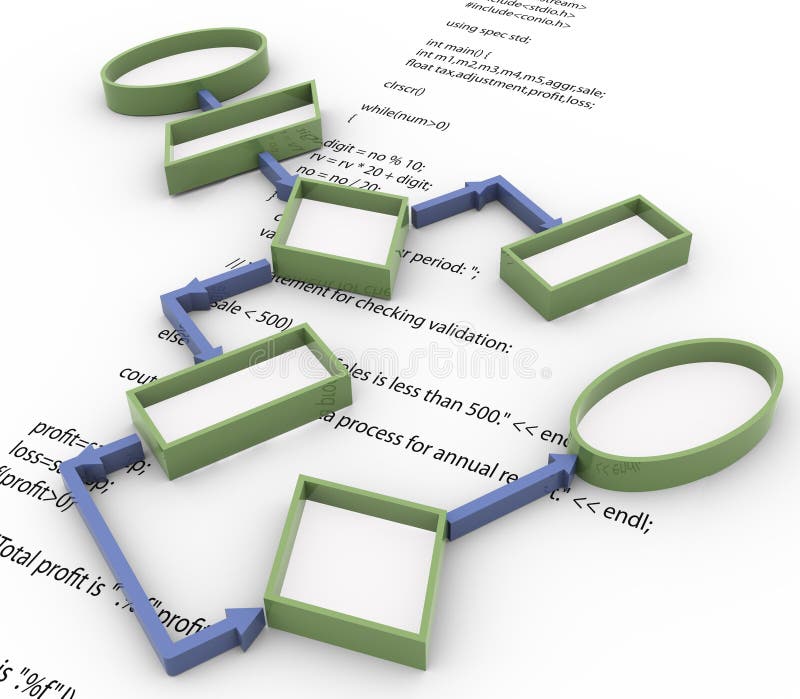
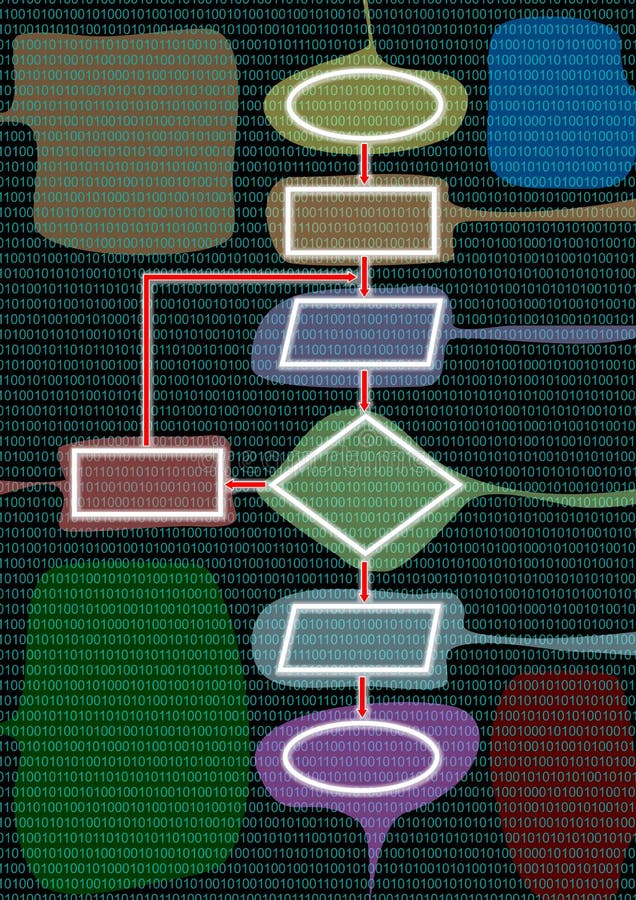
Free with trial 3d render of basic program flow chart on the background of computer code snippet. Chart data code illustrations 3d flowchart on code snippet background. 3d render of basic program flow chart on the background of computer code snippet.
Free with trial Data integration database connect media files chart symbol analysis vector. Chart data code vectors Data integration database connect media files chart analysis. Data integration database connect media files chart symbol analysis vector
Free with trial Computer technology and Big Data. Abstract binary code design in web style. Technology modern screen. Digital cyber pattern. Computer concept. Vector illustration. Chart data code vectors Computer technology and Big Data.
Free with trial Pie chart showing data distribution beside shield containing binary code, symbolizing data security, analysis, and protection. Ideal for technology, cybersecurity, privacy, analytics, safety cloud. Chart data code vectors Data Security Represented by Pie Chart and Shield with Binary Code. Pie chart showing data distribution beside shield containing binary code, symbolizing data security, analysis, and protection. Ideal for technology, cybersecurity, privacy, analytics, safety cloud
Free with trial Stock market price digital display abstract. Modern virtual technology, illustration binary code on abstract technology background. Media gray and black image with graphs and icons. New modern computer and business strategy as concept. Financial diagram with candlestick chart used in market analysis for variation report of share price Stock market chart, graph on green background. Stock market graph. Bar graphs, diagrams, financial figures. Trading on market concept. Closeup photo. Stock trade live. Online forex data screen concept. Finance business diagram on the screen. Shallow DOF effect. Chart data code illustrations Stock market graph. Bar graphs, diagrams, financial figures. Trading on market concept. Closeup photo. Stock trade live forex. Stock market price digital display abstract. Modern virtual technology, illustration binary code on abstract technology background. Media gray and black image with graphs and icons. New modern computer and business strategy as concept. Financial diagram with candlestick chart used in market analysis for variation report of share price Stock market chart, graph on green background. Stock market graph. Bar graphs, diagrams, financial figures. Trading on market concept. Closeup photo. Stock trade live. Online forex data screen concept. Finance business diagram on the screen. Shallow DOF effect
Free with trial Thin line flat design of data analysis magnifier with pie chart. Premium quality outline symbol. Modern style logo vector illustration concept. Chart data code vectors Thin line flat design of data analysis magnifier with pie chart
Free with trial Safety concept: Painted red text Self Defense on Digital Data Paper background with Scheme Of Binary Code. Chart data code illustrations Safety concept: Self Defense on Digital Data Paper background. Safety concept: Painted red text Self Defense on Digital Data Paper background with Scheme Of Binary Code
Free with trial Data analysis, programming, technology trends, growth, business efficiency, coding. Image features arrows, a bar chart and code symbols. Data analysis and programming conceptual idea. Chart data code vectors Data Growth and Coding Concept with Arrows, Chart, and Code Tag Symbol. Data analysis, programming, technology trends, growth, business efficiency, coding. Image features arrows, a bar chart and code symbols. Data analysis and programming conceptual idea
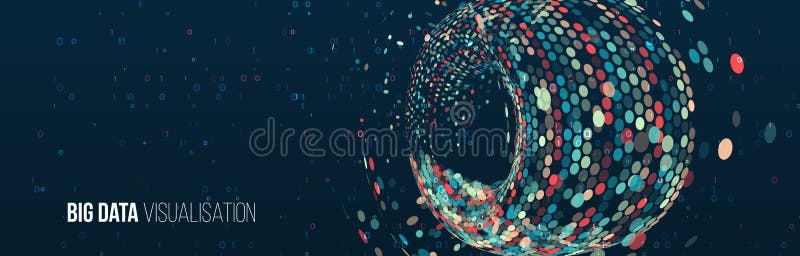
Free with trial Wide Big data visualization. Machine learning algorithm for information filter and analytic. Abstract background with circle array and binary code. Data array visual concept. Big data connection complex. Chart data code vectors Wide Big data visualization. Machine learning algorithm for information filter and analytic. Abstract background with circle array
Free with trial Information concept: Painted blue text Data Overload on Torn Paper background with Scheme Of Binary Code, 3d render. Chart data code illustrations Information concept: Data Overload on Torn Paper. Information concept: Painted blue text Data Overload on Torn Paper background with Scheme Of Binary Code, 3d render
Free with trial An image for the concept of Worldwide Marketing Network Technology showing a map of planet earth with computer data code around and behind it with a sphere of web around and illustrates of men and women on mobile phones indicating they are communicating for marketing purposes safely over the internet or world wide web. Also featured is a block of chart bricks. Chart data code illustrations World Marketing Network Technology. An image for the concept of Worldwide Marketing Network Technology showing a map of planet earth with computer data code around and behind it with a sphere of web around and illustrates of men and women on mobile phones indicating they are communicating for marketing purposes safely over the internet or world wide web. Also featured is a block of chart bricks.
Free with trial QR code on phone, line graph, data chart, and dashboard interface. Ideal for fintech, analytics, mobile banking, data visualization online transactions business tools digital marketing. Simple. Chart data code vectors QR Code on Smartphone with Analytics Chart and Data Dashboard Concept. QR code on phone, line graph, data chart, and dashboard interface. Ideal for fintech, analytics, mobile banking, data visualization online transactions business tools digital marketing. Simple
Free with trial Abstract representation of electronic data and data base: data mining, data warehouse and data repository. Chart data code illustrations Data Mining
Free with trial Data protection text on technological background. Chart data code illustrations Data protection
Free with trial Charts and data on a blue world map. Chart data code illustrations Charts and data on the world map. Charts and data on a blue world map
Free with trial Business strategy, marketing, data management, financial analytics, technology integration, digital solutions. A growth chart with arrows, QR code and data cards. Business strategy and marketing. Chart data code vectors Business Growth Chart with QR Code and Data Communication Elements. Business strategy, marketing, data management, financial analytics, technology integration, digital solutions. A growth chart with arrows, QR code and data cards. Business strategy and marketing
Free with trial Business in cyberspace. Data analysis. Graphs and charts of the dynamics of development. 3d illustration on a futuristic background. Chart data code illustrations Business in cyberspace. Data analysis. Graphs and charts of the dynamics of development
Free with trial Binary code data flowing on display. Chart data code illustrations Binary abstract background. Binary code data flowing on display
Free with trial Data Information Infographic Technology Connecting Concept. Chart data code illustrations Data Information Infographic Technology Connecting Concept
Free with trial Business analytics, financial growth, market research, global trends, data management, digital tools. Visual of graph with QR code and chart. Business analytics and financial growth. Chart data code vectors Data Analysis Concept with Line Graph, Bar Chart, QR Code, and Pie Chart Element. Business analytics, financial growth, market research, global trends, data management, digital tools. Visual of graph with QR code and chart. Business analytics and financial growth
Free with trial Success business chart with binary code in front. Chart data code vectors Grow. Success business chart with binary code in front.
Free with trial Color QR Code in multiple function Design Concept. Chart data code vectors Color QR Code Design Concept. Color QR Code in multiple function Design Concept
Free with trial The multicolor flow chart with digital background. Chart data code illustrations Flow chart
Free with trial Data analytics, technology, information sharing, mobile scanning, business insights, user interaction. Blue bar chart next to a QR code. Data analytics and technology concept. Chart data code vectors Data Visualization Bar Chart and QR Code for Information Access and Technology. Data analytics, technology, information sharing, mobile scanning, business insights, user interaction. Blue bar chart next to a QR code. Data analytics and technology concept
Free with trial Data Management - illustration with street sign in front of office building. Chart data code illustrations Data Management
Free with trial Data concept background blue background concept blue text. Chart data code illustrations Data concept background
Free with trial Lock with binary code representing data security, segmented pie chart for user access control, and cloud icon for storage. Ideal for cybersecurity, privacy, encryption, cloud services, data. Chart data code illustrations Digital Data Security with Lock, Binary Code, Cloud, and User Distribution Chart. Lock with binary code representing data security, segmented pie chart for user access control, and cloud icon for storage. Ideal for cybersecurity, privacy, encryption, cloud services, data
Free with trial Big data background concept blue text. Chart data code illustrations Big data background
Free with trial Bigdata integrated 3d web icons. Digital network isometric interact concept. Connected graphic design dot and line system. Abstract background for big data center, research, analysis. Vector Infograph. Chart data code vectors Big data integrated 3d web icons. Digital network isometric interact concept. Bigdata integrated 3d web icons. Digital network isometric interact concept. Connected graphic design dot and line system. Abstract background for big data center, research, analysis. Vector Infograph
Free with trial Data warehouse technology concept with red text. Chart data code illustrations Data warehouse technology concept
Free with trial Data analysis, coding, statistics, software development, cybersecurity, machine learning. Magnifying glass over binary code, pie chart and text box. Data analysis and coding concepts. Chart data code illustrations Binary Code Analysis with Magnifying Glass, Pie Chart, and Data Labels Concept. Data analysis, coding, statistics, software development, cybersecurity, machine learning. Magnifying glass over binary code, pie chart and text box. Data analysis and coding concepts
Free with trial Vector and illustration: Data science line icon set. Included icons as big data, graph, AI, application, graph plotting, graph relation and more. Chart data code vectors Data science line icon set. Included icons as big data, graph, AI, application, graph plotting, graph relation and more.
Free with trial Programming code abstract screen software developer. Computer script. Chart data code illustrations Programming coding source code screen. Programming code abstract screen software developer. Computer script.
Free with trial Positive growth data in machinery industry vector illustration. Chart data code vectors Positive growth data in machinery industry vector
Free with trial Data science, technology innovation, system optimization, process engineering, code analysis, digital transformation. Magnifying glass showing binary code with a gear and data chart. Data science. Chart data code vectors Data Analysis and Optimization Concept with Binary Code, Gear, and Analytics Chart. Data science, technology innovation, system optimization, process engineering, code analysis, digital transformation. Magnifying glass showing binary code with a gear and data chart. Data science
Free with trial One growing chart made with the code bar (3d render). Chart data code illustrations Chart
Free with trial Data warehouse sign illustration design over a white background. Chart data code illustrations Data warehouse sign illustration design
Free with trial Flow chart , This is a computer generated and 3d rendered image. Chart data code illustrations Flow chart
Free with trial Eye focusing on binary code, a bar chart, and a professional analyst with a laptop. Ideal for analysis, technology, coding, data security, innovation machine learning and communication. Simple flat. Chart data code illustrations Data Analysis and Insights Visualization with Binary Code, Bar Chart, and Expert Analyst. Eye focusing on binary code, a bar chart, and a professional analyst with a laptop. Ideal for analysis, technology, coding, data security, innovation machine learning and communication. Simple flat
Free with trial Digital landscape or sound waves visualization. Big data concept. Wave of glowing Multicolor particles. Technology or cyber background. Sound waves or audio equalizer. EPS 10 vector illustration. Chart data code vectors Digital landscape or sound waves visualization. Big data concept.
Free with trial Vector abstract colorful big data information sorting visualization. Social network, financial analysis of complex databases. Visual information complexity clarification. Intricate data graphic. Chart data code vectors Vector abstract colorful big data information sorting visualization.
Free with trial Vector abstract colorful big data information sorting visualization. Social network, financial analysis of complex databases. Visual information complexity clarification. Intricate data graphic. Chart data code illustrations Vector abstract colorful big data information sorting visualization.
Free with trial Software development, data analysis, programming concepts, code review, project management, workflow organization. Coding interface with lines, pie chart and documents. Software development and data. Chart data code vectors Software Interface with Code Lines, Data Chart, and Documentation Papers Concept. Software development, data analysis, programming concepts, code review, project management, workflow organization. Coding interface with lines, pie chart and documents. Software development and data
Free with trial Big data abstract visualization: hills on digital information surface. Digital data or cyberspace concept: virtual landscape. 3D sound waves, futuristic background. EPS 10, vector illustration. Chart data code vectors Big data abstract visualization: hills on digital information surface.
Free with trial Application of laptop with business graph and analytics data on isometric laptop. Digital money market, investment, finance and trading. Chart data code vectors Application of laptop with business graph and analytics data on isometric laptop .Digital money market, investment
Free with trial Vector abstract colorful financial big data graph visualization. Futuristic infographics aesthetic design. Visual information complexity. Intricate data threads chart. Business analytics. Chart data code vectors Vector abstract colorful financial big data graph visualization. Futuristic infographics aesthetic design.
Free with trial Education, science, data analytics, technology, global studies, digital tools. Open book, planet QR code chart and magnifying glass icons. Education and science concepts. Chart data code vectors Global Education, Data Analysis, and Technology Concepts with Planet, QR Code, and Chart. Education, science, data analytics, technology, global studies, digital tools. Open book, planet QR code chart and magnifying glass icons. Education and science concepts
Free with trial Creative glowing binary code background with business chart. Technology, computing and financial growth concept. 3D Rendering. Chart data code illustrations Technology, computing and financial growth concept
Free with trial Creative glowing binary code background with business chart. Technology, computing and cyberspace concept. 3D Rendering. Chart data code illustrations Technology, computing and cyberspace concept
Free with trial Two developers working with big data technology. Big data management and storage, database analytics and design, data software engineering concept, violet palette. Header or footer banner. Chart data code vectors Big data developer header banner. Two developers working with big data technology. Big data management and storage, database analytics and design, data software engineering concept, violet palette. Header or footer banner.
Free with trial Data analysis, cloud storage, technology, digital innovation, QR communication, business solutions. A cloud, QR code and bar chart. Data analysis and cloud storage concept. Chart data code vectors Cloud Shape with QR Code and Bar Chart Data Analytics, Technology, and Digital Solutions. Data analysis, cloud storage, technology, digital innovation, QR. Data analysis, cloud storage, technology, digital innovation, QR communication, business solutions. A cloud, QR code and bar chart. Data analysis and cloud storage concept
Free with trial Big data and Data analysis vector line icons, minimal pictogram design. Editable Stroke. EPS 10. Chart data code vectors Big data and Data analysis vector line icons, minimal pictogram design. Editable Stroke. EPS 10
Free with trial Web development concept: Painted blue text Blog on Digital Data Paper background with Scheme Of Hand Drawn Site Development Icons. Chart data code illustrations Web development concept: Blog on Digital Data Paper background. Web development concept: Painted blue text Blog on Digital Data Paper background with Scheme Of Hand Drawn Site Development Icons
Free with trial Abstract vector finance big data graph visualization. Stock index infographics. Visual information complexity. Intricate data threads chart. Business analytics. Artifficial inteligence. Chart data code vectors Big data flow vector complex visualisation. Abstract vector finance big data graph visualization. Stock index infographics. Visual information complexity. Intricate data threads chart. Business analytics. Artifficial inteligence.
Free with trial Data management, business analysis, tech integration, growth tracking, document scanning, digital solutions. A paper document, QR code and a growth chart. Data management and business analysis. Chart data code vectors Document Management and Digital Data Integration with QR Code and Growth Analytics Chart. Data management, business analysis, tech integration, growth tracking, document scanning, digital solutions. A paper document, QR code and a growth chart. Data management and business analysis
Free with trial Vector abstract financial big data graph visualization. Stock index infographics aesthetic design. Visual information complexity. Intricate data threads chart. Business analytics. Chart data code vectors Vector abstract financial big data graph visualization. Stock index infographics aesthetic design. Visual information
Free with trial 9 big data icons pack. trendy big data icons on white background. thin outline line icons such as repair, cloud computing, company. big data icon set for web and mobile. Chart data code vectors 9 big data icons pack. trendy big data icons on white background. thin outline line icons such as repair, cloud computing, company
Free with trial Vector abstract colorful financial big data graph visualization. Futuristic blocks infographics aesthetic design. Visual information complexity. Intricate data threads chart. Business analytics. Chart data code vectors Vector abstract colorful financial big data graph visualization. Futuristic blocks infographics aesthetic design. Visual
Free with trial Business strategy, data analysis, customer acquisition, growth trends, marketing, technology. Magnifying glass and chart, QR code magnet attracting lines. Data analysis and customer acquisition. Chart data code illustrations Data Analysis, QR Code Scanning, and Customer Attraction Concept with Magnet Icon and Chart. Business strategy, data analysis, customer acquisition, growth trends, marketing, technology. Magnifying glass and chart, QR code magnet attracting lines. Data analysis and customer acquisition
Free with trial Abstract technology illustration with different symbols. Abstract code presentation. Vector Illustration. Chart data code vectors Abstract technology illustration with different symbols. Abstract code presentation. Vector Illustration
Free with trial Two developers working with big data technology. Big data management and storage, database analytics and design, data software engineering concept, violet palette. Vector isolated illustration. Chart data code vectors Big data developer concept vector illustration. Two developers working with big data technology. Big data management and storage, database analytics and design, data software engineering concept, violet palette. Vector isolated illustration.
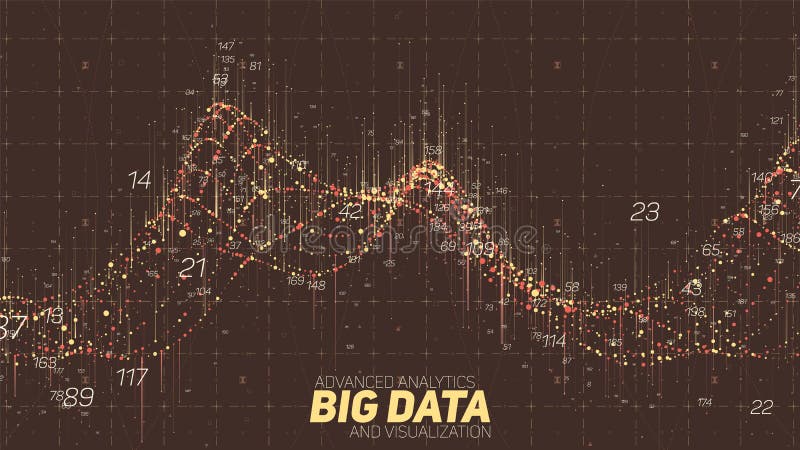
Free with trial Big data wave visualization. Futuristic infographic. Information aesthetic design. Visual data complexity. Complex business chart analytics. Social network representation. Abstract data graph. Chart data code vectors Big data wave visualization. Futuristic infographic. Information aesthetic design. Visual data complexity. Complex
Free with trial Bar chart rising and falling, suitcase representing work or business, binary code symbolizing data or computing. Ideal for analytics, career growth, data trends, tech, finance, professional. Chart data code vectors Bar chart with suitcase icon and binary code emphasizing business and data analytics concepts. Bar chart rising and falling, suitcase representing work or business, binary code symbolizing data or computing. Ideal for analytics, career growth, data trends, tech, finance, professional
Free with trial Smart data analysis icon. Elements of artifical in neon style icons. Simple icon for websites, web design, mobile app, info graphics on dark gradient background. Chart data code illustrations Smart data analysis icon. Elements of artifical in neon style icons. Simple icon for websites, web design, mobile app, info
Free with trial Big Data Visualization. Futuristic Science Finance Infographic Design. Complex Visual Data Background. Abstract Graph. Vector. Chart data code vectors Big Data Visualization. Futuristic Science Finance Infographic Design. Complex Visual Data Background. Abstract Graph
Free with trial Abstract 3D rendering satellites starlink network, digital earth data globe - connection the world. satellites create oneweb or skybridge surrounding planet conveying complexity big data flood the modern digital age,. Chart data code illustrations Abstract 3D rendering satellites starlink network, digital earth data globe - connection the world. satellites create
Free with trial Business analysis, software development, healthcare, injury recovery, technology integration, and data tracking. Bar chart and line graph, bandaged hand and code snippet. Business analysis. Chart data code illustrations Data Analytics, Injury Prevention, and Coding Concept with Chart, Bandaged Hand, and Code Snippet. Business analysis, software development, healthcare, injury recovery, technology integration, and data tracking. Bar chart and line graph, bandaged hand and code snippet. Business analysis
Free with trial Code, coding, compile, files, list Icon Over Various Background. glyph style design, designed for web and app. Eps 10 vector illustration. Vector EPS10 Abstract Template background. Chart data code vectors Code, coding, compile, files, list Icon Over Various Background. glyph style design, designed for web and app. Eps 10 vector
Free with trial Big data blue wave visualization. Futuristic infographic. Information aesthetic design. Visual data complexity. Complex business chart analytics. Social network representation. Abstract data graph. Chart data code vectors Big data blue wave visualization. Futuristic infographic. Information aesthetic design. Visual data complexity. Complex