Free with trial Colorful flat design depicts bull and bear market fluctuation. Rising and falling arrows symbolize investment direction with a simple yet informative design. Chart decrease icon vectors Bull and Bear Market Illustration with Price Fluctuation Indicators on Black Background. Colorful flat design depicts bull and bear market fluctuation. Rising and falling arrows symbolize investment direction with a simple yet informative design.
Free with trial Lower price. Text effect design with modern colors and 3D font look. Chart decrease icon vectors Lower price. Text effect with modern colors and 3D font look
Free with trial Featuring four vibrant business charts illustrating increasing, decreasing, fluctuating, and peaking trends, perfect for enhancing presentations and reports with clear visual data analysis. Chart decrease icon vectors Featuring four vibrant business charts illustrating increasing, decreasing, fluctuating, and peaking trends, perfect for
Free with trial This is an detailed set of clean line icons for infographic design, corporate data analysis, and finance. Chart decrease icon vectors Clean infographic symbols for corporate data analysis and financial tracking applications. This is an detailed set of clean line icons for infographic design, corporate data analysis, and finance
Free with trial This is an detailed series of analytical icons for data visualization and statistical reporting in a clean line style. Chart decrease icon vectors Comprehensive analytical data and statistics symbols for corporate business presentations. This is an detailed series of analytical icons for data visualization and statistical reporting in a clean line style
Free with trial Illustration of a stock market crash concept. A red arrow points down across gray steps, symbolizing financial decline and economic recession. Visualizes business and investment risks. 200. Chart decrease icon illustrations Stock market crash concept illustration with red arrow pointing down on gray steps rendering. Illustration of a stock market crash concept. A red arrow points down across gray steps, symbolizing financial decline and economic recession. Visualizes business and investment risks. 200
Free with trial A set of nine minimalist vector icons depicting various types of charts and graphs including bar charts, progress bars, and trend lines for data visualization and analytics. Chart decrease icon vectors Collection of simple black glyph icons representing business charts graphs and data analysis. A set of nine minimalist vector icons depicting various types of charts and graphs including bar charts, progress bars, and trend lines for data visualization and analytics
Free with trial Flat vector design showcasing a downward trending graph with a distinct red arrow. Represents market decline and financial challenges against a stark black background. Chart decrease icon vectors Downward Graph with Arrow: A Visual Representation of Market Downturn and Financial Loss. Flat vector design showcasing a downward trending graph with a distinct red arrow. Represents market decline and financial challenges against a stark black background.
Free with trial Concept of volatile market with one stack of coins growing and another one decreasing. Chart decrease icon illustrations Money stack growing while one is decreasing showing market volatility. Concept of volatile market with one stack of coins growing and another one decreasing
Free with trial Stacked cubes with red arrow down symbols showing step by step decreasing trend and negative growth. Generative AI. Chart decrease icon illustrations Stacked cubes with red arrow down symbols showing step by step decreasing trend and negative growth
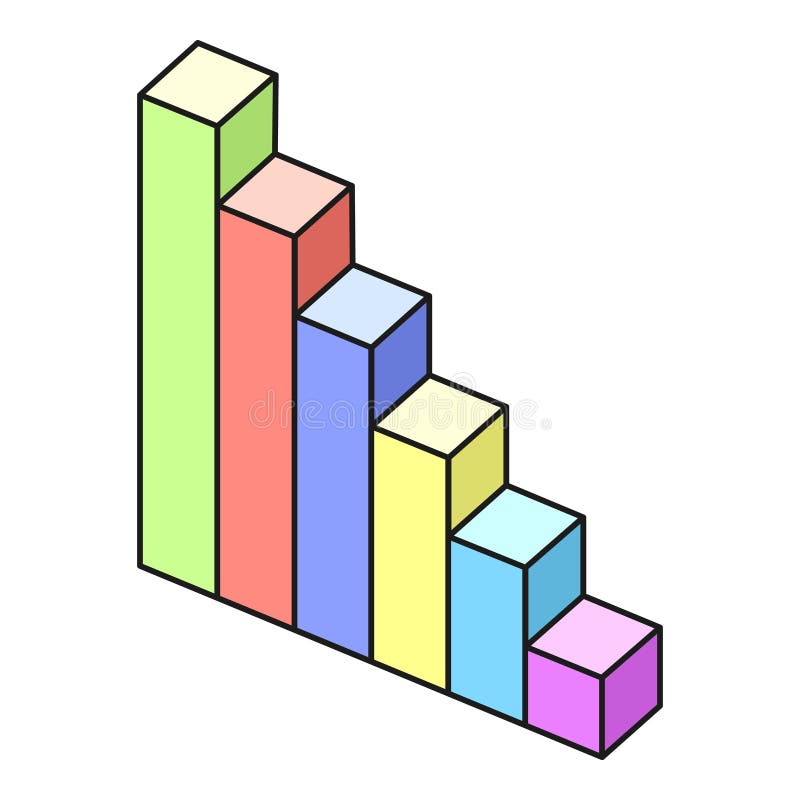
Free with trial This is a minimalist black and white line art graphic showing a series of six vertical rectangular frames that decrease in height from left to right, all connected by a single diagonal line running across the top, creating a staircase or descending trend visualization. Chart decrease icon vectors A minimalist graphic design element featuring a series of descending rectangular shapes in a line. This is a minimalist black and white line art graphic showing a series of six vertical rectangular frames that decrease in height from left to right, all connected by a single diagonal line running across the top, creating a staircase or descending trend visualization
Free with trial Stylized flat vector graph displaying a downward trend with percentage symbols; composed against a stark black background for emphasis. Chart decrease icon vectors Downward Trend Graph Illustration Showing Declining Percentage Values on Black Backdrop. Stylized flat vector graph displaying a downward trend with percentage symbols; composed against a stark black background for emphasis.
Free with trial A flat illustration presents a declining graph paired with a dollar coin, symbolizing financial loss and economic downturn with clean lines and colors. Chart decrease icon vectors Financial Loss Concept: Graph Depicting Decline with a Dollar Coin, Economy and Investment. A flat illustration presents a declining graph paired with a dollar coin, symbolizing financial loss and economic downturn with clean lines and colors.
Free with trial A flat style illustration of market trend with upward and downward arrows and wavy lines against black background. Chart decrease icon vectors Stock market trend illustration showing upward and downward direction in financial trading. A flat style illustration of market trend with upward and downward arrows and wavy lines against black background.
Free with trial Hand Drawn Smartphone Screen Displaying Financial Decline Graph Arrow Business Downturn Loss Concept. Chart decrease icon vectors Hand Drawn Smartphone Screen Displaying Financial Decline Graph Arrow Business Downturn Loss Concept
Free with trial Arrow 3d vector illustration. Web design elements, pointer or cursor sign, increase of decrease financial sign. Up and down forward arrow, motion and navigation symbol. Chart decrease icon vectors Arrow navigation pointer, forward upward. Arrow 3d vector illustration. Web design elements, pointer or cursor sign, increase of decrease financial sign. Up and down forward arrow, motion and navigation symbol
Free with trial Colorful bar graph showing decreasing trend, perfect for illustrating negative growth or decline. Chart decrease icon illustrations Colorful bar graph showing decreasing trend over time. Colorful bar graph showing decreasing trend, perfect for illustrating negative growth or decline
Free with trial A collection of colorful isometric bar charts and line graphs are displayed on a white background, representing data visualization and analysis. Chart decrease icon illustrations Isometric colorful bar charts and line graphs displayed on a white background for data visualization. a collection of colorful isometric bar charts and line graphs are displayed on a white background, representing data visualization and analysis
Free with trial This image depicts a simple yet effective graphic representation of contrasting trends, featuring a green up arrow and a red down arrow accompanied by percentage signs. The visual metaphor is commonly used in financial and economic contexts to illustrate growth and decline, making it a versatile and recognizable symbol in business and market analysis. Chart decrease icon illustrations A graphic illustration of a green up arrow and a red down arrow with percentage signs, symbolizing growth and decline. This image depicts a simple yet effective graphic representation of contrasting trends, featuring a green up arrow and a red down arrow accompanied by percentage signs. The visual metaphor is commonly used in financial and economic contexts to illustrate growth and decline, making it a versatile and recognizable symbol in business and market analysis.
Free with trial A sharply declining red arrow against a grid evokes negative trends and downward movement overall. Chart decrease icon illustrations A sharply declining red arrow against a grid evokes negative trends and downward movement overall
Free with trial A compelling visual concept representing workplace safety and accident prevention, featuring wooden blocks with hard hat icons, a shield with a checkmark, and a graph showing decreasing accidents. This image highlights the crucial importance of occupational health and safety measures and effective risk management in professional environments. Chart decrease icon vectors Workplace Safety Accident Prevention Concept with Hard Hat Icons, Shield, and Decreasing Accidents Graph. A compelling visual concept representing workplace safety and accident prevention, featuring wooden blocks with hard hat icons, a shield with a checkmark, and a graph showing decreasing accidents. This image highlights the crucial importance of occupational health and safety measures and effective risk management in professional environments.
Free with trial 3d isometric illustration of a blue line graph decreasing over grey bars, representing a negative trend. Chart decrease icon vectors Blue line decreasing over grey bars showing negative trend. 3d isometric illustration of a blue line graph decreasing over grey bars, representing a negative trend
Free with trial Computer screen displaying a red arrow trending down, representing economic decline. Chart decrease icon illustrations Computer showing red downward trend on blue background. Computer screen displaying a red arrow trending down, representing economic decline
Free with trial Line art business graphs set featuring financial growth and decline with dollar signs for economic performance. Chart decrease icon vectors Line art business graphs set featuring financial growth and decline with dollar signs for economic performance
Free with trial Abstract vector showing price decreasing and investment increasing, using blue lines and pink accents. Simple composition, balanced for illustrative purposes. Chart decrease icon vectors Abstract visual illustrating price reduction, investment, and financial dynamics on a black background. Abstract vector showing price decreasing and investment increasing, using blue lines and pink accents. Simple composition, balanced for illustrative purposes.
Free with trial Hand drawn line art illustration of financial analysis depicting growth and market trends for business strategy. Chart decrease icon vectors Hand drawn line art illustration of financial analysis depicting growth and market trends for business strategy
Free with trial Stylized vector graphic featuring an upward arrow and percentage sign, connected by lines, demonstrating rising performance and decreasing rates against a dark background. Chart decrease icon vectors Rising Performance and Decreasing Costs: Stylized Arrow and Percentage Icons Illustrating Financial Trends. Stylized vector graphic featuring an upward arrow and percentage sign, connected by lines, demonstrating rising performance and decreasing rates against a dark background.
Free with trial Set of chart icons with dollar sign in even silhouette on a white background. The graph shows downward and upward trends. Vector. Chart decrease icon vectors Set of graphic icons with dollar. Set of chart icons with dollar sign in even silhouette on a white background. The graph shows downward and upward trends. Vector
Free with trial Weather thermometer cold climate temperature reading decrease symbol freezing frost, outdoor,. Chart decrease icon vectors Red and white thermometer with blue downward arrow showing low temperature for cold weather or freezing point. Weather thermometer cold climate temperature reading decrease symbol freezing frost, outdoor,
Free with trial A hand with the index finger extended and a glowing blue light on the fingertip surrounded by various blue percentage symbols and arrows on a white background. Chart decrease icon illustrations A hand with a glowing blue light and percentage symbols floating around isolated on transparent background, isolated on white. a hand with the index finger extended and a glowing blue light on the fingertip surrounded by various blue percentage symbols and arrows on a white background
Free with trial Financial report with a declining bar graph, suggesting a negative trend in business performance. Chart decrease icon vectors Financial report showing declining bar graph and statistics. Financial report with a declining bar graph, suggesting a negative trend in business performance
Free with trial Green up and red down 3d arrow graph showing rising, descending trend, business result, profit or loss symbol symbol. Business arrow, goals concept. 3d world money symbols. Financial growth vector isolated. Chart decrease icon vectors Green up and red down 3d arrow graph showing rising, descending trend, business result, profit. world money symbols. Green up and red down 3d arrow graph showing rising, descending trend, business result, profit or loss symbol symbol. Business arrow, goals concept. 3d world money symbols. Financial growth vector isolated
Free with trial Green up and red down 3d arrow graph showing rising, descending trend, business result, profit or loss symbol symbol. Business arrow, goals concept. 3d world money symbols. Financial growth vector isolated. Chart decrease icon vectors Green up and red down 3d arrow graph showing rising, descending trend, business result, profit. world money symbols. Green up and red down 3d arrow graph showing rising, descending trend, business result, profit or loss symbol symbol. Business arrow, goals concept. 3d world money symbols. Financial growth vector isolated
Free with trial Set Global economic crisis, , Burning dollar bill and Drop crude oil price. Business infographic template. Vector. Chart decrease icon illustrations Set Global economic crisis, , Burning dollar bill and Drop crude oil price. Business infographic template. Vector
Free with trial Concept of currency devaluation, financial crisis and falling exchange rates. Chart decrease icon illustrations Dollar currency value going down with arrow and location pin. Concept of currency devaluation, financial crisis and falling exchange rates
Free with trial Money production system with a gear and dollar sign generating decreasing income streams represented by down arrows. Chart decrease icon vectors Money production system generating decreasing income streams. Money production system with a gear and dollar sign generating decreasing income streams represented by down arrows
Free with trial A 3D rendered yellow Bitcoin coin with the iconic 'B' symbol is centrally placed. To its left, a green circle with an upward arrow signifies growth, while to its right, a red circle with a downward arrow represents decline. These elements are presented on a clean white background, illustrating cryptocurrency market trends. Chart decrease icon illustrations 3D Rendered Bitcoin Symbol with Up and Down Arrows Indicating Cryptocurrency Market Trends on a White Background. A 3D rendered yellow Bitcoin coin with the iconic 'B' symbol is centrally placed. To its left, a green circle with an upward arrow signifies growth, while to its right, a red circle with a downward arrow represents decline. These elements are presented on a clean white background, illustrating cryptocurrency market trends
Free with trial Marketing campaign failing despite positive feedback, represented by a graph. Chart decrease icon illustrations Social media marketing campaign failing with negative trend graph. Marketing campaign failing despite positive feedback, represented by a graph
Free with trial Three pink dollar signs are shown on a pink background. The dollar signs are positioned in a row, with the middle one slightly higher than the other two. Chart decrease icon illustrations Three pink dollar signs are shown on a pink background
Free with trial Colorful vector illustration in flat design of three melting bars, simulating a declining graph. Chart decrease icon illustrations Flat design illustration of melting bars graph. Colorful vector illustration in flat design of three melting bars, simulating a declining graph
Free with trial Black percentage symbol enclosed in a speech bubble, surrounded by financial symbols representing interest rates, investments, sales, and discounts. Chart decrease icon vectors Black percent symbol inside a speech bubble surrounded by financial icons visualizing interest rates, investments, sales, and. Black percentage symbol enclosed in a speech bubble, surrounded by financial symbols representing interest rates, investments, sales, and discounts
Free with trial Concept of economic crash with connected icons. Chart decrease icon illustrations Concept of economic crash
Free with trial Simple graphic illustration of a dollar coin and financial arrows depicting market fluctuations for business and finance concepts. Chart decrease icon vectors Simple graphic illustration of a dollar coin and financial arrows depicting market fluctuations for business and finance concepts
Free with trial 100 coin icons set. Color line set of coin vector icons thin line color flat on white. Chart decrease icon illustrations 100 coin icons set, color line style. 100 coin icons set. Color line set of coin vector icons thin line color flat on white
Free with trial Currency exchange rate is fluctuating showing dollar gaining value while euro is decreasing. Chart decrease icon vectors Dollar growing while euro is decreasing showing currency exchange rate. Currency exchange rate is fluctuating showing dollar gaining value while euro is decreasing
Free with trial Green arrows pointing up and down. Illustrative design shows direction choice. Concept for website user interface button, or for business graphic. Chart decrease icon illustrations Green arrows pointing up and down. Illustrative design shows direction choice. Concept for website user interface button or for
Free with trial The concept of opportunities in the production process. Business people use their fingertips to touch arrows to improve logistics systems, smooth operations, reduce costs, and eliminate pressure. Chart decrease icon illustrations The concept of opportunities in the production process. Business people use their fingertips to touch arrows to improve logistics
Free with trial Business graph icon. Flat design. Vector illustration, EPS 10. Chart decrease icon vectors Recession statistics financial failure concept. Business graph icon. Flat design. Vector illustration, EPS 10.
Free with trial Line drawing of a flipchart showing a graph with a downward arrow representing economic downturn. Chart decrease icon vectors Flipchart showing arrow graph going down representing financial crisis. Line drawing of a flipchart showing a graph with a downward arrow representing economic downturn
Free with trial Red arrow pointing down with stacks of gold coins. Represents financial market decline, economic recession, and investment loss. Business downturn and decreasing profits. Chart decrease icon illustrations Red arrow pointing down with stacks of gold coins financial market decline recession. Red arrow pointing down with stacks of gold coins. Represents financial market decline, economic recession, and investment loss. Business downturn and decreasing profits
Free with trial Lower price. Text effect design with modern colors and 3D font look. Chart decrease icon vectors Lower price. Text effect with modern colors and 3D font look
Free with trial Lower price. Text effect design with modern colors and 3D font look. Chart decrease icon vectors Lower price. Text effect with modern colors and 3D font look
Free with trial Lower price. Text effect design with modern colors and 3D font look. Chart decrease icon illustrations Lower price. Text effect with modern colors and 3D font look
Free with trial Curved red down arrow and green up arrow icons for visualizing growth, decline, trends, performance metrics, charts, and financial data. Chart decrease icon vectors Curved red down and green up arrows for growth and decline indicators. Curved red down arrow and green up arrow icons for visualizing growth, decline, trends, performance metrics, charts, and financial data
Free with trial Colorful bar charts illustrating positive and negative business trends from january to may provide a clear visual representation of performance. Chart decrease icon vectors Colorful bar charts illustrating positive and negative business trends from january to may provide a clear visual
Free with trial A laconic, simple infographic showing the fall of the Ethereum on the stock exchange. Chart decrease icon illustrations Abstract infographic of falling Ethereum exchange rate. A laconic, simple infographic showing the fall of the Ethereum on the stock exchange.
Free with trial Colorful bar charts illustrating positive and negative business trends from january to may provide a clear visual representation of performance. Chart decrease icon illustrations Colorful bar charts illustrating positive and negative business trends from january to may provide a clear visual
Free with trial Vector illustration stacked coins and arrow trending down, decreasing statistical graphic concept. Chart decrease icon vectors Vector illustration stack coin arrow downup trend. vector illustration stacked coins and arrow trending down, decreasing statistical graphic concept
Free with trial Set line Drop in crude oil price, Tearing money banknote, Global economic crisis and Money bag. Business infographic template. Vector. Chart decrease icon vectors Set line Drop in crude oil price, Tearing money banknote, Global economic crisis and Money bag. Business infographic
Free with trial Thin line gear with graph like crisis management. concept of key performance indicator or bad strategy. linear simple trend modern outline stats logotype graphic design web element isolated on white. Chart decrease icon vectors Thin line gear with graph like crisis management
Free with trial Featuring four vibrant business charts illustrating increasing, decreasing, fluctuating, and peaking trends, perfect for enhancing presentations and reports with clear visual data analysis. Chart decrease icon illustrations Featuring four vibrant business charts illustrating increasing, decreasing, fluctuating, and peaking trends, perfect for
Free with trial A simple infographic that schematically depicts the dynamics of the decline in offshore oil production. Vector illustration. Chart decrease icon vectors The dynamics of the decline in offshore oil production in laconic infographics. A simple infographic that schematically depicts the dynamics of the decline in offshore oil production. Vector illustration.
Free with trial A simple infographic that schematically depicts the dynamics of the decline in offshore oil production. Vector illustration. Chart decrease icon illustrations The dynamics of the decline in offshore oil production in laconic infographics. A simple infographic that schematically depicts the dynamics of the decline in offshore oil production. Vector illustration.
Free with trial Red 3D Percentage Symbol With Arrow Pointing Down. Price reduction percentage sign in red. Vector Illustrator. Chart decrease icon vectors Red 3D Percentage Symbol With Arrow Pointing Down. Vector Illustrator. Red 3D Percentage Symbol With Arrow Pointing Down. Price reduction percentage sign in red. Vector Illustrator.
Free with trial A simple infographic that schematically depicts the dynamics of the decline in oil production in the world. Vector illustration. Chart decrease icon illustrations The dynamics of the decline in oil production in laconic infographics. A simple infographic that schematically depicts the dynamics of the decline in oil production in the world. Vector illustration.
Free with trial Clean and simple abstract infographic about decreasing supply of natural gas. Vector illustration. Chart decrease icon vectors A simple infographic about declining natural gas supply. Clean and simple abstract infographic about decreasing supply of natural gas. Vector illustration.
Free with trial A simple infographic depicting the decline in demand for natural gas. Vector illustration. Chart decrease icon illustrations Abstract infographic of decreasing demand for natural gas. A simple infographic depicting the decline in demand for natural gas. Vector illustration.
Free with trial A simple infographic depicting the decline in demand for natural gas. Vector illustration. Chart decrease icon vectors Abstract infographic of decreasing demand for natural gas. A simple infographic depicting the decline in demand for natural gas. Vector illustration.
Free with trial Clean and simple abstract infographic about falling prices in the oil industry. Vector illustration. Chart decrease icon illustrations A simple infographic about falling oil industry prices. Clean and simple abstract infographic about falling prices in the oil industry. Vector illustration.
Free with trial Oil pump recession economic crisis falling graph coins mobile app screen template pastel background Vector illustration. Chart decrease icon vectors Oil pump recession economic crisis falling graph coins mobile app screen template pastel background
Free with trial Oil pump recession economic crisis falling graph coins mobile app screen template pastel background Vector illustration. Chart decrease icon vectors Oil pump recession economic crisis falling graph coins mobile app screen template pastel background
Free with trial The decline in the bar graph is due to the stock market falling, economic crash, investing failure or mistake, price drop, recession, investment risk concept, stock price decline concept flat design. Chart decrease icon vectors The decline in the bar graph is due to the stock market falling, economic crash, investing failure or mistake, , price drop. The decline in the bar graph is due to the stock market falling, economic crash, investing failure or mistake, price drop, recession, investment risk concept, stock price decline concept flat design
Free with trial 3D Isometric Flat Vector Illustration of Global Crisis, Red Arrow Symbolizing Rapid Economic Decline. Chart decrease icon vectors 3D Isometric Flat Vector Illustration of Global Crisis
Free with trial The percentage sign in 3D style lights up or takes off. Percentage, discount, sale, promotion concept. Vector illustration. Chart decrease icon vectors The percentage sign in 3D style lights up or takes off. Percentage, discount, sale, promotion concept.
Free with trial Multicolored graph trending downward icon. Chart decrease icon illustrations Wfh140125. Multicolored graph trending downward icon
Free with trial 3D Isometric Flat Vector Illustration of Interest Rate Fall, Economic Downturn, Impact Of Falling Inflation, and Stock Market Value Loss. Chart decrease icon vectors 3D Isometric Flat Vector Illustration of Interest Rate Fall
Free with trial Vector 3D illustration of green arrow falling down. Decline graph. For diagrams and infographics. Business achievements. Isolated background. Render. Minimalism. Cursor. Chart decrease icon vectors Vector 3D illustration of green arrow falling down.
Free with trial 3D Isometric Flat Vector Illustration of Challenge Overcoming, Confident Investor Jumps From Red Arrow To Green For Growth Opportunity. Chart decrease icon vectors 3D Isometric Flat Vector Illustration of Challenge Overcoming
Free with trial Continuous one line art arrow up and down shape isolated vector illustration on white background. Chart decrease icon vectors Continuous one line art arrow up and down shape isolated