Free with trial A black icon of a line graph showing a downward trend on a white background. Clear details and vibrant colors. Clear decrease illustrations Black icon of a downward trending graph on white background chart decline. A black icon of a line graph showing a downward trend on a white background. Clear details and vibrant colors
Free with trial A crisp vector illustration of an orange downward trending line graph, signifying a fall, loss, or negative economic movement. This versatile icon is perfect for financial dashboards, business analysis, or reporting on declining statistics. Its clear visual representation quickly conveys a reduction in values, making it highly effective, vector design Generative AI. Clear decrease vectors Orange Downward Trending Financial Graph, vector design Generative AI. A crisp vector illustration of an orange downward trending line graph, signifying a fall, loss, or negative economic movement. This versatile icon is perfect for financial dashboards, business analysis, or reporting on declining statistics. Its clear visual representation quickly conveys a reduction in values, making it highly effective, vector design Generative AI
Free with trial Visualize financial decline with this striking depiction of a report showing falling tax revenue and a clear downward trend, perfect for economic analysis and business strategy content. Clear decrease vectors Business financial report shows declining tax revenue with downward trend arrow. Visualize financial decline with this striking depiction of a report showing falling tax revenue and a clear downward trend, perfect for economic analysis and business strategy content
Free with trial Black icon of a bar graph with a downward arrow on a computer monitor screen. Clear details and vibrant colors. Clear decrease illustrations Black icon of bar graph with downward arrow on a computer monitor chart data. Black icon of a bar graph with a downward arrow on a computer monitor screen. Clear details and vibrant colors
Free with trial A black line graph with an arrow points downward indicating revenue slowdown. Clear details and vibrant colors. Clear decrease illustrations Black arrow graph showing revenue slowdown on white background chart decline. A black line graph with an arrow points downward indicating revenue slowdown. Clear details and vibrant colors
Free with trial Black icon of stairs with an arrow pointing downwards on a white background Clear details and vibrant colors e. Clear decrease illustrations Black stairs icon with arrow pointing down on white background steps downward. Black icon of stairs with an arrow pointing downwards on a white background Clear details and vibrant colors e
Free with trial This candlestick chart displays the price movements of a stock over a period. The green and red bars represent price changes, with green indicating an increase and red indicating a decrease. The chart shows a clear upward trend, suggesting a bullish market sentiment. The x-axis represents time, while the y-axis represents the stock price. Clear decrease illustrations Candlestick chart showing a significant upward trend in stock prices over time. This candlestick chart displays the price movements of a stock over a period. The green and red bars represent price changes, with green indicating an increase and red indicating a decrease. The chart shows a clear upward trend, suggesting a bullish market sentiment. The x-axis represents time, while the y-axis represents the stock price
Free with trial Colorful plastic arrows and bars depict market trends showing a clear decline in data. Clear decrease illustrations Colorful plastic arrows and bars depict market trends showing a clear decline in data
Free with trial A straightforward vector icon of a magnifying glass with a minus sign, designed for zoom out or decrease actions. Its clean, simple aesthetic ensures immediate comprehension and seamless integration into various digital interfaces, including software tools and mobile applications. Essential UI element, vector design Generative AI. Clear decrease vectors Minimalist Zoom Out Icon for Clear User Control, vector design Generative AI. A straightforward vector icon of a magnifying glass with a minus sign, designed for zoom out or decrease actions. Its clean, simple aesthetic ensures immediate comprehension and seamless integration into various digital interfaces, including software tools and mobile applications. Essential UI element, vector design Generative AI
Free with trial A black line graph with a zigzag pattern trending downwards with an arrow. Clear details and vibrant colors en. Clear decrease illustrations Black downward trending line graph with arrow on white background chart decline. A black line graph with a zigzag pattern trending downwards with an arrow. Clear details and vibrant colors en
Free with trial Black icon showing a downward trend with a curved arrow connecting two bars Clear details and vibrant colors e. Clear decrease illustrations Black icon representing a downward trend with a curved arrow and two bars decline. Black icon showing a downward trend with a curved arrow connecting two bars Clear details and vibrant colors e
Free with trial A black downward trending arrow with a jagged line graph on a white background. Clear details and vibrant colo. Clear decrease illustrations Black downward trending arrow with jagged line graph on white background decline. A black downward trending arrow with a jagged line graph on a white background. Clear details and vibrant colo
Free with trial Black graphic of piano keys with a sound wave and text Weak Volume Signal Clear details and vibrant colors enh. Clear decrease illustrations Black piano keys graphic with sound wave and text Weak Volume Signal audio music. Black graphic of piano keys with a sound wave and text Weak Volume Signal Clear details and vibrant colors enh
Free with trial A black bar graph showing a downward trend with an arrow pointing down. Clear details and vibrant colors enhan. Clear decrease illustrations Black bar graph with a downward trending arrow on white background chart decline. A black bar graph showing a downward trend with an arrow pointing down. Clear details and vibrant colors enhan
Free with trial A black downward trending graph inside a warning triangle on a white background Clear details and vibrant colo. Clear decrease illustrations Black downward trending graph inside a warning triangle on white background chart. A black downward trending graph inside a warning triangle on a white background Clear details and vibrant colo
Free with trial Black line graph icon with data points showing fluctuations on a white background Clear details and vibrant co. Clear decrease illustrations Black line graph icon showing fluctuating data points on a white background chart. Black line graph icon with data points showing fluctuations on a white background Clear details and vibrant co
Free with trial A black bar graph illustrates margin compression with text on a white background. Clear details and vibrant co. Clear decrease illustrations Black bar graph with MARGINCOMPRESION text on white background margin compression. A black bar graph illustrates margin compression with text on a white background. Clear details and vibrant co
Free with trial Black candlestick chart with downward trend and arrow on white. Clear details and vibrant colors enhance visua. Clear decrease illustrations Black candlestick chart with downward trend and arrow on white stock market trading. Black candlestick chart with downward trend and arrow on white. Clear details and vibrant colors enhance visua
Free with trial Black icon showing a declining graph with a falling arrow and ice cube. Clear details and vibrant colors enhan. Clear decrease illustrations Black icon of a downward trending graph with a falling arrow and ice cube chart decline. Black icon showing a declining graph with a falling arrow and ice cube. Clear details and vibrant colors enhan
Free with trial A black outline arrow icon curving downwards on a white background. Clear details and vibrant colors enhance v. Clear decrease illustrations Black outline arrow icon curving downwards on white background Keywords: arrow, down, downward. A black outline arrow icon curving downwards on a white background. Clear details and vibrant colors enhance v
Free with trial Black line graph showing a downward trend with an arrow on a white background Clear details and vibrant colors. Clear decrease illustrations Black line graph showing a downward trend with arrow on white background Keywords: graph, chart. Black line graph showing a downward trend with an arrow on a white background Clear details and vibrant colors
Free with trial This 3D illustration features a downward arrow with a dollar sign, symbolizing financial decline or decrease. The image is set against a transparent background, making it versatile for various design projects. The clean, modern design is perfect for presentations, websites, or any visual content requiring a clear, impactful symbol of economic trends. Clear decrease vectors A 3d illustration of a downward arrow with a dollar sign, isolated on transparent background. This 3D illustration features a downward arrow with a dollar sign, symbolizing financial decline or decrease. The image is set against a transparent background, making it versatile for various design projects. The clean, modern design is perfect for presentations, websites, or any visual content requiring a clear, impactful symbol of economic trends.
Free with trial A polished vector illustration of a magnifying glass with a minus symbol, signifying a zoom out or reduce function. This clear icon is ideal for user interfaces, map applications, or tools where decreasing detail or scale is needed for navigation, vector design Generative AI. Clear decrease vectors Magnifying Glass with Minus Icon for Zoom Out or Reduce Feature, vector design Generative AI. A polished vector illustration of a magnifying glass with a minus symbol, signifying a zoom out or reduce function. This clear icon is ideal for user interfaces, map applications, or tools where decreasing detail or scale is needed for navigation, vector design Generative AI
Free with trial This image depicts a circular gauge showing a sixty percent reduction, indicated by the minus sixty percent symbol. Such visuals are often used in data analytics, financial reports, or performance tracking to illustrate declines in metrics like sales, resources, or efficiency. The gauge design emphasizes the negative change, making it clear and visually impactful for quick interpretation by. Clear decrease illustrations Understanding the representation of a sixty percent decrease in a visual gauge or progress indicator. This image depicts a circular gauge showing a sixty percent reduction, indicated by the minus sixty percent symbol. Such visuals are often used in data analytics, financial reports, or performance tracking to illustrate declines in metrics like sales, resources, or efficiency. The gauge design emphasizes the negative change, making it clear and visually impactful for quick interpretation by
Free with trial Neon pink percent sign symbol illuminated with bright light. Three-dimensional object in clear acrylic casing. Abstract concept for business, finance, sales, discounts. Great for. Clear decrease illustrations Neon pink percent sign symbol illuminated with bright light. Three-dimensional object in clear acrylic casing. Abstract concept
Free with trial A modern data visualization featuring a line graph and bar chart, ideal for illustrating business trends and performance metrics in reports and presentations. Clear decrease illustrations Data visualization with a line graph and bar chart representing trends and comparisons in a clear and modern style for business. A modern data visualization featuring a line graph and bar chart, ideal for illustrating business trends and performance metrics in reports and presentations
Free with trial Colorful bar charts illustrating positive and negative business trends from january to may provide a clear visual representation of performance. Clear decrease vectors Colorful bar charts illustrating positive and negative business trends from january to may provide a clear visual
Free with trial Simple, black, hand drawn arrow curving down and to the left, isolated on a white background, providing clear direction and visual guidance. Clear decrease vectors Simple, black, hand drawn arrow curving down and to the left, isolated on a white background, providing clear direction
Free with trial Simple, black, hand drawn arrow curving down and to the left, isolated on a white background, providing clear direction and visual guidance. Clear decrease vectors Simple, black, hand drawn arrow curving down and to the left, isolated on a white background, providing clear direction
Free with trial Colorful bar charts illustrating positive and negative business trends from january to may provide a clear visual representation of performance. Clear decrease illustrations Colorful bar charts illustrating positive and negative business trends from january to may provide a clear visual
Free with trial This vibrant line graph showcases multiple data series, illustrating trends and fluctuations over time with a clear light grid background, perfect for reports. Clear decrease illustrations Colorful Line Graph Representing Data Trends Over Time with Multiple Data Series and Fluctuating Values on a Light Grid Background. This vibrant line graph showcases multiple data series, illustrating trends and fluctuations over time with a clear light grid background, perfect for reports
Free with trial The "low sound speaker" or "volume minus" icon typically features a speaker symbol accompanied by a small dash or minus sign, visually indicating a decrease in audio output. This icon is commonly used across digital interfaces�such as media players, smartphones, and computer systems�to signal reduced sound levels or a muted state. Its minimal design provides a clear and intuitive way for users to manage audio settings, ensuring a seamless user experience. Clear decrease illustrations Low Volume or Mute Speaker Icon. The "low sound speaker" or "volume minus" icon typically features a speaker symbol accompanied by a small dash or minus sign, visually indicating a decrease in audio output. This icon is commonly used across digital interfaces�such as media players, smartphones, and computer systems�to signal reduced sound levels or a muted state. Its minimal design provides a clear and intuitive way for users to manage audio settings, ensuring a seamless user experience.
Free with trial Modern office buildings with large red downward arrows on their facades. Clear sky background. Concept of economic recession. 3D Rendering. Clear decrease illustrations Office buildings with downward arrows symbolizing decline. 3D Rendering. Modern office buildings with large red downward arrows on their facades. Clear sky background. Concept of economic recession. 3D Rendering
Free with trial A line graph with a decreasing trend is commonly used to depict scenarios like declining sales, decreasing stock prices, or any situation where a decrease in values over time or across categories is a significant aspect of the data. It provides a clear and intuitive way to understand trends and make informed interpretations about the decreasing values being represented. Clear decrease illustrations Chart with decreasing line graph. A line graph with a decreasing trend is commonly used to depict scenarios like declining sales, decreasing stock prices, or any situation where a decrease in values over time or across categories is a significant aspect of the data. It provides a clear and intuitive way to understand trends and make informed interpretations about the decreasing values being represented.
Free with trial Black and white icon depicting a downward arrow and a dollar symbol inside a speech bubble, positioned above an oil barrel with a droplet symbol. The design conveys a decrease in oil prices, using simple, bold lines for clear interpretation. Clear decrease vectors World Crude Oil Prices Down. Black and white icon depicting a downward arrow and a dollar symbol inside a speech bubble, positioned above an oil barrel with a droplet symbol. The design conveys a decrease in oil prices, using simple, bold lines for clear interpretation.
Free with trial A simple and clear line icon representing the action of turning the volume down. Clear decrease vectors Minimalist Volume Down Line Icon. A simple and clear line icon representing the action of turning the volume down
Free with trial This image shows a whiteboard displaying a bar graph with a downward trend, generated by AI. The graph illustrates a clear decline in performance over time, potentially indicating financial losses or market setbacks. The simple, clean presentation highlights the severity of the decrease. Clear decrease illustrations Declining Business Graph. This image shows a whiteboard displaying a bar graph with a downward trend, generated by AI. The graph illustrates a clear decline in performance over time, potentially indicating financial losses or market setbacks. The simple, clean presentation highlights the severity of the decrease.
Free with trial A bar chart representing a sharp decline makes a dramatic splash in clear water. This conceptual image visualizes a financial crisis, liquidity problems, or the impactful consequences of negative data and market failure. Clear decrease illustrations Economic Downturn Graph Splashing Down. A bar chart representing a sharp decline makes a dramatic splash in clear water. This conceptual image visualizes a financial crisis, liquidity problems, or the impactful consequences of negative data and market failure
Free with trial A visual representation of diminishing returns, where solid gold bars of success and profit gradually transition into clear, fragile glass. Clear decrease illustrations From Gold to Glass A Declining Bar Graph. A visual representation of diminishing returns, where solid gold bars of success and profit gradually transition into clear, fragile glass
Free with trial A clear visual representation of decision-making. An orange 'plus' block stands for positive choices and growth, while two 'minus' blocks below represent subtractions or disadvantages. Clear decrease vectors Simple Plus and Minus Button Illustration. A clear visual representation of decision-making. An orange 'plus' block stands for positive choices and growth, while two 'minus' blocks below represent subtractions or disadvantages
Free with trial A bold and clear flat design icon featuring a minus symbol within a red circle. This versatile graphic represents concepts of removal, prohibition, or access denied. Clear decrease vectors Red Minus Sign Prohibition and Removal Icon. A bold and clear flat design icon featuring a minus symbol within a red circle. This versatile graphic represents concepts of removal, prohibition, or access denied
Free with trial This minimalist vector illustration features two identical line graphs, presented in contrasting black and white themes. The left graph displays a black line on a white background, while the right shows a white line on a black background. Both graphs depict a clear downward trend with jagged fluctuations, symbolizing decline, loss, or negative growth over time. This versatile icon set is ideal for illustrating concepts such as economic downturns, financial losses, market crashes, business failures, or any data showing a significant decrease. Perfect for presentations, reports, infographics, and web design. Clear decrease vectors Declining Line Graph Icon Set - Black and White. This minimalist vector illustration features two identical line graphs, presented in contrasting black and white themes. The left graph displays a black line on a white background, while the right shows a white line on a black background. Both graphs depict a clear downward trend with jagged fluctuations, symbolizing decline, loss, or negative growth over time. This versatile icon set is ideal for illustrating concepts such as economic downturns, financial losses, market crashes, business failures, or any data showing a significant decrease. Perfect for presentations, reports, infographics, and web design.
Free with trial A clean, minimalist bar chart illustration set against a solid green background. The chart features three white vertical bars of different heights, representing data points or progress over time. A simple white grid and axes are visible, indicating a clear visual representation of statistics. This versatile graphic is ideal for conveying concepts of business growth, financial analysis, market trends, statistical reporting, or educational content in a modern, easy-to-understand format. Perfect for presentations, infographics, websites, and applications. Clear decrease vectors Minimalist Bar Chart Icon on Green Background. A clean, minimalist bar chart illustration set against a solid green background. The chart features three white vertical bars of different heights, representing data points or progress over time. A simple white grid and axes are visible, indicating a clear visual representation of statistics. This versatile graphic is ideal for conveying concepts of business growth, financial analysis, market trends, statistical reporting, or educational content in a modern, easy-to-understand format. Perfect for presentations, infographics, websites, and applications.
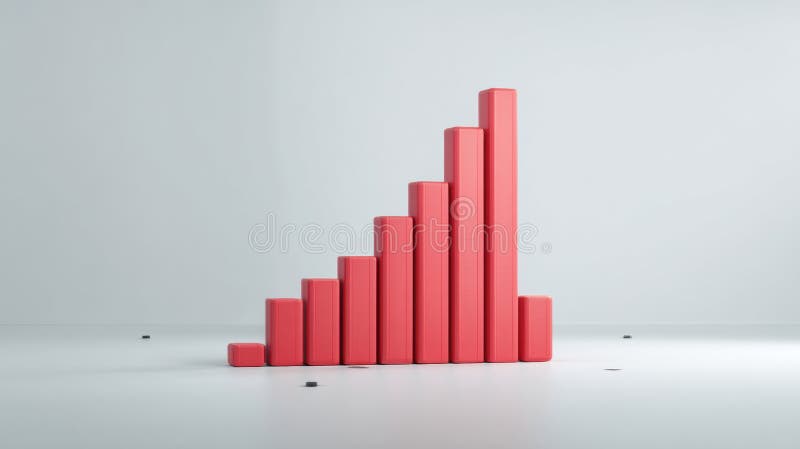
Free with trial This 3D rendered bar graph, generated by AI, visually represents a downward trend. The red bars progressively decrease in height, illustrating a clear decline. Perfect for illustrating concepts related to loss, decrease, or decline in presentations and reports. Clear decrease illustrations Declining Bar Graph. This 3D rendered bar graph, generated by AI, visually represents a downward trend. The red bars progressively decrease in height, illustrating a clear decline. Perfect for illustrating concepts related to loss, decrease, or decline in presentations and reports.
Free with trial A clean, minimalist vector illustration of a downward-pointing arrow in a soft blue color. This simple icon is versatile for signifying downloads, decreases, or navigation cues in user interfaces, offering clear and unobtrusive direction, vector design Generative AI. Clear decrease vectors Minimalist Blue Downward Arrow Icon, vector design Generative AI. A clean, minimalist vector illustration of a downward-pointing arrow in a soft blue color. This simple icon is versatile for signifying downloads, decreases, or navigation cues in user interfaces, offering clear and unobtrusive direction, vector design Generative AI
Free with trial A clear and simple vector icon showing a shopping bag with a prominent minus sign. Clear decrease vectors Remove from Cart Icon on Shopping Bag. A clear and simple vector icon showing a shopping bag with a prominent minus sign
Free with trial A bright red arrow points directly downwards towards a single gold coin embossed with a dollar sign. The coin is depicted as a shiny, metallic disc. Both the arrow and the coin are rendered in 3D and are presented on a clean white background, creating a clear visual representation of a financial decrease or cost reduction. Clear decrease illustrations Red Downward Arrow Pointing Towards a Gold Dollar Coin on White Background money currency. A bright red arrow points directly downwards towards a single gold coin embossed with a dollar sign. The coin is depicted as a shiny, metallic disc. Both the arrow and the coin are rendered in 3D and are presented on a clean white background, creating a clear visual representation of a financial decrease or cost reduction
Free with trial Stock market showing closeup of stock market display with green and red percentage changes and arrows. resolution use. Clear details and vibrant colors enhance visual appeal. stock market, financial data, percentage changes. Clear decrease illustrations Closeup of stock market display with green and red percentage changes and arrows
Free with trial Vector illustration shows a black outlined downward arrow with percentage symbol inside, representing decrease and reduction concept. Clear and minimal design mood. Generative AI. Clear decrease vectors Downward arrow with percentage symbol simple black outline vector illustration. Vector illustration shows a black outlined downward arrow with percentage symbol inside, representing decrease and reduction concept. Clear and minimal design mood. Generative AI
Free with trial A sharp red arrow, angled downwards, indicating a significant decrease or negative trend. Isolated on a clean white background for clear visualization of the concept. Clear decrease illustrations Red arrow pointing down isolated on white background. A sharp red arrow, angled downwards, indicating a significant decrease or negative trend. Isolated on a clean white background for clear visualization of the concept
Free with trial A simple, 3D rendered blue arrow points directly downwards against a stark white background. The arrow has rounded edges and a smooth finish, conveying a clear sense of direction or a decrease. The isolated graphic is ideal for representing negative trends, movement, or commands. Clear decrease illustrations Single Blue Downward Arrow Icon on White Background direction move. A simple, 3D rendered blue arrow points directly downwards against a stark white background. The arrow has rounded edges and a smooth finish, conveying a clear sense of direction or a decrease. The isolated graphic is ideal for representing negative trends, movement, or commands
Free with trial A minimalist graphic depicting a bar chart with falling bars and a downward-pointing arrow, symbolizing a negative trend, economic downturn, or performance decline. Clean and clear representation of loss. Clear decrease illustrations Simple downward trend bar chart icon indicating decline or decrease. A minimalist graphic depicting a bar chart with falling bars and a downward-pointing arrow, symbolizing a negative trend, economic downturn, or performance decline. Clean and clear representation of loss
Free with trial A whiteboard displays a hand-drawn graph showing a significant downward trend in stock prices. This visual representation of a market downturn was generated by AI and emphasizes the volatility and potential risks associated with stock market investments. The image is a clear, concise illustration o. Clear decrease illustrations AI-Generated Stock Market Decline. A whiteboard displays a hand-drawn graph showing a significant downward trend in stock prices. This visual representation of a market downturn was generated by AI and emphasizes the volatility and potential risks associated with stock market investments. The image is a clear, concise illustration o
Free with trial Two advanced wind turbines showcase a modern blade design against a bright blue sky, representing clean energy innovation and sustainability. Clear decrease illustrations Innovative Wind Turbines with Modern Blade Design Against a Clear Blue Sky. Two advanced wind turbines showcase a modern blade design against a bright blue sky, representing clean energy innovation and sustainability
Free with trial A clear magnifying glass icon with a circular cutout, symbolizing zoom out or broader view functionality. Ideal for image editors, map applications, or detailed document viewers. This intuitive design provides a universal cue for decreasing magnification, enhancing user navigation and content exploration in various digital interfaces, vector design Generative AI. Clear decrease vectors Zoom Out Magnifying Glass Icon for Broad View, vector design Generative AI. A clear magnifying glass icon with a circular cutout, symbolizing zoom out or broader view functionality. Ideal for image editors, map applications, or detailed document viewers. This intuitive design provides a universal cue for decreasing magnification, enhancing user navigation and content exploration in various digital interfaces, vector design Generative AI
Free with trial A prominent minus sign icon, symbolizing decreasing values, zoom out actions, or removal. Ideal for quantity selectors, audio volume controls, or mapping applications. This bold and clear design provides immediate visual feedback for reduction or negative adjustments, enhancing user control and simplifying interactive elements in digital interfaces, vector design Generative AI. Clear decrease vectors Large Minus Icon for Decreasing Value & Zoom Out, vector design Generative AI. A prominent minus sign icon, symbolizing decreasing values, zoom out actions, or removal. Ideal for quantity selectors, audio volume controls, or mapping applications. This bold and clear design provides immediate visual feedback for reduction or negative adjustments, enhancing user control and simplifying interactive elements in digital interfaces, vector design Generative AI
Free with trial A striking red arrow pointing downwards. Its glossy finish and distinct black outline give it a bold and clear visual presence, ideal for indicating direction or a downward trend. Clear decrease illustrations Bright red down arrow icon with glossy finish and black outline symbolizing direction white background. A striking red arrow pointing downwards. Its glossy finish and distinct black outline give it a bold and clear visual presence, ideal for indicating direction or a downward trend
Free with trial A simple and clear vector icon representing a downturn in the housing market. Clear decrease illustrations Real Estate Market Decline Vector Icon. A simple and clear vector icon representing a downturn in the housing market
Free with trial This compelling visual representation showcases a clear negative trend. A vibrant red downward arrow icon serves as a potent indicator of decline, positioned prominently against a pristine white background. The simple, yet impactful, chart surrounding the arrow depicts a consistently sloping downward line, visually reinforcing the concept of a fall or decrease in value. This graphic serves as a. Clear decrease illustrations Visualizing Declining Trends A Downward Arrow Chart Illustrates Negative Performance. This compelling visual representation showcases a clear negative trend. A vibrant red downward arrow icon serves as a potent indicator of decline, positioned prominently against a pristine white background. The simple, yet impactful, chart surrounding the arrow depicts a consistently sloping downward line, visually reinforcing the concept of a fall or decrease in value. This graphic serves as a
Free with trial A minimalist 3D white bar chart displays a clear downward trend. Four bars of decreasing height are shown, with a sharp white arrow pointing downwards from the top of the second bar, indicating a significant decline. The chart is presented in isolation against a clean white background, emphasizing the concept of financial or economic downturn. Clear decrease illustrations 3D White Bar Chart with a Downward Trending Arrow Symbolizing Decline graph decrease. A minimalist 3D white bar chart displays a clear downward trend. Four bars of decreasing height are shown, with a sharp white arrow pointing downwards from the top of the second bar, indicating a significant decline. The chart is presented in isolation against a clean white background, emphasizing the concept of financial or economic downturn
Free with trial A 3D bar chart with teal and tan bars shows a pink arrow pointing downwards, representing a decline or negative trend. Clear details and vibrant colors enhance visual appeal. Clear decrease illustrations 3D Bar Chart With Teal Bars And Pink Downward Arrow Indicating Decline graph decrease. A 3D bar chart with teal and tan bars shows a pink arrow pointing downwards, representing a decline or negative trend. Clear details and vibrant colors enhance visual appeal
Free with trial A vibrant red arrow points downward against a clean, solid-colored backdrop, symbolizing a decline or shift in focus. This visual representation effectively conveys motion and change. Clear decrease illustrations Red downward arrow on a solid background indicating a decrease or direction change in trends. A vibrant red arrow points downward against a clean, solid-colored backdrop, symbolizing a decline or shift in focus. This visual representation effectively conveys motion and change.
Free with trial A single, glossy green arrow points directly downwards. The arrow has a smooth, rounded appearance and a reflective surface, suggesting a 3D rendered object. It is presented in isolation on a clean white background, making it a clear and prominent visual element. This icon commonly represents a decrease, download, or negative direction. Clear decrease illustrations Glossy Green Downward Arrow Icon on a White Background image photo. A single, glossy green arrow points directly downwards. The arrow has a smooth, rounded appearance and a reflective surface, suggesting a 3D rendered object. It is presented in isolation on a clean white background, making it a clear and prominent visual element. This icon commonly represents a decrease, download, or negative direction
Free with trial A character stands isolated and holds a large red downward arrow, representing a decrease in values or metrics. Clear decrease illustrations Character Holding a Large Red Downward Arrow Symbolizing Decline on a White Background. A character stands isolated and holds a large red downward arrow, representing a decrease in values or metrics
Free with trial Descending Graph Depicts a Clear Downward Trend in Business Financial Analysis and Loss Indicating Recession. Clear decrease vectors Descending Graph Depicts a Clear Downward Trend in Business Financial Analysis and Loss Indicating Recession
Free with trial This high-quality vector graphic features a simple, hand-drawn red arrow pointing downwards. Perfect for presentations, websites, infographics, and any project requiring a clear and concise directional indicator. The minimalist design ensures versatility across various styles and applications. Download this easily scalable vector and enhance your designs with a clean and professional look. Ideal for illustrating decline, decrease, or a downward trend. This versatile asset is perfect for both digital and print use, offering high-resolution quality for crisp results. Clear decrease illustrations Hand-Drawn Red Down Arrow: Simple, Clean, and Versatile Vector Graphic for Presentations, Websites, and More! UI UX sign. This high-quality vector graphic features a simple, hand-drawn red arrow pointing downwards. Perfect for presentations, websites, infographics, and any project requiring a clear and concise directional indicator. The minimalist design ensures versatility across various styles and applications. Download this easily scalable vector and enhance your designs with a clean and professional look. Ideal for illustrating decline, decrease, or a downward trend. This versatile asset is perfect for both digital and print use, offering high-resolution quality for crisp results.
Free with trial Close-up view of a modern wind turbine against a clear blue sky, symbolizing renewable energy and sustainable development, Generative AI. Clear decrease illustrations Close-up view of a modern wind turbine against a clear blue sky, symbolizing renewable energy and sustainable development
Free with trial Thermometer line icon. Medical tool. Temperature indicator isolated on white background. Clear decrease vectors Thermometer line icon. Medical tool. Temperature indicator
Free with trial A minimalist, clean vector graphic featuring a downward-pointing triangle (arrow) enclosed within a thick, rounded square outline. The icon is presented in a simple, solid black against a stark white background, making it highly versatile for digital interfaces, presentations, and design projects. Its clear, universally understood symbolism makes it ideal for indicating actions like download, collapse, or selection. Clear decrease vectors Down Arrow Icon in Rounded Square. A minimalist, clean vector graphic featuring a downward-pointing triangle (arrow) enclosed within a thick, rounded square outline. The icon is presented in a simple, solid black against a stark white background, making it highly versatile for digital interfaces, presentations, and design projects. Its clear, universally understood symbolism makes it ideal for indicating actions like download, collapse, or selection.
Free with trial A striking 3D rendering features a large, bold orange percentage (%) symbol being cut in half by a pair of black-handled scissors against a clean, light blue background. This powerful visual metaphor effectively represents concepts such as price reductions, discounts, cost-cutting, interest rate cuts, and financial savings. Ideal for illustrating sales promotions, special offers, budget management, or any theme related to decreasing percentages in business, finance, or retail. The clear imagery and vibrant colors make it an impactful graphic for marketing materials. Clear decrease illustrations Cutting Percentage Symbol for Discounts and Savings. A striking 3D rendering features a large, bold orange percentage (%) symbol being cut in half by a pair of black-handled scissors against a clean, light blue background. This powerful visual metaphor effectively represents concepts such as price reductions, discounts, cost-cutting, interest rate cuts, and financial savings. Ideal for illustrating sales promotions, special offers, budget management, or any theme related to decreasing percentages in business, finance, or retail. The clear imagery and vibrant colors make it an impactful graphic for marketing materials.
Free with trial A minimalist, black and white vector illustration depicting a financial graph with a clear downward trend. The graph features a jagged line representing fluctuating data, leading into a bold, thick arrow pointing downwards and to the right. This icon symbolizes decline, loss, recession, or negative performance in various contexts, such as business, economics, or stock markets. Its clean design makes it versatile for presentations, websites, and infographics. Clear decrease vectors Downward Trend Graph with Arrow Icon. A minimalist, black and white vector illustration depicting a financial graph with a clear downward trend. The graph features a jagged line representing fluctuating data, leading into a bold, thick arrow pointing downwards and to the right. This icon symbolizes decline, loss, recession, or negative performance in various contexts, such as business, economics, or stock markets. Its clean design makes it versatile for presentations, websites, and infographics.
Free with trial Magnifying glass icon representing the concept of zooming out or minimizing a search, providing a clear visual for user interface elements and digital functions. Clear decrease illustrations Magnifying glass icon zoom out minus search. Magnifying glass icon representing the concept of zooming out or minimizing a search, providing a clear visual for user interface elements and digital functions
Free with trial Carbon dioxide, CO2 neutral footprint icon or emblem. Carbon dioxide neutral label, CO2 environment pollution vector icon. Greenhouse gas footprint symbol with green leaves and handwritten typography. Clear decrease vectors Carbon dioxide, CO2 neutral footprint icon
Free with trial Carbon dioxide, CO2 gas neutral pollution icon or emblem. Carbon pollution ecology sticker, CO2 neutral emission vector label. Greenhouse gas zero exhaust icon with green leaf, typography on gas tank. Clear decrease vectors Carbon dioxide, CO2 gas neutral pollution icon. Or emblem. Carbon pollution ecology sticker, CO2 neutral emission vector label. Greenhouse gas zero exhaust icon. Carbon dioxide, CO2 gas neutral pollution icon or emblem. Carbon pollution ecology sticker, CO2 neutral emission vector label. Greenhouse gas zero exhaust icon with green leaf, typography on gas tank
Free with trial Magnifying glass with a minus sign icon symbolizing zoom out, searching, and decreasing functions within a digital interface, making it useful for web applications and mobile apps. Clear decrease vectors Zoom out magnifying glass search interface icon. Magnifying glass with a minus sign icon symbolizing zoom out, searching, and decreasing functions within a digital interface, making it useful for web applications and mobile apps
Free with trial Carbon dioxide, CO2 neutral emission icon or seal. Carbon emission climate change label, CO2 environment pollution vector symbol. Dioxide neutral footprint sticker with leaf, bubbles and typography. Clear decrease vectors Carbon dioxide, CO2 neutral emission icon or seal
Free with trial A minimal flat design icon with a modern look un-cart. Clear decrease vectors A minimal flat design icon with a modern look un-cart
Free with trial Carbon dioxide, greenhouse gas neutral icon or sign. CO2 environment pollution icon, dioxide neutral vector symbol. Carbon emission ecology label with green water drop or plant leaf. Clear decrease vectors Co2 carbon greenhouse gas neutral emission icon. Carbon dioxide, greenhouse gas neutral icon or sign. CO2 environment pollution icon, dioxide neutral vector symbol. Carbon emission ecology label with green water drop or plant leaf
Free with trial Financial loss solid vector icon. This glyph icon has a downward trend and dollar sign. A clear analytics symbol and data sign for risk and decline icon uses. Clear decrease vectors Financial loss solid vector icon