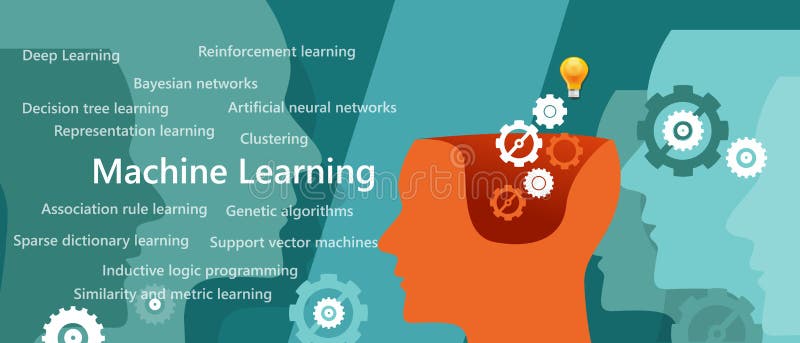
Free with trial Machine learning algorithm concept with related subject such as decision tree, artificial neural network, deep learning and sparse dictionary present with gear gear inside human brain head. Clustering algorithm vectors Machine learning algorithm concept with related subject such as decision tree
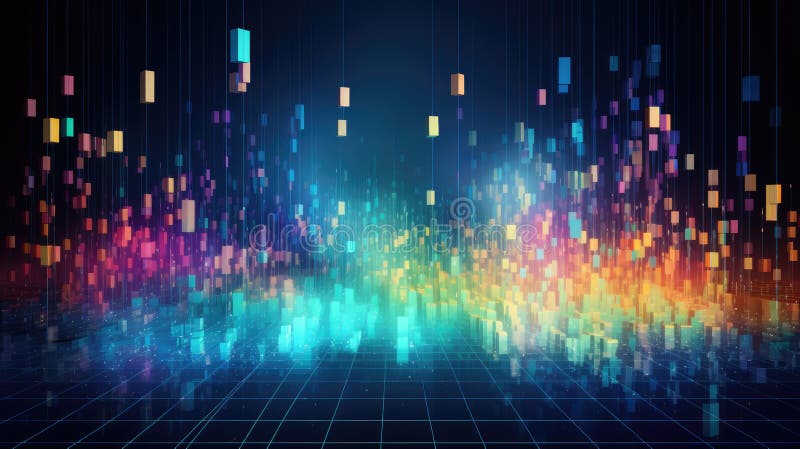
Free with trial This image depicts a scatter plot featuring a high density of multicolored dots concentrated at the center, gradually thinning out towards the edges. The points are distributed in a roughly triangular formation, with vibrant colors including red, blue, green, and yellow, indicating either a clustering algorithm result or a data distribution visualization. The visual effect creates a sense of depth. Clustering algorithm illustrations A colorful scatter plot visualization with dense central clustering and dispersed points outward. This image depicts a scatter plot featuring a high density of multicolored dots concentrated at the center, gradually thinning out towards the edges. The points are distributed in a roughly triangular formation, with vibrant colors including red, blue, green, and yellow, indicating either a clustering algorithm result or a data distribution visualization. The visual effect creates a sense of depth
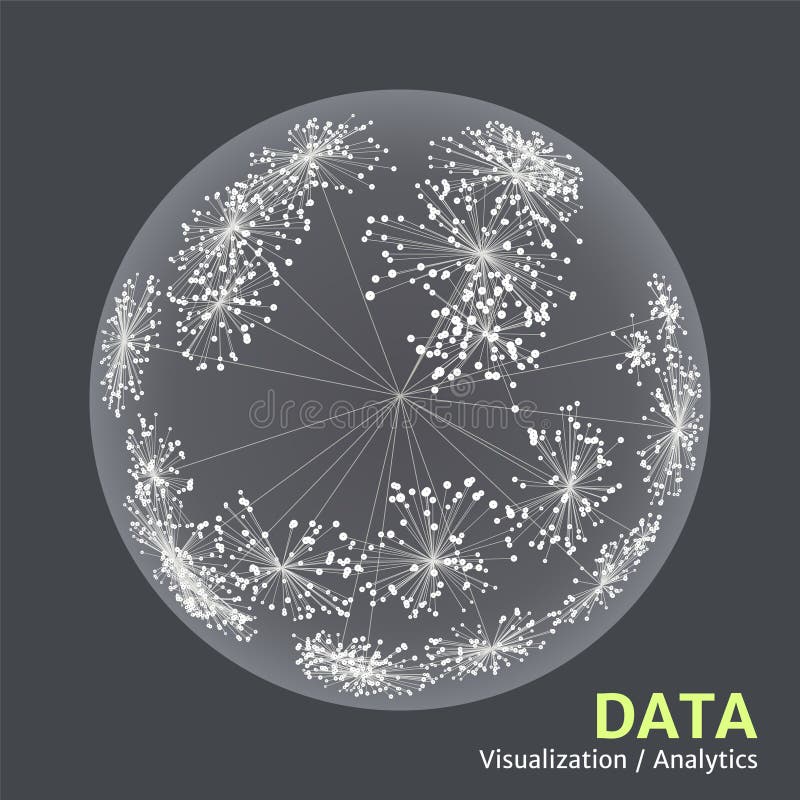
Free with trial Big data complexity visual representation. Cluster analysis visualization. Advanced analytics. Graphic abstract background. Vector illustration. Clustering algorithm vectors Big data complexity visual representation. Cluster analysis visualization. Advanced analytics. Graphic abstract background.
Free with trial Artificial neural network. The nodes are connected with each other through synaptic connections. The system of connection and interaction between biological neural networks. Clustering algorithm vectors Artificial neural network. The nodes are connected with each other through synaptic connections.
Free with trial This captivating image showcases a vintage analog computer, meticulously displaying a visualization of the K-Means clustering algorithm. The intricate circuitry and dials, reminiscent of a bygone era, provide a fascinating contrast to the modern machine learning concept. The display clearly illustrates the iterative process of the algorithm. Points, represented by physical markers or lights,. Clustering algorithm illustrations Visualizing the KMeans Clustering Algorithm on a Retro Analog Computer A Historical Glimpse into Machine Learning. This captivating image showcases a vintage analog computer, meticulously displaying a visualization of the K-Means clustering algorithm. The intricate circuitry and dials, reminiscent of a bygone era, provide a fascinating contrast to the modern machine learning concept. The display clearly illustrates the iterative process of the algorithm. Points, represented by physical markers or lights,
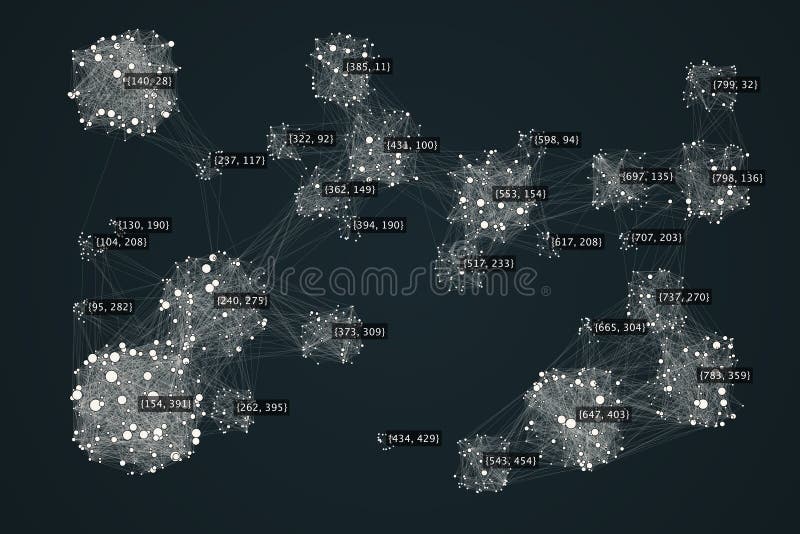
Free with trial The image showcases nine different visualizations of network data, each representing the application of various clustering algorithms. The algorithms are labeled as NEUMACT, NEUMACTY, and ALEACTY, with each algorithm applied to three different datasets. The visualizations use circular nodes and connecting lines to illustrate the relationships and groupings within the data. Clustering algorithm illustrations Visual representation of network data with various clustering algorithms. The image showcases nine different visualizations of network data, each representing the application of various clustering algorithms. The algorithms are labeled as NEUMACT, NEUMACTY, and ALEACTY, with each algorithm applied to three different datasets. The visualizations use circular nodes and connecting lines to illustrate the relationships and groupings within the data
Free with trial AI - Visualizing Big Data Generated by an Clustering Algorithm Bright Colors. Clustering algorithm illustrations Visualizing Big Data Generated by an Clustering Algorithm Bright Colors
Free with trial AI - Visualizing Big Data Generated by an Clustering Algorithm in a 3D Circle Design. Clustering algorithm illustrations Visualizing Big Data Generated by an Clustering Algorithm in a 3D Circle Design
Free with trial AI - Visualizing in a 3D Circle Style of Big Data Generated by an Clustering Algorithm. Clustering algorithm illustrations Visualizing in a 3D Circle Style of Big Data Generated by an Clustering Algorithm
Free with trial AI - Visualizing in Modern Cube Design - Big Data Generated by an Clustering Algorithm. Clustering algorithm illustrations Visualizing in Modern Cube Design - Big Data Generated by an Clustering Algorithm
Free with trial AI - Visualizing in Modern Cube Design - Big Data Generated by an Clustering Algorithm. Clustering algorithm illustrations Visualizing in Modern Cube Design - Big Data Generated by an Clustering Algorithm
Free with trial AI - Visualizing Big Data Generated by an Clustering Algorithm. Clustering algorithm illustrations Visualizing Big Data Generated by an Clustering Algorithm
Free with trial RNA-Seq Expression Clustering abstract concept vector illustration. Bioinformatics. Accelerates sustainability for the digital era. abstract metaphor. Clustering algorithm illustrations RNA-Seq Expression Clustering abstract concept vector illustration.
Free with trial AI - Visualizing Big Data Generated by an Clustering Algorithm in Glowing 3D Bar Design. Clustering algorithm illustrations Visualizing Big Data Generated by an Clustering Algorithm in Glowing 3D Bar Design
Free with trial AI - Visualizing Big Data Generated by an Clustering Algorithm in Glowing 3D Bar Design. Clustering algorithm illustrations Visualizing Big Data Generated by an Clustering Algorithm in Glowing 3D Bar Design
Free with trial AI - Visualizing Big Data Generated by an Clustering Algorithm in a Cube Design. Clustering algorithm illustrations Visualizing Big Data Generated by an Clustering Algorithm in a Cube Design
Free with trial AI - Visualizing Big Data Generated by an Clustering Algorithm in Glowing Design. Clustering algorithm illustrations Visualizing Big Data Generated by an Clustering Algorithm in Glowing Design
Free with trial AI - Visualizing Big Data Generated by an Clustering Algorithm in Glowing Design. Clustering algorithm illustrations Visualizing Big Data Generated by an Clustering Algorithm in Glowing Design
Free with trial AI - Visualizing Big Data Generated by an Clustering Algorithm in Glowing Design. Clustering algorithm illustrations Visualizing Big Data Generated by an Clustering Algorithm in Glowing Design
Free with trial AI - Visualizing in a Circle Kind UI Big Data Generated by an Clustering Algorithm. Clustering algorithm illustrations Visualizing in a Circle Kind UI Big Data Generated by an Clustering Algorithm
Free with trial AI - Visualizing in a Circle Kind UI Big Data Generated by an Clustering Algorithm. Clustering algorithm illustrations Visualizing in a Circle Kind UI Big Data Generated by an Clustering Algorithm
Free with trial AI - Visualizing in a Circle Kind UI Big Data Generated by an Clustering Algorithm. Clustering algorithm illustrations Visualizing in a Circle Kind UI Big Data Generated by an Clustering Algorithm
Free with trial AI - Visualizing Big Data Generated by an Clustering Algorithm in a Glowing Cube Design. Clustering algorithm illustrations Visualizing Big Data Generated by an Clustering Algorithm in a Glowing Cube Design
Free with trial AI - Visualizing Big Data Generated by an Clustering Algorithm in a Glowing Cube Design. Clustering algorithm illustrations Visualizing Big Data Generated by an Clustering Algorithm in a Glowing Cube Design
Free with trial AI - Visualizing Big Data Generated by an Clustering Algorithm in a Glowing Cube Design. Clustering algorithm illustrations Visualizing Big Data Generated by an Clustering Algorithm in a Glowing Cube Design
Free with trial AI - Visualizing Big Data Generated by an Clustering Algorithm in a Glowing Cube Design. Clustering algorithm illustrations Visualizing Big Data Generated by an Clustering Algorithm in a Glowing Cube Design
Free with trial AI - Visualizing in a 3D Bar Graph Design of Big Data Generated by an Clustering Algorithm. Clustering algorithm illustrations Visualizing in a 3D Bar Graph Design of Big Data Generated by an Clustering Algorithm
Free with trial AI - Visualizing Big Data Generated by an Clustering Algorithm in Glowing Colors. Clustering algorithm illustrations Visualizing Big Data Generated by an Clustering Algorithm in Glowing Colors
Free with trial Clusters of vibrant dots in varying sizes create a captivating pattern, transitioning from red and orange to blue and purple hues. The dots are densely arranged, forming an abstract, minimalist representation of a clustering algorithm. The background is a gradient from white to light blue, enhancing the vividness of the colors. The image is a digital art piece, emphasizing color distribution and spatial organization. Clustering algorithm illustrations A captivating, minimalist representation of a clustering algorithm, featuring vibrant dots arranged. Clusters of vibrant dots in varying sizes create a captivating pattern, transitioning from red and orange to blue and purple hues. The dots are densely arranged, forming an abstract, minimalist representation of a clustering algorithm. The background is a gradient from white to light blue, enhancing the vividness of the colors. The image is a digital art piece, emphasizing color distribution and spatial organization.
Free with trial Genesis icon set. Collection of simple elements such as the evolution, clustering, algorithm, cognition, engineering, big data and ther icons. Clustering algorithm vectors Genesis icon set. Collection of simple elements such as the evolution, clustering, algorithm, cognition, engineering
Free with trial AI - Visualizing Big Data Generated by an Clustering Algorithm in Glowing Cube Design. Clustering algorithm illustrations Visualizing Big Data Generated by an Clustering Algorithm in Glowing Cube Design
Free with trial AI - Visualizing in a 3D Bar Diagramm of Big Data Generated by an Clustering Algorithm. Clustering algorithm illustrations Visualizing in a 3D Bar Diagramm of Big Data Generated by an Clustering Algorithm
Free with trial AI - Visualizing in a 3D Bar Diagramm of Big Data Generated by an Clustering Algorithm. Clustering algorithm illustrations Visualizing in a 3D Bar Diagramm of Big Data Generated by an Clustering Algorithm
Free with trial AI - Visualizing in a 3D Bar Diagramm of Big Data Generated by an Clustering Algorithm. Clustering algorithm illustrations Visualizing in a 3D Bar Diagramm of Big Data Generated by an Clustering Algorithm
Free with trial Machine Learning icon set. Collection of simple elements such as the machine learning, clustering, algorithm, engineering. Machine Learning theme signs. Clustering algorithm illustrations Machine Learning icon set. Monochrome sign collection with sensorimotor skill, ai robot, deep learning, neural network and over. Machine Learning icon set. Collection of simple elements such as the machine learning, clustering, algorithm, engineering. Machine Learning theme signs
Free with trial Blockchain, algorithm management, clustering, identification and analysis. Research cyberspace, tiny man and information about crypto mining. Transaction process, vector cartoon flat isolated concept. Clustering algorithm vectors Blockchain, algorithm management, clustering, identification and analysis. Research cyberspace, tiny man and information
Free with trial Predictive Modeling line icons collection. Algorithm, Bayesian, Classification, Clustering, Correlation, Decision tree. Clustering algorithm vectors Predictive Modeling line icons collection. Algorithm, Bayesian, Classification, Clustering, Correlation, Decision tree
Free with trial A collection of 20 icons representing various concepts in data science and analytics, including data, analytics, machine learning, algorithm, modeling, visualization, big data, cleaning, exploration, statistics, insights, classification, clustering, collaboration, artificial intelligence, deep learning, data lake, feature engineering, data warehouse, and reporting. Clustering algorithm illustrations Data Science and Analytics Icons. A collection of 20 icons representing various concepts in data science and analytics, including data, analytics, machine learning, algorithm, modeling, visualization, big data, cleaning, exploration, statistics, insights, classification, clustering, collaboration, artificial intelligence, deep learning, data lake, feature engineering, data warehouse, and reporting.
Free with trial Research seo clustering keyword vector. analysis ranking, algorithm target, audience relevance research seo clustering keyword web flat cartoon illustration. Clustering algorithm vectors Research seo clustering keyword vector
Free with trial Algorithm splitting graph illustration nodes edges, partition clustering, bipartite sub algorithm splitting graph. Clustering algorithm illustrations Algorithm splitting graph
Free with trial The image depicts an abstract representation of data clustering and distribution, featuring concentric circular patterns in pink and green colors surrounding a central black vertical structure. The background includes a stylized outline of a city skyline. The visualization likely represents complex data relationships, network flows, or clustering algorithms, with the green areas possibly. Clustering algorithm illustrations Abstract visualization of data clustering and distribution patterns. The image depicts an abstract representation of data clustering and distribution, featuring. The image depicts an abstract representation of data clustering and distribution, featuring concentric circular patterns in pink and green colors surrounding a central black vertical structure. The background includes a stylized outline of a city skyline. The visualization likely represents complex data relationships, network flows, or clustering algorithms, with the green areas possibly
Free with trial Blockchain analytics as centralized, decentralized and distributed model comparison tiny person concept. Data process algorithm management, clustering, identifying and analyze vector illustration. Clustering algorithm vectors Blockchain analytics as centralized and distributed tiny person concept. Blockchain analytics as centralized, decentralized and distributed model comparison tiny person concept. Data process algorithm management, clustering, identifying and analyze vector illustration.
Free with trial AI-driven keyword clustering for SEO optimization with automated grouping and semantic analysis. ai keyword clustering, search intent detection for content marketing strategy flat vector illustration. Clustering algorithm vectors AI-driven keyword clustering for SEO optimization with automated grouping and semantic analysis. ai keyword clustering
Free with trial The image shows a hierarchical clustering analysis represented by a dendrogram on the left side and a heatmap on the right. The dendrogram illustrates the clustering of data points into distinct groups, with different colored vertical lines indicating clusters. The heatmap displays a matrix of data values, with rows and columns representing variables or samples, and colors indicating the magnitude. Clustering algorithm illustrations Visualization of hierarchical clustering with dendrogram and heatmap. The image shows a hierarchical clustering analysis represented by a dendrogram on the left side and a heatmap on the right. The dendrogram illustrates the clustering of data points into distinct groups, with different colored vertical lines indicating clusters. The heatmap displays a matrix of data values, with rows and columns representing variables or samples, and colors indicating the magnitude
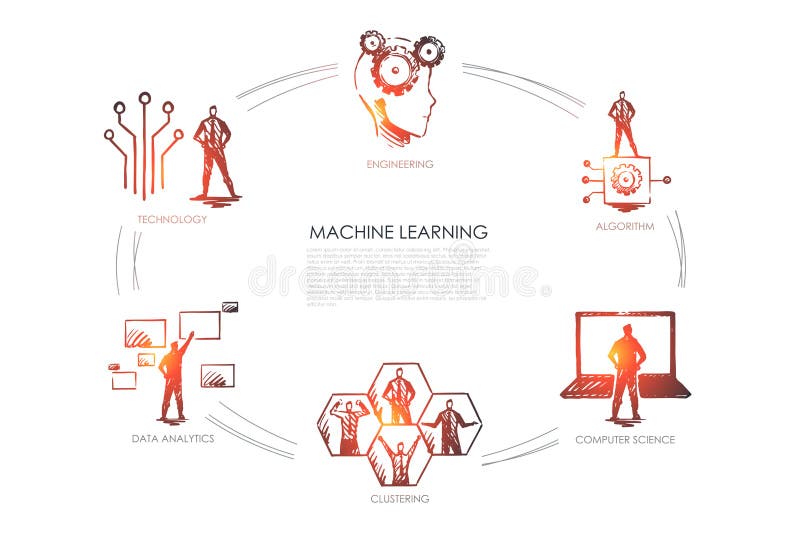
Free with trial Machine learning - algorithm, computer science, clustering, data analytics, engineering set concept. Hand drawn isolated vector. Clustering algorithm vectors Machine learning - algorithm, computer science, clustering, data analytics, engineering set concept.
Free with trial Business Data Analytics with AI Clustering and Venn Diagram on Laptop. Clustering algorithm illustrations Business Data Analytics with AI Clustering and Venn Diagram on Laptop
Free with trial The image displays a three-dimensional hierarchical clustering visualization, where data points are grouped and colored differently to represent distinct clusters. The top cluster is highlighted in pink, the middle in green, and the bottom in yellow, with lines connecting the data points to indicate relationships and hierarchical structure. The visualization uses a tree-like branching pattern to. Clustering algorithm illustrations Visualization of a complex data structure with hierarchical clustering. The image displays a three-dimensional hierarchical clustering visualization, where data points are grouped and colored differently to represent distinct clusters. The top cluster is highlighted in pink, the middle in green, and the bottom in yellow, with lines connecting the data points to indicate relationships and hierarchical structure. The visualization uses a tree-like branching pattern to
Free with trial Data complexity representation. Big data concept visualization. Analytics abstract concept. Graphic background. Information clustering. Clustering algorithm vectors Data complexity representation. Big data concept visualization. Information clustering. Data complexity representation. Big data concept visualization. Analytics abstract concept. Graphic background. Information clustering
Free with trial Vector abstract big data visualization. Visual information complexity. Information clustering representation. Clustering algorithm vectors Vector abstract big data visualization. Information clustering representation. Vector abstract big data visualization. Visual information complexity. Information clustering representation
Free with trial Algorithm big data line icon vector. algorithm big data sign. isolated contour symbol black illustration. Clustering algorithm vectors Algorithm big data line icon vector illustration. algorithm big data line icon vector. algorithm big data sign. isolated contour symbol black illustration
Free with trial Machine learning algorithm model icons set vector. data training, supervised unsupervised, neural deep, learning, regression machine learning algorithm model black contour illustrations. Clustering algorithm vectors Machine learning algorithm model icons set vector
Free with trial Algorithm big data color icon vector. algorithm big data sign. isolated symbol illustration. Clustering algorithm vectors Algorithm big data color icon vector illustration. algorithm big data color icon vector. algorithm big data sign. isolated symbol illustration
Free with trial Machine learning algorithm model icons set vector. data training, supervised unsupervised, neural deep, learning, regression machine learning algorithm model color line illustrations. Clustering algorithm vectors Machine learning algorithm model icons set vector
Free with trial The image displays a heatmap visualization commonly used in hierarchical clustering, where data points are organized into a matrix with a color gradient ranging from dark red to light yellow. The left and bottom sides of the heatmap have dendrograms, indicating the hierarchical relationships and clustering of data points. The background shows scattered grids representing individual data entries,. Clustering algorithm illustrations Visualization of hierarchical clustering using a heatmap with color gradient. The image displays a heatmap visualization commonly used in hierarchical clustering, where data points are organized into a matrix with a color gradient ranging from dark red to light yellow. The left and bottom sides of the heatmap have dendrograms, indicating the hierarchical relationships and clustering of data points. The background shows scattered grids representing individual data entries,
Free with trial Algorithm big data line icon vector. algorithm big data sign. isolated contour symbol black illustration. Clustering algorithm illustrations Algorithm big data line icon vector illustration. algorithm big data line icon vector. algorithm big data sign. isolated contour symbol black illustration
Free with trial Algorithm big data color icon vector. algorithm big data sign. isolated symbol illustration. Clustering algorithm vectors Algorithm big data color icon vector illustration. algorithm big data color icon vector. algorithm big data sign. isolated symbol illustration
Free with trial Data complexity representation. Big data concept visualization. Analytics abstract concept. Graphic background. Information clustering. Connected network. Clustering algorithm vectors Data complexity representation. Big data concept visualization. Analytics abstract concept. Information clustering. Data complexity representation. Big data concept visualization. Analytics abstract concept. Graphic background. Information clustering. Connected network
Free with trial The image depicts a hierarchical clustering dendrogram, a tree-like diagram used to illustrate the arrangement of clusters produced by hierarchical clustering. The dendrogram features multiple colored branches extending downward, with each branch representing a data point or cluster. The colored sections at the top indicate different clusters or groups, with the colors transitioning smoothly. Clustering algorithm illustrations Visualization of hierarchical clustering using a dendrogram with colored branches. The image depicts a hierarchical clustering dendrogram, a tree-like diagram used to illustrate the arrangement of clusters produced by hierarchical clustering. The dendrogram features multiple colored branches extending downward, with each branch representing a data point or cluster. The colored sections at the top indicate different clusters or groups, with the colors transitioning smoothly
Free with trial Algorithm flowchart machine learning glyph icon vector. algorithm flowchart machine learning sign. isolated symbol illustration. Clustering algorithm vectors Algorithm flowchart machine learning glyph icon vector illustration. algorithm flowchart machine learning glyph icon vector. algorithm flowchart machine learning sign. isolated symbol illustration
Free with trial Machinelearning data classification illustration algorithm supervised, unsupervised clustering, randomforest neuralnetwork machinelearning data classification. Clustering algorithm illustrations Machinelearning data classification
Free with trial Algorithm flowchart machine learning line icon vector. algorithm flowchart machine learning sign. isolated contour symbol black illustration. Clustering algorithm vectors Algorithm flowchart machine learning line icon vector illustration. algorithm flowchart machine learning line icon vector. algorithm flowchart machine learning sign. isolated contour symbol black illustration
Free with trial The image shows a circular dendrogram with a hierarchical clustering visualization of data points. The data is segmented into distinct color-coded clusters, with each concentric circle representing a different level of granularity. The structure appears densely packed in the center, gradually spreading outwards. The color scheme transitions from dark greens and reds in the inner circles to lighter. Clustering algorithm illustrations Color-coded hierarchical clustering of a complex dataset visualized in a circular dendrogram. The image shows a circular dendrogram with a hierarchical clustering visualization of data points. The data is segmented into distinct color-coded clusters, with each concentric circle representing a different level of granularity. The structure appears densely packed in the center, gradually spreading outwards. The color scheme transitions from dark greens and reds in the inner circles to lighter
Free with trial Machine learning algorithm model icons set vector. data, training supervised, unsupervised neural, deep learning machine learning algorithm model black contour illustrations. Clustering algorithm illustrations Machine learning algorithm model icons set vector
Free with trial Machine learning algorithm model icons set vector. data, training supervised, unsupervised neural, deep learning machine learning algorithm model black contour illustrations. Clustering algorithm illustrations Machine learning algorithm model icons set vector
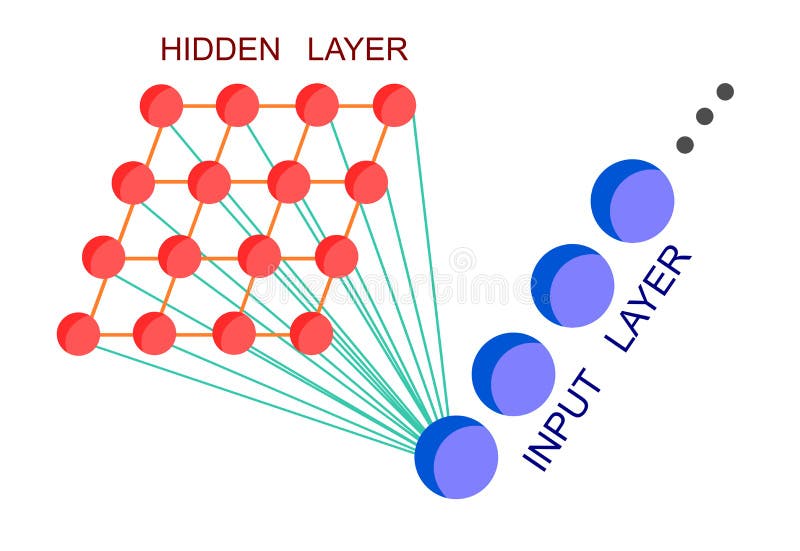
Free with trial Self organinzing maps or kohonen maps, which is an algorithm used in clustering and machine learning, structure with input layer and hidden layer and the link between two layer. Clustering algorithm vectors Self Organizing maps neural network in flat design. Self organinzing maps or kohonen maps, which is an algorithm used in clustering and machine learning, structure with input layer and hidden layer and the link between two layer