Complex Bar Loading Data Illustrations & Vectors

Only a few matches for complex bar loading data. Also displaying results for

Browse through 68 complex bar loading data illustrations & vectors or explore more loading bar or progress bar vectors to complete your project with stunning visuals.
A digital progress bar, glowing green, is set against a background resembling a complex circuit board in shades of blue. The circuit design features intricate paths and connections, simulating electronic components. The progress bar has a textured pattern and appears illuminated, suggesting movement or progression, symbolizing concepts of technology, loading, or data transfer in a digital environment. The overall tone is futuristic and tech-oriented. Complex bar loading data illustrations
Digital data migration process displayed on a server rack monitor within a modern enterprise data center, showing loading progress in a high-tech information technology environment. Complex bar loading data illustrations
A compelling image captures the palpable tension of a modern office worker facing a seemingly endless loading bar. The focused gaze and furrowed brow reveal the frustration of delays in a digital workflow. The image vividly portrays the common experience of waiting for software to load, data to process, or a project to finalize. Is it a simple technical glitch, a complex system overload, or a. Complex bar loading data illustrations
Experience the mesmerizing chaos of a digital download gone wrong. This captivating image showcases a glitch loading screen, transforming the familiar progress bar into a surreal landscape of distorted shapes, pixelation, and vibrant color shifts. The background pulsates with a complex pattern of lines and noise, as if the digital signal is struggling to transmit data. This dynamic visual. Complex bar loading data illustrations
This image captures a futuristic concept where the year 2026 is displayed with a digital progress bar showing 70 percent completion against a blurred urban backdrop at twilight. The neon green interface contrasts sharply with the soft orange and purple hues of the sunset illuminating the city's complex highway infrastructure. Rendered by Ai, this visualization suggests anticipation for future. Complex bar loading data illustrations
A collection of interlocking bronze and silver gears of various sizes in motion, suggesting a complex mechanism or system. Each gear features a prominent loading bar graphic, symbolizing progress, development, or a system in operation. This visual represents teamwork, industry, and technological advancement. Complex bar loading data illustrations
This creation is in a techno pencil sketch style background. The focal point of the piece is a prominent, multi-layered circular gauge located in the mid-right section. This element features concentric rings, finely spaced measurement ticks, directional arrow indicating rotation, and a central crosshair reticle, closely resembling a radar display, targeting system, or mechanical dial. Radiating outward from this central ring to the left is an abstract, shaded cylindrical curve and fine arc lines, suggesting motion, a frequency wave, or a dimensional distortion field. Surrounding this central core are dense clusters of complex technical data. In the top-right and bottom-left corners, stylized bar charts and data graphs plot variable heights against numerical axes. Intricate circuit board traces, microchip nodes, and transistor wiring pathways are detailed in the upper-right and lower-right quadrants. The canvas is heavily populated with sequences of binary code blocks (strings of zeros and ones) scattered horizontally and vertically, alongside blocks of unreadable technical text, micro-typography, layout grids, calibration crosshairs, and blocky loading-style progress meters along the very bottom and top borders. The overall aesthetic perfectly captures a high-tech cybernetic blueprint, combining elements of deep-space navigation, advanced computing, and industrial sci-fi design. Complex bar loading data illustrations

Anatomy of a Blueprint of a Machine. This creation is in a techno pencil sketch style background. The focal point of the piece is a prominent, multi-layered. This creation is in a techno pencil sketch style background. The focal point of the piece is a prominent, multi-layered circular gauge located in the mid-right section. This element features concentric rings, finely spaced measurement ticks, directional arrow indicating rotation, and a central crosshair reticle, closely resembling a radar display, targeting system, or mechanical dial. Radiating outward from this central ring to the left is an abstract, shaded cylindrical curve and fine arc lines, suggesting motion, a frequency wave, or a dimensional distortion field. Surrounding this central core are dense clusters of complex technical data. In the top-right and bottom-left corners, stylized bar charts and data graphs plot variable heights against numerical axes. Intricate circuit board traces, microchip nodes, and transistor wiring pathways are detailed in the upper-right and lower-right quadrants. The canvas is heavily populated with sequences of binary code blocks (strings of zeros and ones) scattered horizontally and vertically, alongside blocks of unreadable technical text, micro-typography, layout grids, calibration crosshairs, and blocky loading-style progress meters along the very bottom and top borders. The overall aesthetic perfectly captures a high-tech cybernetic blueprint, combining elements of deep-space navigation, advanced computing, and industrial sci-fi design.

A dark, futuristic Heads-Up Display (HUD) showcases a complex array of digital interfaces, data visualizations, and system status indicators. Elements include loading bars, power level indicators, voltage stability warnings, nano-tech restoring processes, transmission incoming data, and abstract geometric patterns. The overall aesthetic is high-tech, scientific, and potentially related to cybersecurity, artificial intelligence, or advanced engineering. Complex bar loading data vectors
A minimalist graphic illustrating the RIG system initializing. A progress bar moves around a circle, culminating in a fiery spark of ignition, symbolizing the start of a powerful process, innovation, or the final stage of loading a complex setup. Complex bar loading data illustrations
An illustrated graphic showing a person working at a futuristic desk with a computer monitor, tablet, and complex network data visual elements. The screen displays a loading progress bar, while glowing circuitry lines, digital nodes, security shields, and computer bugs float in the background. This clean and modern flat style is ideal for themes related to cybersecurity, data analysis, information technology, software development, artificial intelligence, digital transformation, and network administration. Complex bar loading data vectors
A vibrant neon "LOADING" sign glows brightly against a complex abstract digital circuit board The image evokes a futuristic technological aesthetic with its bold colors and dynamic design perfect for representing progress data processing or technological innovation. Complex bar loading data illustrations
A vibrant, close-up view showcases a dynamic loading indicator pulsing brightly on a complex circuit board. The intricate network of interconnected components and glowing traces creates a captivating visual representation of technological progress. The bright, almost ethereal light emanating from the indicator and components suggests a powerful connection to data processing, network systems, and. Complex bar loading data illustrations
This creation is in a techno pencil sketch style background. Also this is a monochrome pencil which seamlessly blends mathematical precision with abstract, technological imagery, evoking a highly organized, digital schematic or surreal blueprint. The composition is structured primarily in black, grey, and white tones, using intricate hand-drawn elements to mimic complex computer interfaces, data visualizations, and geometric constructs. Dominating the top-left quadrant is a dense wall of binary code consisting of columns of zeros and ones. The text varies slightly in density, creating a subtle texture across the background. To the far left of this matrix sits an intricately shaded, multi-faceted geometric polyhedron that resembles an unfolded or 3D wireframe mesh. Below the binary array, a series of horizontal progress bars or loading indicators are stacked vertically, filled with varied block-like segments that suggest varying levels of data completion. Across the center and right areas of the piece, stylized data charts, bar graphs, and circuit-board schematics are meticulously laid out. Lines and nodes travel between these diagrams like traces on a motherboard. An abstract, empty frame with an angled isometric border hovers near the center, waiting to be filled with information. The bottom half of the drawing introduces a grid of dots, adding an underlying alignment system to the artwork. In the bottom-right corner, the geometric shapes become sharp, angular, and overlapping, creating architectural forms reminiscent of modern minimalist structures or origami. These forms are shaded with gradient pencil hatching to give them three-dimensional depth. Woven into these lower shapes are additional fine-lined circuit diagrams, complete with solder points, parallel buses, and small microchip-like outlines, cementing the fusion between abstract art and technical engineering. Complex bar loading data illustrations

Binary Monochrome Landscapes. This creation is in a techno pencil sketch style background. Also this is a monochrome pencil which seamlessly blends mathematical. This creation is in a techno pencil sketch style background. Also this is a monochrome pencil which seamlessly blends mathematical precision with abstract, technological imagery, evoking a highly organized, digital schematic or surreal blueprint. The composition is structured primarily in black, grey, and white tones, using intricate hand-drawn elements to mimic complex computer interfaces, data visualizations, and geometric constructs. Dominating the top-left quadrant is a dense wall of binary code consisting of columns of zeros and ones. The text varies slightly in density, creating a subtle texture across the background. To the far left of this matrix sits an intricately shaded, multi-faceted geometric polyhedron that resembles an unfolded or 3D wireframe mesh. Below the binary array, a series of horizontal progress bars or loading indicators are stacked vertically, filled with varied block-like segments that suggest varying levels of data completion. Across the center and right areas of the piece, stylized data charts, bar graphs, and circuit-board schematics are meticulously laid out. Lines and nodes travel between these diagrams like traces on a motherboard. An abstract, empty frame with an angled isometric border hovers near the center, waiting to be filled with information. The bottom half of the drawing introduces a grid of dots, adding an underlying alignment system to the artwork. In the bottom-right corner, the geometric shapes become sharp, angular, and overlapping, creating architectural forms reminiscent of modern minimalist structures or origami. These forms are shaded with gradient pencil hatching to give them three-dimensional depth. Woven into these lower shapes are additional fine-lined circuit diagrams, complete with solder points, parallel buses, and small microchip-like outlines, cementing the fusion between abstract art and technical engineering.

This presents an advanced heads-up display (HUD) user interface pack, featuring an extensive array of glowing blue futuristic frames, data indicators, and intricate icons. The elements are meticulously designed for high-tech applications, including sci-fi films, video games, and virtual reality experiences, against a dark blue backdrop. Complex bar loading data illustrations
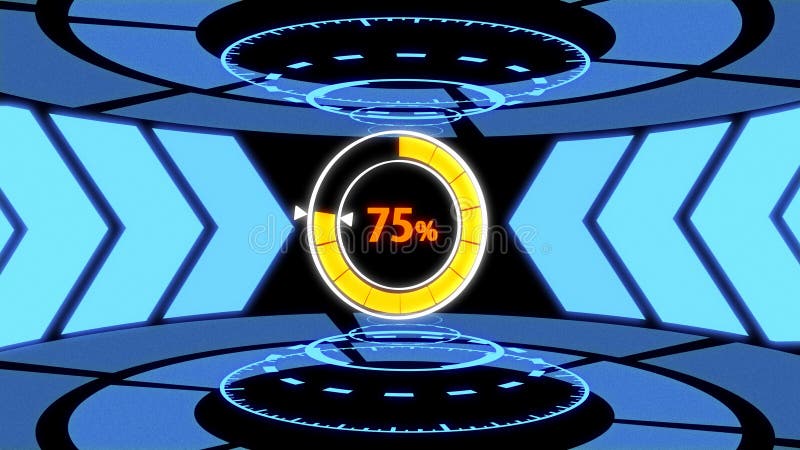
4K Resolution 3D Futuristic Loading screen HUD in Technology Laboratory with Arrow Path Lights, Loading Circle and Digital Circles 75% loading. Complex bar loading data illustrations
4K Resolution 3D Futuristic Loading screen HUD in Technology Laboratory with Arrow Path Lights, Loading Circle and Digital Circles 50% loading. Complex bar loading data illustrations
4K Resolution 3D Futuristic Loading screen HUD in Technology Laboratory with Arrow Path Lights, Loading Circle and Digital Circles 25% loading. Complex bar loading data illustrations
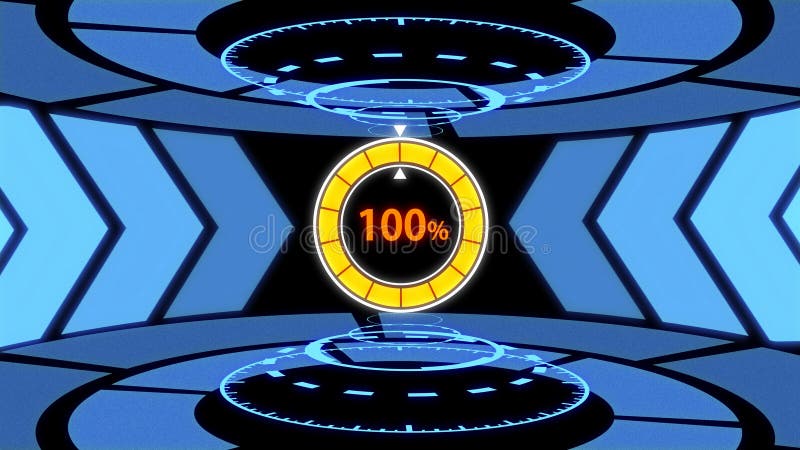
4K Resolution 3D Futuristic Loading screen HUD in Technology Laboratory with Arrow Path Lights, Loading Circle and Digital Circles 100% loading. Complex bar loading data illustrations
A human hand carefully places a bright blue energy source into a complex mechanical interface, suggesting activation or power-up of advanced technology. Complex bar loading data illustrations
Black and White Technological Footnotes Are Concise References Providing Essential Information About Technology, Products, Or Processes, Aiding Readers In Understanding Complex Concepts, Vector Set. Complex bar loading data vectors
Circular progress bar displaying data processing and loading status, indicating an achievement, goal, or performance metric within a digital interface. Complex bar loading data vectors
Progress bar illustration with blue and gray horizontal bar, labeled "LOADING DATA" above. The bar is partially filled to indicate 68% completion, with the percentage displayed in large blue text below. Beneath it, smaller text reads "68% Completed - Please wait... ". Light gray background enhances visibility of elements. Complex bar loading data vectors
Set of Circle, Loading Bar, HUD Abstract Digital Technology UI Futuristic HUD Virtual Interface Elements Sci- Fi Modern User For Graphic Motion, Theme Technology, Game, Elements of Background Hi-tech. Complex bar loading data vectors
Set of Circle and Loading Bar Abstract Digital Technology UI Futuristic HUD Virtual Interface Elements Sci- Fi Modern User For Graphic Motion, Theme Technology, Game, Elements of Background Hi-tech. Complex bar loading data vectors
Pattern circular loading progress bar indicator creating a graphic element for data representation, showing a percentage or status update on a white background. Complex bar loading data vectors
Circular loading progress bar indicator creating a graphic element for data representation, showing a percentage or status update on a white background. Complex bar loading data illustrations
Data management, progress tracking, tech interfaces, analytics tools, system design, database visuals. Graphic of a database on grid and loading bar interface. Data management and progress tracking. Complex bar loading data vectors
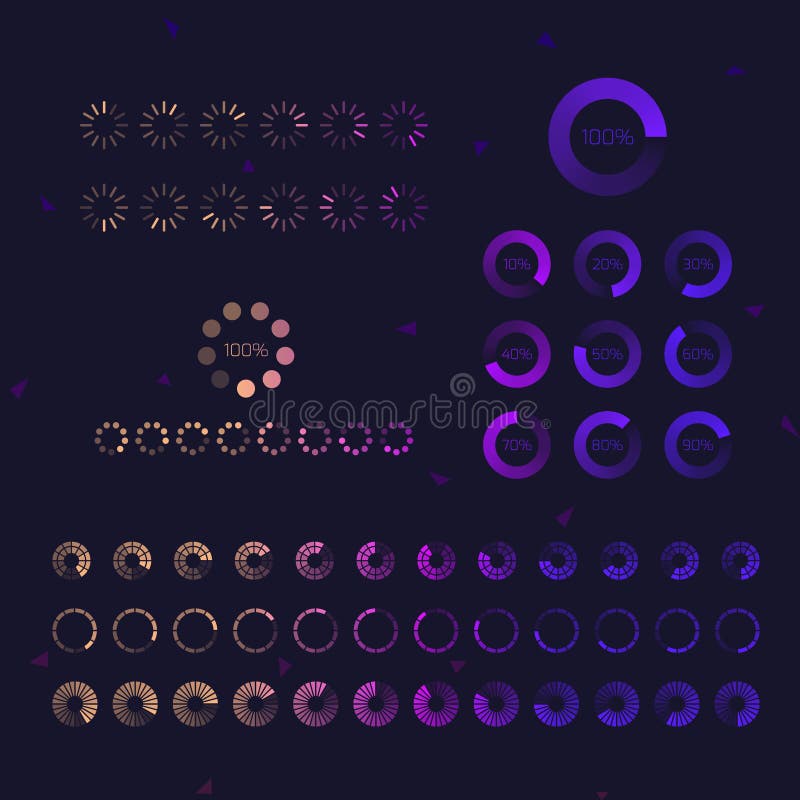
Vector illustration of round progress bar. Circle indicators status. Loading and buffering percentage icon set. Circular interval timer. Art design. Abstract concept graphic element. Accuracy dial. Complex bar loading data illustrations

Pattern circular loading progress bar indicator creating a graphic element for data representation, showing a percentage or status update on a white background. Complex bar loading data vectors
Data analysis, blockchain, technology infrastructure, progress tracking, network visualization, digital organization. Connected blocks, a pie chart and a loading bar graphic. Blockchain and data. Complex bar loading data illustrations