Free with trial 3D-modeled set of cubes representing the notion of data storage. Complex classification illustrations Data storage
Free with trial Intricate close-up of a stellar dendrite snowflake set against a black background. This natural ice crystal features a symmetrical, six-branched structure with elaborate, tree-like branches extending from a central point. The branches are finely detailed, showcasing the complex, ephemeral beauty inherent to snowflakes due to variations in temperature and humidity during formation. The term "Stellar Dendrite" is labeled underneath, highlighting its specific snowflake classification. Complex classification illustrations Intricate close-up of a stellar dendrite snowflake set against a black
Free with trial 3D-modeled set of cubes representing the notion of data storage. Complex classification illustrations Hosting. 3D-modeled set of cubes representing the notion of data storage
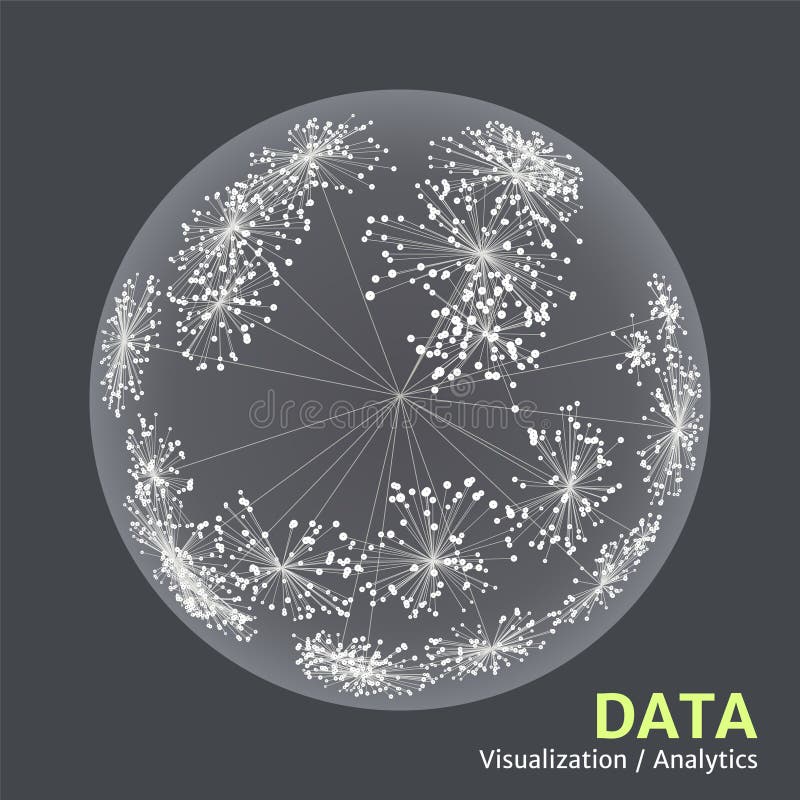
Free with trial Big data complexity visual representation. Cluster analysis visualization. Advanced analytics. Graphic abstract background. Vector illustration. Complex classification vectors Big data complexity visual representation. Cluster analysis visualization. Advanced analytics. Graphic abstract background.
Free with trial Classification being a complicated topic - pictured as word classification on a puzzle pieces to show that classification is complex and needs cooperating pieces that fit together. Classification is a compound, complex and composite subject. Complex classification illustrations Classification complex like a puzzle - pictured as word classification on a puzzle pieces. Classification being a complicated topic - pictured as word classification on a puzzle pieces to show that classification is complex and needs cooperating pieces that fit together. Classification is a compound, complex and composite subject.
Free with trial This image shows a detailed 3D reconstruction of an urban area, represented as a dense point cloud with varying intensities of green and gray. The central focus appears to be a complex arrangement of buildings, roads, and pathways, with some areas highlighted in different colors. To the left, a smaller inset image displays a colorful, segmented map or classification of the same area, possibly. Complex classification illustrations Detailed 3d reconstruction of an urban area with highlighted structures and pathways. This image shows a detailed 3D reconstruction of an urban area, represented as a dense point cloud with varying intensities of green and gray. The central focus appears to be a complex arrangement of buildings, roads, and pathways, with some areas highlighted in different colors. To the left, a smaller inset image displays a colorful, segmented map or classification of the same area, possibly
Free with trial A clear vector infographic illustrating mammal classification into categories like Primates, Carnivores, and Rodents, accompanied by representative icons. Ideal for zoology lessons, wildlife conservation, or biology presentations. This educational tool simplifies complex biological hierarchies, making learning about animal diversity accessible and engaging, vector design Generative AI. Complex classification vectors Mammal Classification Infographic, Animal Kingdom Vector Guide, vector design Generative AI. A clear vector infographic illustrating mammal classification into categories like Primates, Carnivores, and Rodents, accompanied by representative icons. Ideal for zoology lessons, wildlife conservation, or biology presentations. This educational tool simplifies complex biological hierarchies, making learning about animal diversity accessible and engaging, vector design Generative AI
Free with trial Dive into the fascinating world of data classification with this mesmerizing visualization. The intricate interplay of neon green and vibrant purple patterns represents the complex processes behind data sorting and categorization. This abstract algorithm visualization showcases the dynamic nature of these calculations, highlighting the steps involved in classifying data points. Notice how. Complex classification illustrations Visualizing Data Classification Algorithms A Dynamic Exploration of Neon Green and Purple Abstract Patterns. Dive into the fascinating world of data classification with this mesmerizing visualization. The intricate interplay of neon green and vibrant purple patterns represents the complex processes behind data sorting and categorization. This abstract algorithm visualization showcases the dynamic nature of these calculations, highlighting the steps involved in classifying data points. Notice how
Free with trial A colorful vector infographic illustrating insect classification, featuring butterflies, beetles, ants, and bees within a hexagonal structure. Ideal for educational materials, nature conservation, or entomology studies. This visual tool effectively categorizes and presents diverse insect groups, making complex biological information engaging and clear, vector design Generative AI. Complex classification vectors Insect Classification Infographic, Biodiversity Entomology Vector, vector design Generative AI. A colorful vector infographic illustrating insect classification, featuring butterflies, beetles, ants, and bees within a hexagonal structure. Ideal for educational materials, nature conservation, or entomology studies. This visual tool effectively categorizes and presents diverse insect groups, making complex biological information engaging and clear, vector design Generative AI
Free with trial Employee classification soft blue concept icon. Organizational structure, task management. Round shape line illustration. Abstract idea. Graphic design. Easy to use in presentation, article. Complex classification vectors Employee classification soft blue concept icon
Free with trial A detailed infographic breaks down the complex world of spoons, from their various types like ladles and demitasse to the sensory experiences of gustation and olfaction they facilitate. This educational vector illustration visualizes the process of learning and classification. Complex classification illustrations Vector Infographic of Spoon Science and Analysis. A detailed infographic breaks down the complex world of spoons, from their various types like ladles and demitasse to the sensory experiences of gustation and olfaction they facilitate. This educational vector illustration visualizes the process of learning and classification
Free with trial Employee classification multi color concept icon. Organizational structure, task management. Round shape line illustration. Abstract idea. Graphic design. Easy to use in presentation, article. Complex classification vectors Employee classification multi color concept icon
Free with trial This aerial view showcases a complex item sorting operation, highlighting the intricate process of shape and color profiling evaluation. The vibrant array of different colored items, meticulously organized, underscores the importance of accurate identification and classification. From a bird's-eye perspective, the system's efficiency in distinguishing subtle variations in shape and hue becomes. Complex classification illustrations Analyzing Color and Shape Variations in a LargeScale Sorting Process An Aerial Perspective on Item Profiling. This aerial view showcases a complex item sorting operation, highlighting the intricate process of shape and color profiling evaluation. The vibrant array of different colored items, meticulously organized, underscores the importance of accurate identification and classification. From a bird's-eye perspective, the system's efficiency in distinguishing subtle variations in shape and hue becomes
Free with trial A complex cyst of the kidney. Renal cell carcinoma vector illustration. Complex classification vectors Renal cyst, Bosniak type 4. A complex cyst of the kidney. Renal cell carcinoma. A complex cyst of the kidney. Renal cell carcinoma vector illustration
Free with trial A complex cyst of the kidney. Renal cell carcinoma vector illustration. Complex classification vectors Renal cyst, Bosniak type 4. A complex cyst of the kidney. Renal cell carcinoma. A complex cyst of the kidney. Renal cell carcinoma vector illustration
Free with trial Employee classification blue gradient concept icon. Organizational structure, task management. Round shape line illustration. Abstract idea. Graphic design. Easy to use in presentation, article. Complex classification vectors Employee classification blue gradient concept icon
Free with trial Prisoner classification blue gradient concept icon. Assessing categorizing inmates. Correctional management system. Round shape line illustration. Abstract idea. Graphic design. Easy to use in booklet. Complex classification vectors Prisoner classification blue gradient concept icon
Free with trial A close-up shot of a person's hands typing on a laptop keyboard, with the screen displaying advanced data analysis. The laptop screen shows a "Spectral Composite" interface, featuring detailed visualizations of "Mineral Classification" and "Band Ratio" data, including colorful maps, charts, and graphs. This image represents scientific research, geological exploration, remote sensing, and data processing in fields like mining, environmental monitoring, or earth sciences. It highlights the use of cutting-edge technology for complex data interpretation and decision-making. Complex classification illustrations Spectral Data Analysis for Mineral Classification on Laptop. A close-up shot of a person's hands typing on a laptop keyboard, with the screen displaying advanced data analysis. The laptop screen shows a "Spectral Composite" interface, featuring detailed visualizations of "Mineral Classification" and "Band Ratio" data, including colorful maps, charts, and graphs. This image represents scientific research, geological exploration, remote sensing, and data processing in fields like mining, environmental monitoring, or earth sciences. It highlights the use of cutting-edge technology for complex data interpretation and decision-making.
Free with trial Complex line illustration for decoration & design. Complex classification vectors Circular Classification or Network. Complex line illustration for decoration & design.
Free with trial Machine learning technique that`s used to solve regression and classification problems. Complex problems solution. Vector illustration, flat, clip art. Complex classification vectors Random forest line icon. Decision trees symbol. Machine learning technique that`s used to solve regression and classification problems. Complex problems solution. Vector illustration, flat, clip art.
Free with trial A distinctive vector icon illustrating three jars containing different patterns or specimens. Represents classification, collection, scientific research, and preserved items. Perfect for educational materials, biology, or abstract data organization, highlighting the systematic study of diverse elements and their importance in understanding complex systems, showcasing varied forms, vector design. Complex classification vectors Classified Specimen Jars, Diverse Collection Research Vector, vector design Generative AI. A distinctive vector icon illustrating three jars containing different patterns or specimens. Represents classification, collection, scientific research, and preserved items. Perfect for educational materials, biology, or abstract data organization, highlighting the systematic study of diverse elements and their importance in understanding complex systems, showcasing varied forms, vector design
Free with trial Futuristic data center featuring advanced robotic arms in a glass enclosure labeled "DATALINK 9000" for data classification. Colorful cubes sorted into categories like "Networks," "Analytics," and "Security. " Surrounding server racks display complex digital data. A person analyzes information on monitors, indicating high-tech data processing. The environment is sleek with blue lighting highlighting a sophisticated, automated sorting system. Complex classification illustrations Environment is sleek with blue lighting highlighting a sophistica. Futuristic data center featuring advanced robotic arms in a glass enclosure labeled 'DATALINK. Futuristic data center featuring advanced robotic arms in a glass enclosure labeled "DATALINK 9000" for data classification. Colorful cubes sorted into categories like "Networks," "Analytics," and "Security." Surrounding server racks display complex digital data. A person analyzes information on monitors, indicating high-tech data processing. The environment is sleek with blue lighting highlighting a sophisticated, automated sorting system.
Free with trial Visual representation of an artificial neural network (ANN) architecture. The image depicts interconnected nodes and layers illustrating the data flow from ingestion to preprocessing, feature extraction, and model architecture. It showcases the training phase using processes like backpropagation and gradient descent. Graphs on the right show predictions and inferences, including classification probabilities and regression outputs. The complex arrangement of lines and glowing nodes highlights the digital and abstract nature of AI systems, with textual annotations explaining each component of the ANN. Complex classification illustrations Visual representation of an artificial neural network (ANN) architecture
Free with trial Gain a comprehensive understanding of complex data patterns with this aerial view visualization. The image showcases the power of big data analytics in processing and classifying vast information streams. Imagine massive datasets flowing through a network, represented in a dynamic and insightful manner. This aerial perspective offers a unique vantage point, allowing for the identification of. Complex classification illustrations Unveiling Data Streams from Above Big Data Analytics Visualization and Classification for Network Insights. Gain a comprehensive understanding of complex data patterns with this aerial view visualization. The image showcases the power of big data analytics in processing and classifying vast information streams. Imagine massive datasets flowing through a network, represented in a dynamic and insightful manner. This aerial perspective offers a unique vantage point, allowing for the identification of
Free with trial This captivating visualization showcases an AI decision tree, a powerful tool for analyzing complex images. The image elegantly represents the intricate steps and branching logic within a machine learning algorithm. It highlights how the algorithm breaks down complex image analysis tasks into a series of interconnected decisions, each leading to further subdivisions based on specific features. Complex classification illustrations Visualizing AI Decision Trees for Complex Image Analysis A Deep Dive into Machine Learning Algorithms and Data. This captivating visualization showcases an AI decision tree, a powerful tool for analyzing complex images. The image elegantly represents the intricate steps and branching logic within a machine learning algorithm. It highlights how the algorithm breaks down complex image analysis tasks into a series of interconnected decisions, each leading to further subdivisions based on specific features.
Free with trial Data classification blue gradient concept icon. Information organization. Data lake architecture abstract idea thin line illustration. Isolated outline drawing. Myriad Pro-Bold font used. Complex classification vectors Data classification blue gradient concept icon
Free with trial Data classification turquoise concept icon. Data lake architecture abstract idea thin line illustration. Isolated outline drawing. Editable stroke. Arial, Myriad Pro-Bold fonts used. Complex classification vectors Data classification turquoise concept icon
Free with trial Prisoner classification soft blue concept icon. Assessing categorizing inmates. Correctional management system. Round shape line illustration. Abstract idea. Graphic design. Easy to use in booklet. Complex classification illustrations Prisoner classification soft blue concept icon
Free with trial Prisoner classification multi color concept icon. Assessing categorizing inmates. Correctional management system. Round shape line illustration. Abstract idea. Graphic design. Easy to use in booklet. Complex classification vectors Prisoner classification multi color concept icon
Free with trial Algorithm ai analysis of multi unit complex paper illustration data neural, network learning, model prediction algorithm ai analysis of multi unit complex paper. Complex classification illustrations Algorithm ai analysis of multi unit complex paper
Free with trial Data classification concept icon. Information organization. Data lake architecture abstract idea thin line illustration. Isolated outline drawing. Editable stroke. Arial, Myriad Pro-Bold fonts used. Complex classification vectors Data classification concept icon
Free with trial Network ai interpretation of multi-unit complex illustration algorithm data, analysis learning, machine deep network ai interpretation of multi-unit complex. Complex classification illustrations Network ai interpretation of multi-unit complex
Free with trial This detailed infographic illustrates the complex process of an Artificial Intelligence neural network. It visually represents the stages from data input and initialization, through algorithm training with a neural network, weight adjustment, and backpropagation. The diagram then progresses to pattern learning, convergence, and feature space visualization using glowing geometric shapes, culminating in the final optimized model and accurate prediction, such as image classification. Ideal for explaining AI and machine learning concepts in a modern, digital context. Complex classification illustrations AI Neural Network Training and Prediction Process Diagram. This detailed infographic illustrates the complex process of an Artificial Intelligence neural network. It visually represents the stages from data input and initialization, through algorithm training with a neural network, weight adjustment, and backpropagation. The diagram then progresses to pattern learning, convergence, and feature space visualization using glowing geometric shapes, culminating in the final optimized model and accurate prediction, such as image classification. Ideal for explaining AI and machine learning concepts in a modern, digital context.
Free with trial Classification concept icon. Data mining technique abstract idea thin line illustration. Categorizing applications. Isolated outline drawing. Editable stroke. Arial, Myriad Pro-Bold fonts used. Complex classification vectors Classification concept icon
Free with trial Classification blue gradient concept icon. Data mining technique abstract idea thin line illustration. Categorizing applications. Isolated outline drawing. Myriad Pro-Bold font used. Complex classification vectors Classification blue gradient concept icon
Free with trial A sprawling railroad classification yard fills the frame, showcasing the immense scale of modern freight transport. Long rows of freight train cars, a kaleidoscope of colors and sizes, line up along converging rail tracks that disappear into the distance. The meticulous organization of the yard suggests a complex network of operations, where trains are sorted and reassembled for their next. Complex classification illustrations Vast Freight Train Classification Yard Rows of Cars Extend Along Endless Rail Tracks. A sprawling railroad classification yard fills the frame, showcasing the immense scale of modern freight transport. Long rows of freight train cars, a kaleidoscope of colors and sizes, line up along converging rail tracks that disappear into the distance. The meticulous organization of the yard suggests a complex network of operations, where trains are sorted and reassembled for their next
Free with trial This minimalist desk setup, featuring a magnifying glass, notebook, and pen, symbolizes the meticulous process of clarifying complex ideas. The act of meticulously noting details, scrutinizing concepts, and defining terms is crucial for understanding and interpreting intricate information. A magnifying glass represents the close examination required to dissect complex subjects, revealing hidden. Complex classification illustrations Unlocking Insights A Minimalist Desk Setup for Precisely Defining and Expounding Complex Concepts. This minimalist desk setup, featuring a magnifying glass, notebook, and pen, symbolizes the meticulous process of clarifying complex ideas. The act of meticulously noting details, scrutinizing concepts, and defining terms is crucial for understanding and interpreting intricate information. A magnifying glass represents the close examination required to dissect complex subjects, revealing hidden
Free with trial Explore the intricate world of signal processing with this captivating image. Dynamic waveform patterns, oscillating digital signals, and a deep blue backdrop illustrate the core concepts driving modern technology. The image represents the sophisticated processes involved in manipulating audio and data, from initial capture and encoding to complex analyses and subsequent transmission. Witness. Complex classification illustrations Advanced Audio and Data Processing Visualizing Complex Signal Manipulation Techniques in Modern Technology. Explore the intricate world of signal processing with this captivating image. Dynamic waveform patterns, oscillating digital signals, and a deep blue backdrop illustrate the core concepts driving modern technology. The image represents the sophisticated processes involved in manipulating audio and data, from initial capture and encoding to complex analyses and subsequent transmission. Witness
Free with trial The image depicts a person sitting at a desk, surrounded by various technological devices and screens displaying complex data sets. The person appears to be deep in thought, engaged in the process of exploring and analyzing the data using data science and big data technology. The image conveys the concept of the importance of utilizing advanced technology and artificial intelligence in business analytics and machine learning. It highlights the need for businesses to stay ahead of the curve by investing in cutting-edge tools and techniques for data analysis and visualization. The image also conveys the message that navigating complex data sets requires expertise and skill, and that data science and big data technology can provide valuable insights and opportunities for growth and innovation. Complex classification illustrations Exploring Complex Data Sets with Data Science and Big Data Technology: An Analysis of Computing, Visualization, and Artificial Int. The image depicts a person sitting at a desk, surrounded by various technological devices and screens displaying complex data sets. The person appears to be deep in thought, engaged in the process of exploring and analyzing the data using data science and big data technology. The image conveys the concept of the importance of utilizing advanced technology and artificial intelligence in business analytics and machine learning. It highlights the need for businesses to stay ahead of the curve by investing in cutting-edge tools and techniques for data analysis and visualization. The image also conveys the message that navigating complex data sets requires expertise and skill, and that data science and big data technology can provide valuable insights and opportunities for growth and innovation.
Free with trial This high-quality technical illustration provides a clear, step-by-step breakdown of Supervised Learning, the cornerstone of modern Machine Learning. Designed for educators, tech bloggers, and data scientists, the visual explains how labeled data serves as an "answer key" to train algorithms for high-accuracy predictions. From classification (like spam filters) to regression (like price forecasting), this diagram simplifies complex AI training phases into an intuitive flow. Perfect for presentations on Data Science, Neural Networks, and the future of Autonomous Integration. Complex classification illustrations Which type of machine learning is trained on labeled data. This high-quality technical illustration provides a clear, step-by-step breakdown of Supervised Learning, the cornerstone of modern Machine Learning. Designed for educators, tech bloggers, and data scientists, the visual explains how labeled data serves as an "answer key" to train algorithms for high-accuracy predictions.From classification (like spam filters) to regression (like price forecasting), this diagram simplifies complex AI training phases into an intuitive flow. Perfect for presentations on Data Science, Neural Networks, and the future of Autonomous Integration.
Free with trial Visualize the intricate dance of data within a mesmerizing network of interconnected nodes. Pulses of light and swirling patterns on a futuristic dashboard represent the powerful simplification of complex datasets. This dynamic display showcases the application of sophisticated data summarization methods, demonstrating how algorithms transform massive amounts of information into easily digestible. Complex classification illustrations Unveiling the Essence of Big Data How Futuristic Dashboards Simplify Complex Interconnected Networks through Advanced. Visualize the intricate dance of data within a mesmerizing network of interconnected nodes. Pulses of light and swirling patterns on a futuristic dashboard represent the powerful simplification of complex datasets. This dynamic display showcases the application of sophisticated data summarization methods, demonstrating how algorithms transform massive amounts of information into easily digestible
Free with trial Janet's Helicoidal Classification. Complex classification illustrations An intricate, 3D representation of Helicoidal Classification, futuristic background with rainbow colors. Janet's Helicoidal Classification
Free with trial Janet's Helicoidal Classification. Complex classification illustrations An intricate, 3D representation of Helicoidal Classification, futuristic background with rainbow colors. Janet's Helicoidal Classification
Free with trial This image depicts a detailed neural network architecture diagram showcasing various layers and operations, including input, hidden, and output layers, along with pooling, convolution, softmax, and other transformations, illustrating the flow of data through the network in a structured and interconnected manner. The diagram highlights the intricate relationships between different components, such. Complex classification illustrations Complex Neural Network Diagram with Multiple Layers and Operations. This image depicts a detailed neural network architecture diagram showcasing various layers and operations, including input, hidden, and output layers, along with pooling, convolution, softmax, and other transformations, illustrating the flow of data through the network in a structured and interconnected manner. The diagram highlights the intricate relationships between different components, such
Free with trial Janet's Helicoidal Classification. Complex classification illustrations An intricate, 3D representation of Helicoidal Classification, futuristic background with rainbow colors. Janet's Helicoidal Classification
Free with trial Janet's Helicoidal Classification. Complex classification illustrations An intricate, 3D representation of Helicoidal Classification, futuristic background with rainbow colors. Janet's Helicoidal Classification
Free with trial Janet's Helicoidal Classification. Complex classification illustrations An intricate, 3D representation of Helicoidal Classification, futuristic background with rainbow colors. Janet's Helicoidal Classification
Free with trial The image displays a large hierarchical clustering dendrogram, illustrating the structure and relationships within a dataset. Each branch represents clusters of data points merging at different levels of similarity, forming a tree-like diagram. The dense vertical and horizontal lines suggest a high volume of interconnected data, commonly used in statistical analysis, bioinformatics, and data. Complex classification illustrations Hierarchical clustering dendrogram of complex data relationships. The image displays a large hierarchical clustering dendrogram, illustrating the structure and relationships within a dataset. Each branch represents clusters of data points merging at different levels of similarity, forming a tree-like diagram. The dense vertical and horizontal lines suggest a high volume of interconnected data, commonly used in statistical analysis, bioinformatics, and data
Free with trial The Naive Bayes icon is a symbol representing a powerful probabilistic algorithm that enables classification and prediction using Bayes theorem. This mathematical technique is widely used in machine learning and natural language processing to solve complex problems by providing accurate predictions and identifying patterns in data. The icon features a stylized representation of Bayes theorem, with arrows pointing from the evidence to the hypothesis, and a simple yet elegant design that conveys the simplicity and effectiveness of the Naive Bayes algorithm. It symbolizes the power of data-driven approaches to solve problems and make informed decisions. Complex classification illustrations A Naive Bayes icon representing the probabilistic algorithm used for classification and prediction created with Generative AI. The Naive Bayes icon is a symbol representing a powerful probabilistic algorithm that enables classification and prediction using Bayes theorem. This mathematical technique is widely used in machine learning and natural language processing to solve complex problems by providing accurate predictions and identifying patterns in data. The icon features a stylized representation of Bayes theorem, with arrows pointing from the evidence to the hypothesis, and a simple yet elegant design that conveys the simplicity and effectiveness of the Naive Bayes algorithm. It symbolizes the power of data-driven approaches to solve problems and make informed decisions.
Free with trial The Naive Bayes icon is a symbol representing a powerful probabilistic algorithm that enables classification and prediction using Bayes theorem. This mathematical technique is widely used in machine learning and natural language processing to solve complex problems by providing accurate predictions and identifying patterns in data. The icon features a stylized representation of Bayes theorem, with arrows pointing from the evidence to the hypothesis, and a simple yet elegant design that conveys the simplicity and effectiveness of the Naive Bayes algorithm. It symbolizes the power of data-driven approaches to solve problems and make informed decisions. Complex classification illustrations A Naive Bayes icon representing the probabilistic algorithm used for classification and prediction created with Generative AI. The Naive Bayes icon is a symbol representing a powerful probabilistic algorithm that enables classification and prediction using Bayes theorem. This mathematical technique is widely used in machine learning and natural language processing to solve complex problems by providing accurate predictions and identifying patterns in data. The icon features a stylized representation of Bayes theorem, with arrows pointing from the evidence to the hypothesis, and a simple yet elegant design that conveys the simplicity and effectiveness of the Naive Bayes algorithm. It symbolizes the power of data-driven approaches to solve problems and make informed decisions.
Free with trial The Naive Bayes icon is a symbol representing a powerful probabilistic algorithm that enables classification and prediction using Bayes theorem. This mathematical technique is widely used in machine learning and natural language processing to solve complex problems by providing accurate predictions and identifying patterns in data. The icon features a stylized representation of Bayes theorem, with arrows pointing from the evidence to the hypothesis, and a simple yet elegant design that conveys the simplicity and effectiveness of the Naive Bayes algorithm. It symbolizes the power of data-driven approaches to solve problems and make informed decisions. Complex classification illustrations A Naive Bayes icon representing the probabilistic algorithm used for classification and prediction created with Generative AI. The Naive Bayes icon is a symbol representing a powerful probabilistic algorithm that enables classification and prediction using Bayes theorem. This mathematical technique is widely used in machine learning and natural language processing to solve complex problems by providing accurate predictions and identifying patterns in data. The icon features a stylized representation of Bayes theorem, with arrows pointing from the evidence to the hypothesis, and a simple yet elegant design that conveys the simplicity and effectiveness of the Naive Bayes algorithm. It symbolizes the power of data-driven approaches to solve problems and make informed decisions.
Free with trial Complex DNA double helix with fractal geometric patterns and shapes. Complex classification illustrations Intricate DNA helix with fractal patterns. Complex DNA double helix with fractal geometric patterns and shapes
Free with trial The support machine (SVM) icon is a symbol of the powerful supervised learning algorithm that is used for classification and regression analysis. With its ability to analyze complex data sets and identify patterns, the SVM algorithm is essential for predictive modeling in fields such as medicine, finance, and engineering. This icon serves as a reminder of the value of SVM in machine learning and the vital role it plays in solving real-world problems. Complex classification illustrations A Support machine icon representing the supervised learning algorithm used for classification created with Generative AI. The support machine (SVM) icon is a symbol of the powerful supervised learning algorithm that is used for classification and regression analysis. With its ability to analyze complex data sets and identify patterns, the SVM algorithm is essential for predictive modeling in fields such as medicine, finance, and engineering. This icon serves as a reminder of the value of SVM in machine learning and the vital role it plays in solving real-world problems.
Free with trial The support machine (SVM) icon is a symbol of the powerful supervised learning algorithm that is used for classification and regression analysis. With its ability to analyze complex data sets and identify patterns, the SVM algorithm is essential for predictive modeling in fields such as medicine, finance, and engineering. This icon serves as a reminder of the value of SVM in machine learning and the vital role it plays in solving real-world problems. Complex classification illustrations A Support machine icon representing the supervised learning algorithm used for classification created with Generative AI. The support machine (SVM) icon is a symbol of the powerful supervised learning algorithm that is used for classification and regression analysis. With its ability to analyze complex data sets and identify patterns, the SVM algorithm is essential for predictive modeling in fields such as medicine, finance, and engineering. This icon serves as a reminder of the value of SVM in machine learning and the vital role it plays in solving real-world problems.
Free with trial The support machine (SVM) icon is a symbol of the powerful supervised learning algorithm that is used for classification and regression analysis. With its ability to analyze complex data sets and identify patterns, the SVM algorithm is essential for predictive modeling in fields such as medicine, finance, and engineering. This icon serves as a reminder of the value of SVM in machine learning and the vital role it plays in solving real-world problems. Complex classification illustrations A Support machine icon representing the supervised learning algorithm used for classification created with Generative AI. The support machine (SVM) icon is a symbol of the powerful supervised learning algorithm that is used for classification and regression analysis. With its ability to analyze complex data sets and identify patterns, the SVM algorithm is essential for predictive modeling in fields such as medicine, finance, and engineering. This icon serves as a reminder of the value of SVM in machine learning and the vital role it plays in solving real-world problems.
Free with trial A meticulously organized tray filled with colorful plastic cylinders. The vibrant rainbow of components suggests precision, order, and diversity, representing concepts of manufacturing, systematic assembly, or the building blocks of a complex project. Complex classification illustrations Organized Array of Colorful Plastic Cylinders. A meticulously organized tray filled with colorful plastic cylinders. The vibrant rainbow of components suggests precision, order, and diversity, representing concepts of manufacturing, systematic assembly, or the building blocks of a complex project
Free with trial The Classification icon depicts the method of sorting and organizing data into distinct categories based on specific characteristics or criteria. It is often used in data analysis and management to simplify complex information into manageable groups for easier understanding and decision-making. With this icon, users can quickly identify and classify data, improving their workflow productivity and data accuracy. Complex classification illustrations A Classification icon representing the categorization of data into distinct classes based on specific created with Generative AI. The Classification icon depicts the method of sorting and organizing data into distinct categories based on specific characteristics or criteria. It is often used in data analysis and management to simplify complex information into manageable groups for easier understanding and decision-making. With this icon, users can quickly identify and classify data, improving their workflow productivity and data accuracy.
Free with trial The Classification icon depicts the method of sorting and organizing data into distinct categories based on specific characteristics or criteria. It is often used in data analysis and management to simplify complex information into manageable groups for easier understanding and decision-making. With this icon, users can quickly identify and classify data, improving their workflow productivity and data accuracy. Complex classification illustrations A Classification icon representing the categorization of data into distinct classes based on specific created with Generative AI. The Classification icon depicts the method of sorting and organizing data into distinct categories based on specific characteristics or criteria. It is often used in data analysis and management to simplify complex information into manageable groups for easier understanding and decision-making. With this icon, users can quickly identify and classify data, improving their workflow productivity and data accuracy.
Free with trial The Classification icon depicts the method of sorting and organizing data into distinct categories based on specific characteristics or criteria. It is often used in data analysis and management to simplify complex information into manageable groups for easier understanding and decision-making. With this icon, users can quickly identify and classify data, improving their workflow productivity and data accuracy. Complex classification illustrations A Classification icon representing the categorization of data into distinct classes based on specific created with Generative AI. The Classification icon depicts the method of sorting and organizing data into distinct categories based on specific characteristics or criteria. It is often used in data analysis and management to simplify complex information into manageable groups for easier understanding and decision-making. With this icon, users can quickly identify and classify data, improving their workflow productivity and data accuracy.
Free with trial AI Pattern Recognition icon. Vector thin line illustration on a round dark blue background. Symbolizes the intelligent analysis (magnifying glass circuits) and classification of complex data or visual objects (geometric shapes. Complex classification vectors AI Pattern Recognition icon. Vector thin line illustration
Free with trial This detailed scientific illustration unveils the complex vascular system within a leaf, showcasing diverse venation patterns. Observe the intricate arrangement of leaf veins, crucial for understanding plant structure and function. The visual representation highlights the relationship between leaf architecture and plant classification. From the simple pinnate venation to the more complex. Complex classification illustrations Unveiling the Intricate Network A Deep Dive into Leaf Venation Patterns for Plant Identification and Understanding. This detailed scientific illustration unveils the complex vascular system within a leaf, showcasing diverse venation patterns. Observe the intricate arrangement of leaf veins, crucial for understanding plant structure and function. The visual representation highlights the relationship between leaf architecture and plant classification. From the simple pinnate venation to the more complex
Free with trial Levels of ecological organization with living organism division outline concept. Labeled educational individual, population, ecosystem, biome and biosphere classification system vector illustration. Complex classification vectors Levels of ecological organization with organism division outline concept. Levels of ecological organization with living organism division outline concept. Labeled educational individual, population, ecosystem, biome and biosphere classification system vector illustration.
Free with trial Illustration showing the challenge of maintaining consistent metadata taxonomy across complex digital systems and the solution through structured taxonomy templates and automated migration tools. Complex classification illustrations . illustration showing the challenge of maintaining consistent metadata taxonomy across complex digital systems and the solution through structured taxonomy templates and automated migration tools.
Free with trial A top-down aerial drone photograph reveals the fascinating geometric complexity of a large railway marshalling yard. Dozens of parallel steel rails branch and converge through complex switching arrangements, with freight wagons and cargo cars in assorted colors arranged in organized rows across the yard. Switching locomotives are visible navigating between tracks. Golden morning light rakes across the scene, casting long shadows between the rows of wagons and highlighting the silver gleam of the rails. This image is ideal for transport, industry, infrastructure, and logistics editorial use. Complex classification illustrations Aerial Railway Marshalling Yard Tracks Freight Wagons Pattern. A top-down aerial drone photograph reveals the fascinating geometric complexity of a large railway marshalling yard. Dozens of parallel steel rails branch and converge through complex switching arrangements, with freight wagons and cargo cars in assorted colors arranged in organized rows across the yard. Switching locomotives are visible navigating between tracks. Golden morning light rakes across the scene, casting long shadows between the rows of wagons and highlighting the silver gleam of the rails. This image is ideal for transport, industry, infrastructure, and logistics editorial use.
Free with trial Bodygraph concept icon. Energy center geometric chart. Personality type classification. Human design system idea thin line illustration. Vector isolated outline RGB color drawing. Editable stroke. Complex classification vectors Bodygraph concept icon
Free with trial Digital biobanks soft blue concept icon. Online platforms with bio information. Biorepository classification. Round shape line illustration. Abstract idea. Graphic design. Easy to use in article. Complex classification vectors Digital biobanks soft blue concept icon