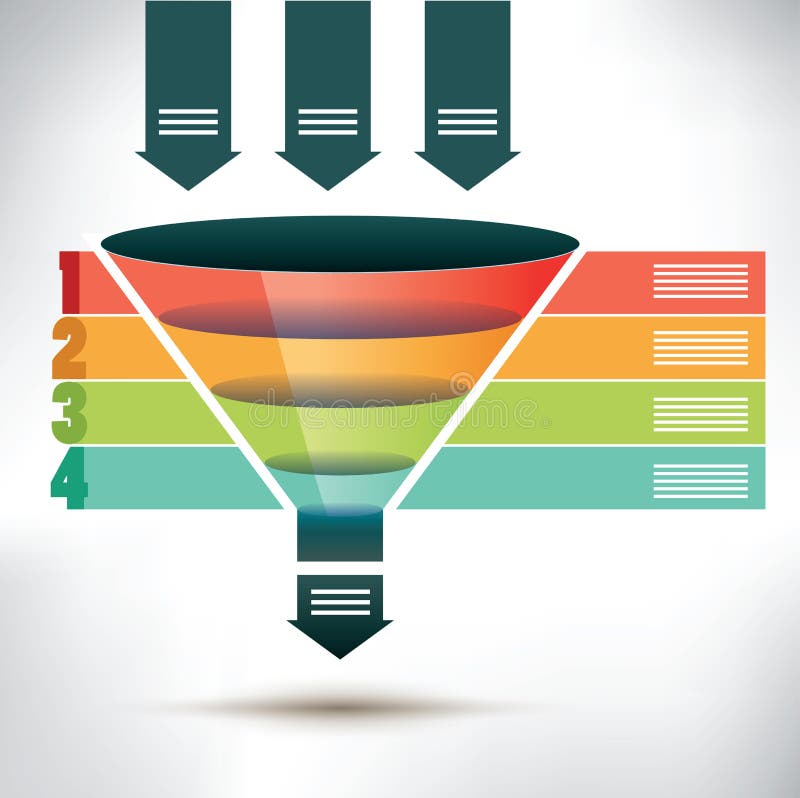
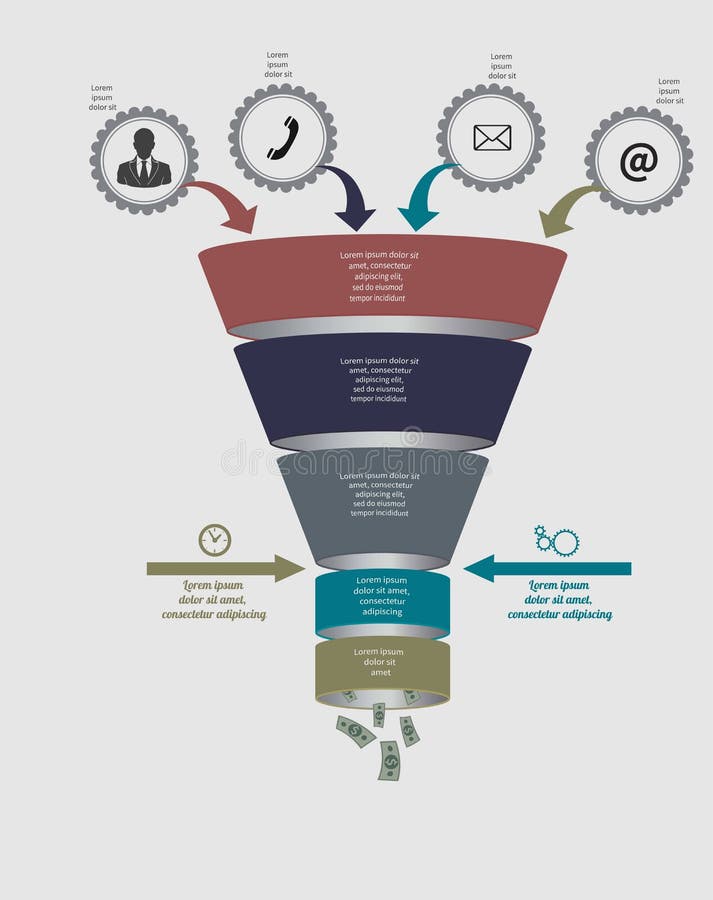
Free with trial Funnel flow chart template with three arrows showing input into the funnel passing four colored banners to organize, condense and streamline into one output arrow below, vector illustration. Convergence infographic vectors Funnel flow chart template
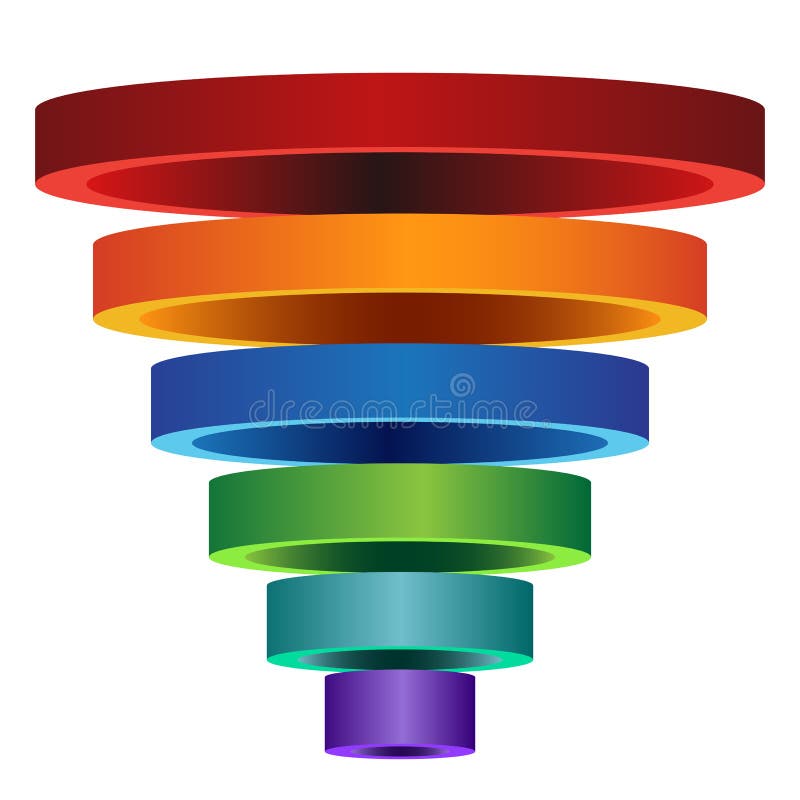
Free with trial An image of a 3D Segmented Funnel Chart with isolated color coded rings. Convergence infographic vectors 3D Segmented Funnel Chart
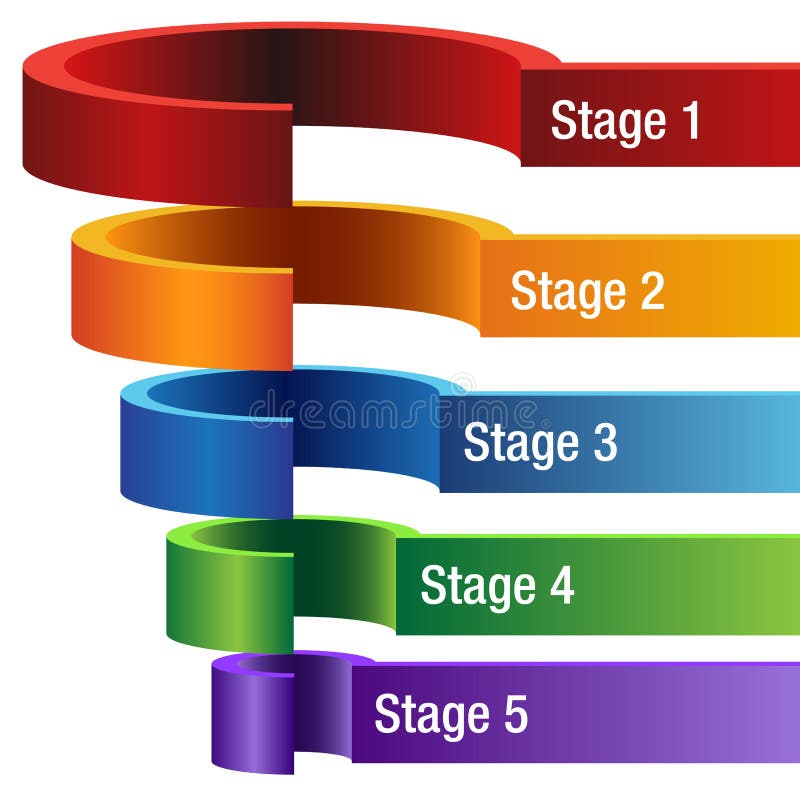
Free with trial An image of a 3D Five Stage Segmented cut away Funnel Chart with isolated color coded rings. Convergence infographic vectors 3D Five Stage Segmented Funnel Chart. An image of a 3D Five Stage Segmented cut away Funnel Chart with isolated color coded rings.
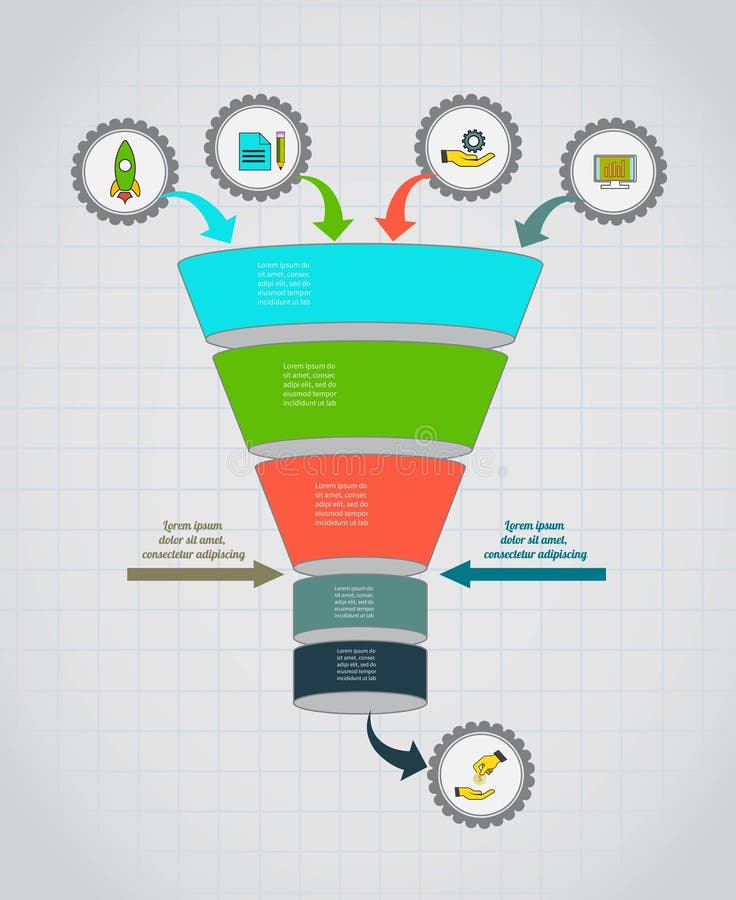
Free with trial Funnel flow chart. Infographic template. Design for presentation, round chart or diagram. Concept for 5 steps, parts or options. Vector EPS10. Convergence infographic vectors Funnel flow chart. Infographic template . Design concept for presentation, round chart or diagram. Vector EPS10. Funnel flow chart. Infographic template . Design for presentation, round chart or diagram. Concept for 5 steps, parts or options. Vector EPS10.
Free with trial Funnel flow chart. Vector infographic. Template for diagram, graph, presentation and chart. Business concept with options, parts, steps or processes. Data visualization. Convergence infographic vectors Funnel flow chart. Vector Template for diagram. Funnel flow chart. Vector infographic. Template for diagram, graph, presentation and chart. Business concept with options, parts, steps or processes. Data visualization.
Free with trial Layout for your options or steps. Abstract template for background. Convergence infographic vectors Social vector business teamwork infographic. Layout for your options or steps. Abstract template for background.
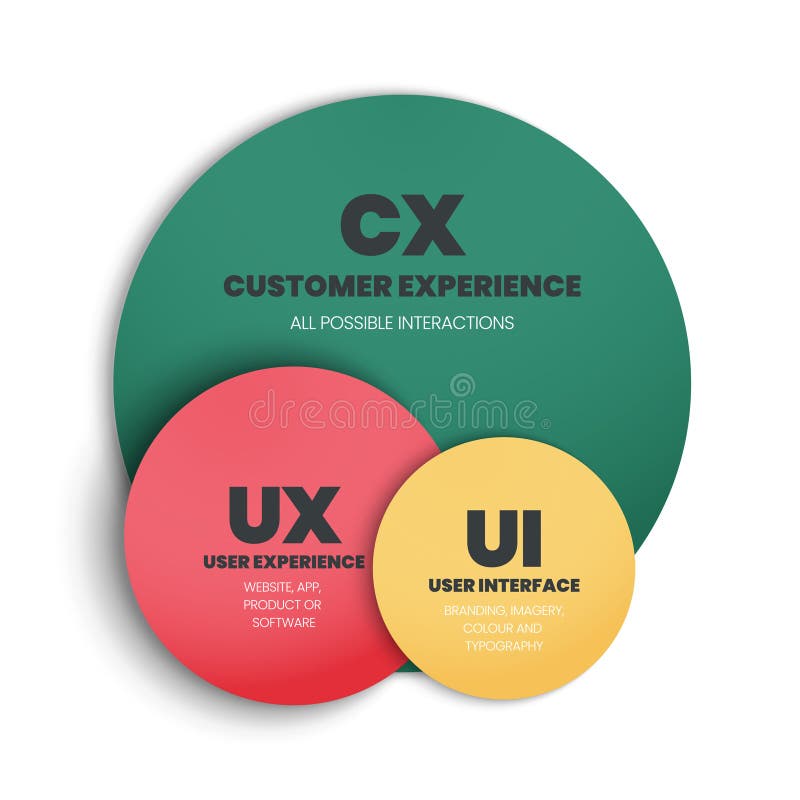
Free with trial The differences or comparison between cx or customer experience and UX or user experience and UI or user interface vector template and presentation. The Venn diagram is an infographic for marketing. Convergence infographic vectors The differences or comparison between cx or customer experience and UX or user experience and UI or user interface vector template
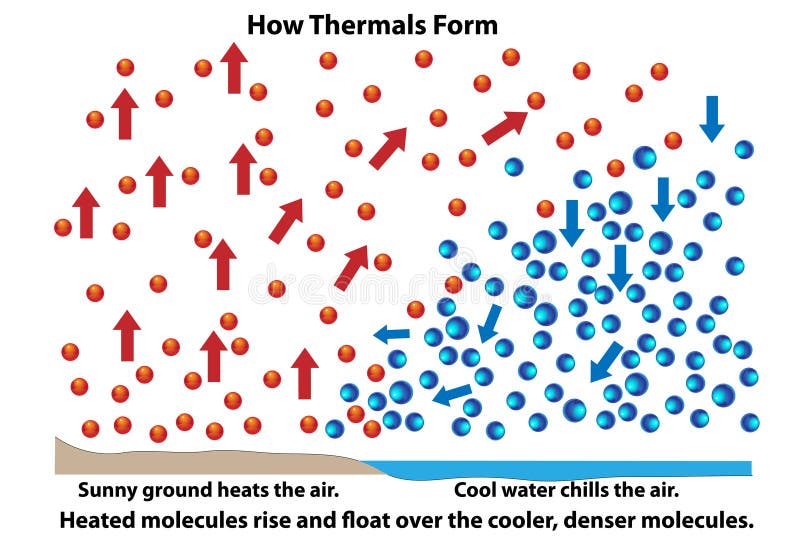
Free with trial Cloud formation science diagram. How clouds form as sunlight warms the ground. Air rises forming themals and then cools and condenses. Convergence infographic vectors Cloud Formation as thermals form. Cloud formation science diagram. How clouds form as sunlight warms the ground. Air rises forming themals and then cools and condenses.
Free with trial How thermals form. Science diagram showing how molecules react during heating and cooling over land or water. Heated molecules rise and float over the cooler, denser molecules. Convergence infographic vectors Heated Molecules Rise and Create Thermals. How thermals form. Science diagram showing how molecules react during heating and cooling over land or water. Heated molecules rise and float over the cooler, denser molecules.
Free with trial Double Diamond design process model with two diamonds vector. Convergence infographic vectors Double Diamond design process model with two diamonds
Free with trial Minimalistic artwork of a light bulb filled with gears, symbolizing the convergence of ideas, creativity, and innovation. Perfect for business, technology, and conceptual themes. Convergence infographic illustrations Minimalistic illustration of a light bulb with gears representing ideas and innovation. Minimalistic artwork of a light bulb filled with gears, symbolizing the convergence of ideas, creativity, and innovation. Perfect for business, technology, and conceptual themes.
Free with trial A dynamic infographic illustrating strategic convergence. Bold arrows point inward on a complex circular diagram, symbolizing data analysis, process optimization, and focusing on a central goal. Convergence infographic vectors Strategic Data Convergence and Analysis Diagram. A dynamic infographic illustrating strategic convergence. Bold arrows point inward on a complex circular diagram, symbolizing data analysis, process optimization, and focusing on a central goal
Free with trial Explore the dynamic interplay of data streams in this captivating long exposure infographic. The abstract visualization showcases the convergence of various business data points, revealing hidden patterns and trends within complex datasets. Imagine a mesmerizing dance of numbers, where lines and shapes intertwine to reveal the core insights impacting your company's performance. This innovative. Convergence infographic illustrations Unveiling Business Insights A Long Exposure Visualization of Data Convergence in Abstract Business Analytics. Explore the dynamic interplay of data streams in this captivating long exposure infographic. The abstract visualization showcases the convergence of various business data points, revealing hidden patterns and trends within complex datasets. Imagine a mesmerizing dance of numbers, where lines and shapes intertwine to reveal the core insights impacting your company's performance. This innovative
Free with trial Dynamic radial infographic template with six colorful wavy arrows converging into a central circle, perfect for illustrating convergence, inputs, or multi-path strategies. Vector illustration. Convergence infographic vectors Dynamic radial infographic template with six colorful wavy arrows . Vector illustration. Dynamic radial infographic template with six colorful wavy arrows converging into a central circle, perfect for illustrating convergence, inputs, or multi-path strategies. Vector illustration.
Free with trial Circular infographic highlighting "FINTECH" at the center, with the text "Financial Technology" beneath. Surrounding icons represent various financial services and technologies: mobile banking, security, analytics, digital payments, and more. These symbols are interconnected by network lines on a dark blue circuit board background, symbolizing digital connectivity and innovation in financial services. The layout emphasizes the integration and convergence of technology in financial sectors. Convergence infographic illustrations Revolutionizing Financial Services Through Innovative Technology and Digital Transformation. Circular infographic highlighting "FINTECH" at the center, with the text "Financial Technology" beneath. Surrounding icons represent various financial services and technologies: mobile banking, security, analytics, digital payments, and more. These symbols are interconnected by network lines on a dark blue circuit board background, symbolizing digital connectivity and innovation in financial services. The layout emphasizes the integration and convergence of technology in financial sectors.
Free with trial A minimalist vector icon featuring a central black circle surrounded by two horizontal arrows and four diagonal lines, all pointing inwards. This abstract graphic symbolizes focus, convergence, attention, or a target point. Ideal for user interface elements, web design, mobile applications, presentations, or any project requiring a clear visual representation of centralization, emphasis, or bringing elements together. Its clean, flat design ensures versatility and readability. Convergence infographic vectors Focus Point Convergence Icon. A minimalist vector icon featuring a central black circle surrounded by two horizontal arrows and four diagonal lines, all pointing inwards. This abstract graphic symbolizes focus, convergence, attention, or a target point. Ideal for user interface elements, web design, mobile applications, presentations, or any project requiring a clear visual representation of centralization, emphasis, or bringing elements together. Its clean, flat design ensures versatility and readability.
Free with trial An abstract illustration representing the convergence of four distinct elements towards a central, integrated core. Convergence infographic vectors Converging Elements on a Central Core Infographic. An abstract illustration representing the convergence of four distinct elements towards a central, integrated core
Free with trial This detailed infographic illustrates the complex process of an Artificial Intelligence neural network. It visually represents the stages from data input and initialization, through algorithm training with a neural network, weight adjustment, and backpropagation. The diagram then progresses to pattern learning, convergence, and feature space visualization using glowing geometric shapes, culminating in the final optimized model and accurate prediction, such as image classification. Ideal for explaining AI and machine learning concepts in a modern, digital context. Convergence infographic illustrations AI Neural Network Training and Prediction Process Diagram. This detailed infographic illustrates the complex process of an Artificial Intelligence neural network. This detailed infographic illustrates the complex process of an Artificial Intelligence neural network. It visually represents the stages from data input and initialization, through algorithm training with a neural network, weight adjustment, and backpropagation. The diagram then progresses to pattern learning, convergence, and feature space visualization using glowing geometric shapes, culminating in the final optimized model and accurate prediction, such as image classification. Ideal for explaining AI and machine learning concepts in a modern, digital context.
Free with trial Illustration shows arrows pointing center to orange circle. Business concept strategy, alignment, convergence, progress success, organization, teamwork. Represents precision, development. Convergence infographic illustrations Illustration shows arrows pointing center to orange circle. Business concept strategy, alignment, convergence, progress, success. Illustration shows arrows pointing center to orange circle. Business concept strategy, alignment, convergence, progress success, organization, teamwork. Represents precision, development.
Free with trial This minimalist whiteboard design effectively showcases the process of idea convergence. The central theme is clearly communicated by the dynamic swirling arrows, which visually represent the merging and centralization of various thoughts and concepts. The clean, white background allows the focus to remain entirely on the interconnected ideas. The simplicity of the design emphasizes the core. Convergence infographic illustrations Visualizing Idea Convergence A Minimalist Whiteboard Design Illustrates the Centralization of Thoughts Through Dynamic. This minimalist whiteboard design effectively showcases the process of idea convergence. The central theme is clearly communicated by the dynamic swirling arrows, which visually represent the merging and centralization of various thoughts and concepts. The clean, white background allows the focus to remain entirely on the interconnected ideas. The simplicity of the design emphasizes the core
Free with trial Post-AI Internet Convergence Diagram with AI, Blockchain, IoT, and Privacy Technologies in a Futuristic Technology Illustration. Convergence infographic illustrations Post-AI Internet Convergence Diagram
Free with trial A dynamic and colorful eight-pointed starburst, representing the convergence of diverse ideas into a unified whole. Convergence infographic vectors Vibrant 3D Starburst Infographic Element. A dynamic and colorful eight-pointed starburst, representing the convergence of diverse ideas into a unified whole
Free with trial This infographic illustrates a modern workspace featuring a desk, chair, and computer, emphasizing the vital role of AI in the creative process. Explore how these elements converge to drive innovation, blending technology with human ingenuity for impactful solutions. Convergence infographic illustrations A Bright Studio Infographic Showcasing the Intersection of Technology, Design, and Human Creativity for Innovation. This infographic illustrates a modern workspace featuring a desk, chair, and computer, emphasizing the vital role of AI in the creative process. Explore how these elements converge to drive innovation, blending technology with human ingenuity for impactful solutions
Free with trial An infographic illustrating the concept of Synthetic Reality and its various forms, including Virtual Reality (VR), Augmented Reality (AR), Mixed Reality (MR), and Digital Integration. The central theme highlights the convergence of technologies creating new, hybrid forms of human experience. Each section features a vibrant, futuristic illustration: VR shows a person in a headset immersed in a fantastical digital world AR depicts a hand holding a smartphone overlaying digital information onto a city street MR displays a person interacting with virtual 3D models in a physical room and Digital Integration visualizes a brain connected to a cloud and network, symbolizing seamless blending of experiences. The overall design features glowing neon circuit board patterns on a dark background, emphasizing technology and connectivity. Convergence infographic illustrations Synthetic Reality Blurring the Lines of Digital and Physical Worlds. An infographic illustrating the concept of Synthetic Reality and its various forms, including Virtual Reality (VR), Augmented Reality (AR), Mixed Reality (MR), and Digital Integration. The central theme highlights the convergence of technologies creating new, hybrid forms of human experience. Each section features a vibrant, futuristic illustration: VR shows a person in a headset immersed in a fantastical digital world AR depicts a hand holding a smartphone overlaying digital information onto a city street MR displays a person interacting with virtual 3D models in a physical room and Digital Integration visualizes a brain connected to a cloud and network, symbolizing seamless blending of experiences. The overall design features glowing neon circuit board patterns on a dark background, emphasizing technology and connectivity.
Free with trial Two parallel lines with arrows moving inward from each end to show convergence. Convergence infographic vectors Two parallel lines with two arrows pointing towards each other. Two parallel lines with arrows moving inward from each end to show convergence.
Free with trial Four arrows pointing inward grunge doodle design element. Convergence focus. Centralization target. Handdrawn pointer. Dynamic sketchy rough direction clipart. Distressed black ink line symbol. Convergence infographic vectors Four arrows pointing inward grunge doodle design element
Free with trial Four arrows pointing inward bold thick stroke graphic element. Convergence focus. Centralization target. Expressive grunge marker highlight pointer. Ink rough direction. Vector illustration. Convergence infographic vectors Four arrows pointing inward bold thick stroke graphic element
Free with trial Four arrows pointing inward hand-drawn sketch graphic element. Convergence focus. Centralization target. Doodle direction. Minimal black pointer. Ink freehand symbol. Scribble illustration. Convergence infographic vectors Four arrows pointing inward hand-drawn sketch graphic element
Free with trial A striking 3D rendering showcases a circle of vibrant red arrows, all uniformly pointing inwards towards an unseen central point on a pristine white background. This powerful visual symbolizes focus, convergence, strategy, and collective direction. Ideal for illustrating concepts of teamwork, decision-making, problem-solving, data centralization, or gathering attention towards a core idea in business, technology, or educational contexts. The clean design provides ample copy space. Convergence infographic illustrations Red Arrows Converging to a Central Point. A striking 3D rendering showcases a circle of vibrant red arrows, all uniformly pointing inwards towards an unseen central point on a pristine white background. This powerful visual symbolizes focus, convergence, strategy, and collective direction. Ideal for illustrating concepts of teamwork, decision-making, problem-solving, data centralization, or gathering attention towards a core idea in business, technology, or educational contexts. The clean design provides ample copy space.
Free with trial This modern infographic illustrates the convergence of love, technology, and holiday activities, featuring a couple embracing within a Christmas tree connected to various digital icons via a circuit board pattern. The icons represent elements like shopping, finance, and cloud computing, emphasizing modern interconnected life during the festive season. This conceptual visualization is ideal for. Convergence infographic illustrations Digital Holiday Network and Couple Silhouette. This modern infographic illustrates the convergence of love, technology, and holiday activities, featuring a couple embracing within a Christmas tree connected to various digital icons via a circuit board pattern. The icons represent elements like shopping, finance, and cloud computing, emphasizing modern interconnected life during the festive season. This conceptual visualization is ideal for
Free with trial Abstract arrows radiating from a circle. Business background. Convergence infographic illustrations Convergence Arrows Concept, Idea, Integration, Goal. 3D Render. Abstract arrows radiating from a circle. Business background
Free with trial A stylized black and white image features a circular design composed of multiple arrows pointing inward. The arrows are arranged in a ring formation, creating a dynamic, cyclical effect. The design is clean and modern, suitable for representing concepts such as rotation, feedback, or convergence. The image is set against a plain white background, emphasizing the shape and form of the arrow circle. Convergence infographic vectors Circular Arrow Symbol. A stylized black and white image features a circular design composed of multiple arrows pointing inward. The arrows are arranged in a ring formation, creating a dynamic, cyclical effect. The design is clean and modern, suitable for representing concepts such as rotation, feedback, or convergence. The image is set against a plain white background, emphasizing the shape and form of the arrow circle.
Free with trial A vibrant graphic illustration featuring arrows of various colors (blue, green, yellow) pointing towards a central blue circle. The arrows represent different directions and converging ideas, symbolizing concepts like teamwork, collaboration, focus, and strategic planning. The clean, modern design makes it suitable for business presentations, marketing materials, or any project requiring a visual representation of convergence or direction. Convergence infographic illustrations Arrows Converging on a Central Point. A vibrant graphic illustration featuring arrows of various colors (blue, green, yellow) pointing towards a central blue circle. The arrows represent different directions and converging ideas, symbolizing concepts like teamwork, collaboration, focus, and strategic planning. The clean, modern design makes it suitable for business presentations, marketing materials, or any project requiring a visual representation of convergence or direction.
Free with trial An infographic illustrating the concept of multiple strategies or teams working in synergy. Convergence infographic vectors Strategic Paths Leading to a Success Goal. An infographic illustrating the concept of multiple strategies or teams working in synergy
Free with trial This infographic illustrates the interconnectedness of data-driven business solutions, highlighting how analytics, machine learning, and business intelligence can be visualized within a tree-like structure, emphasizing their roles in decision-making and innovation for organizations. Convergence infographic illustrations Understanding the Roots of Data-Driven Business Solutions for Analytics Machine Learning and Business Intelligence. This infographic illustrates the interconnectedness of data-driven business solutions, highlighting how analytics, machine learning, and business intelligence can be visualized within a tree-like structure, emphasizing their roles in decision-making and innovation for organizations
Free with trial A clean, minimalist vector illustration featuring multiple bold black arrows pointing inwards towards a central, unseen point on a pure white background. This graphic effectively symbolizes concepts such as focus, convergence, centralization, gathering information, merging ideas, or directing attention to a specific area. Ideal for business presentations, infographics, user interface elements, or any design requiring a clear visual representation of coming together or targeting. Convergence infographic vectors Converging Arrows Icon for Focus and Centralization. A clean, minimalist vector illustration featuring multiple bold black arrows pointing inwards towards a central, unseen point on a pure white background. This graphic effectively symbolizes concepts such as focus, convergence, centralization, gathering information, merging ideas, or directing attention to a specific area. Ideal for business presentations, infographics, user interface elements, or any design requiring a clear visual representation of coming together or targeting.
Free with trial Minimalist graphic features eight black arrows converging towards a central point within a square frame. Arrows are arranged symmetrically, with an equal distance between each, pointing inward from the edges. Design is simple with a stark contrast between the black arrows and white background. The overall layout suggests concepts of focus, unity, and strategy through its centralized convergence. Convergence infographic illustrations Minimalist graphic with eight arrows converging at a central point within a square frame, symbolizing focus, unity, and strategic. Minimalist graphic features eight black arrows converging towards a central point within a square frame. Arrows are arranged symmetrically, with an equal distance between each, pointing inward from the edges. Design is simple with a stark contrast between the black arrows and white background. The overall layout suggests concepts of focus, unity, and strategy through its centralized convergence.
Free with trial Capture the spirit of athleticism and innovation with this captivating image showcasing a soccer ball and a smartphone. This dynamic duo perfectly embodies the convergence of sports and technology, offering unparalleled visual appeal for your marketing and branding needs. The image's clean, modern aesthetic provides a blank canvas for your unique message and branding, seamlessly integrating your. Convergence infographic illustrations Fuel Your Brand with This Dynamic Image A Soccer Ball and Smartphone Symbolize the Intersection of Sports and. Capture the spirit of athleticism and innovation with this captivating image showcasing a soccer ball and a smartphone. This dynamic duo perfectly embodies the convergence of sports and technology, offering unparalleled visual appeal for your marketing and branding needs. The image's clean, modern aesthetic provides a blank canvas for your unique message and branding, seamlessly integrating your
Free with trial This infographic visually represents the interconnectedness of key digital domains. A central dark circle connects to four distinct icons: a red triangle with server racks for 'Enterprise', an orange circle with a smartphone for 'Mobitel', a green square with a globe for 'Consumer', and a blue hexagon with a car for 'IoT'. The diagram illustrates how these areas converge and interact, symbolizing digital transformation, connectivity, and modern technological ecosystems. Convergence infographic illustrations Digital Transformation Hub: Enterprise, Mobitel, Consumer, and IoT Integration. This infographic visually represents the interconnectedness of key digital domains. A central dark circle connects to four distinct icons: a red triangle with server racks for 'Enterprise', an orange circle with a smartphone for 'Mobitel', a green square with a globe for 'Consumer', and a blue hexagon with a car for 'IoT'. The diagram illustrates how these areas converge and interact, symbolizing digital transformation, connectivity, and modern technological ecosystems.
Free with trial A modern vector illustration featuring multiple lines merging into a single arrow, symbolizing convergence, data flow, or unified direction. Ideal for infographics, technology concepts, communication, or any design related to consolidation and clear paths. Provides a sleek, forward-moving aesthetic. vector design Generative AI. Convergence infographic vectors Merging Arrows Flow Vector Element for Data & Direction, vector design Generative AI. A modern vector illustration featuring multiple lines merging into a single arrow, symbolizing convergence, data flow, or unified direction. Ideal for infographics, technology concepts, communication, or any design related to consolidation and clear paths. Provides a sleek, forward-moving aesthetic. vector design Generative AI
Free with trial A modern vector icon featuring three lines merging into a bold arrow, symbolizing convergence, streamlined processes, or unified direction. Ideal for infographics, technological flowcharts, communication, or any design representing clarity and progression. The clean lines provide strong visual impact. vector design Generative AI. Convergence infographic vectors Dynamic Merging Arrows Vector Icon for Direction & Process, vector design Generative AI. A modern vector icon featuring three lines merging into a bold arrow, symbolizing convergence, streamlined processes, or unified direction. Ideal for infographics, technological flowcharts, communication, or any design representing clarity and progression. The clean lines provide strong visual impact. vector design Generative AI
Free with trial Minimalist 3D isometric concept showing directional flow and convergence, ideal for business, technology, or workflow presentations and infographics. Convergence infographic vectors 3D isometric arrow merging from two directions on dark base vector illustration. Minimalist 3D isometric concept showing directional flow and convergence, ideal for business, technology, or workflow presentations and infographics
Free with trial Hot red airflow arrows. Heat arrow flow wind stream. Motion speed direction gradient with dynamic blur orange pointers. Split, merge and parallel, divergence convergence vortex. Vector isolated set. Convergence infographic vectors Hot red airflow arrows. Heat arrow flow wind stream. Motion speed direction gradient with dynamic blur orange pointers. Split
Free with trial This infographic provides a captivating isometric view of the intricate interplay between quantum computing, artificial intelligence, and big data technologies. It showcases the interconnected nature of these rapidly evolving fields, demonstrating how they are shaping the future of innovation. Quantum computers, with their unique ability to process vast amounts of information, are depicted. Convergence infographic illustrations Visualizing the Future Isometric Representation of Quantum Computing Artificial Intelligence and Big Data Technologies. This infographic provides a captivating isometric view of the intricate interplay between quantum computing, artificial intelligence, and big data technologies. It showcases the interconnected nature of these rapidly evolving fields, demonstrating how they are shaping the future of innovation. Quantum computers, with their unique ability to process vast amounts of information, are depicted
Free with trial Colorful data convergence with glowing nodes and layered pathways, designed for corporate technology banners, presentation covers, and report openers. The structured center supports hierarchy, while surrounding negative areas provide copy space for headlines, KPIs, or campaign messaging in professional business communication. Convergence infographic illustrations Colorful data convergence for corporate technology banners and presentation cover layouts, AI Generated. Colorful data convergence with glowing nodes and layered pathways, designed for corporate technology banners, presentation covers, and report openers. The structured center supports hierarchy, while surrounding negative areas provide copy space for headlines, KPIs, or campaign messaging in professional business communication.
Free with trial Abstract Financial Chart With Green Focus Business, Finance, And Technology Convergence, Generated by AI. Convergence infographic illustrations Abstract Financial Chart With Green Focus Business, Finance, And Technology Convergence
Free with trial Line art illustration of two arrows and a divider depicting convergence at a central point for business comparison concepts. Convergence infographic vectors Line art illustration of two arrows and a divider depicting convergence at a central point for business comparison concepts
Free with trial A clean, minimalist background featuring a light blue sphere in the center, surrounded by stylized arrows pointing inwards. The arrows are in varying shades of blue, teal, orange and white, creating a visually appealing and modern design. This image is suitable for illustrating concepts such as focus, convergence, direction, or teamwork. It can be used in presentations, websites, or marketing materials. Convergence infographic illustrations Arrows Around a Central Sphere. A clean, minimalist background featuring a light blue sphere in the center, surrounded by stylized arrows pointing inwards. The arrows are in varying shades of blue, teal, orange and white, creating a visually appealing and modern design. This image is suitable for illustrating concepts such as focus, convergence, direction, or teamwork. It can be used in presentations, websites, or marketing materials.
Free with trial A sleek, modern 3D sphere displays a vibrant circular chart, symbolizing the convergence of data analytics and financial strategy. Convergence infographic illustrations Modern 3D Sphere with Financial Data Chart. A sleek, modern 3D sphere displays a vibrant circular chart, symbolizing the convergence of data analytics and financial strategy
Free with trial This abstract illustration represents the convergence of strategy and direction. Convergence infographic vectors Strategic Direction and Goal Setting Concept. This abstract illustration represents the convergence of strategy and direction
Free with trial An illustration representing the convergence of human intellect and technology. Convergence infographic vectors Futuristic Brain Interface for Business Strategy. An illustration representing the convergence of human intellect and technology
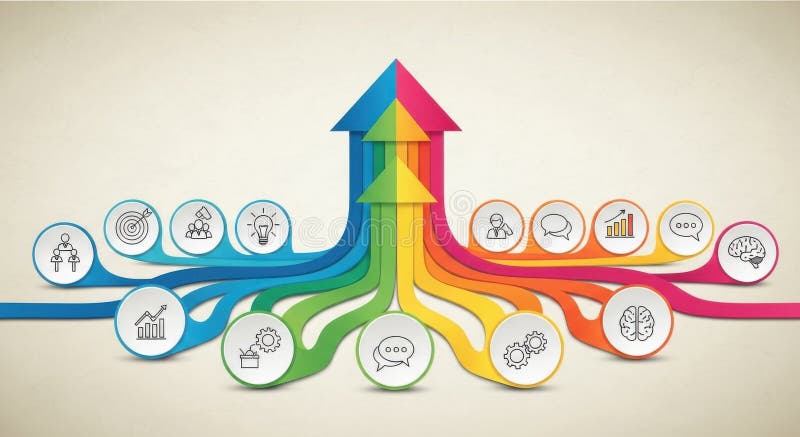
Free with trial A vibrant infographic illustrates a journey of growth, with colorful pathways branching out and converging into a central upward arrow, marked by circular steps. Convergence infographic illustrations Colorful growth and development pathway with circular steps. A vibrant infographic illustrates a journey of growth, with colorful pathways branching out and converging into a central upward arrow, marked by circular steps
Free with trial Colorful abstract illustration featuring arrows in blue, yellow, and orange on a white background. Arrows are interwoven and vary in size. Surrounding elements include circles, spirals, and short dashed lines. The design conveys movement and directionality, resembling a flow chart or infographic. Convergence infographic illustrations Colorful abstract illustration featuring arrows in blue, yellow, and orange on a white background
Free with trial A vibrant infographic illustrates a journey of growth, with colorful pathways branching out and converging into a central upward arrow, marked by circular steps. Convergence infographic illustrations Colorful growth and development pathway with circular steps. A vibrant infographic illustrates a journey of growth, with colorful pathways branching out and converging into a central upward arrow, marked by circular steps
Free with trial Dive into a captivating representation of business analytics. This abstract visualization showcases the intricate workings of data analysis with a mesmerizing sphere of light. The sphere, bathed in a vibrant glow, represents the convergence of various data streams, highlighting the power of information in modern business. Its dynamic, glowing nature symbolizes the ever-evolving nature of data. Convergence infographic illustrations Dynamic Business Analytics Visualization A Glowing Sphere of Data Insights on a Dark Background. Dive into a captivating representation of business analytics. This abstract visualization showcases the intricate workings of data analysis with a mesmerizing sphere of light. The sphere, bathed in a vibrant glow, represents the convergence of various data streams, highlighting the power of information in modern business. Its dynamic, glowing nature symbolizes the ever-evolving nature of data
Free with trial In this stunning visual representation, a simple plant in a pot on a table symbolizes the convergence of AI and creativity. It illustrates how natural elements can inspire innovations that integrate technology with human design to create vibrant and impactful solutions. Convergence infographic illustrations Exploring the Interplay of Nature and Technology in Modern Design Transformations and Innovations. In this stunning visual representation, a simple plant in a pot on a table symbolizes the convergence of AI and creativity. It illustrates how natural elements can inspire innovations that integrate technology with human design to create vibrant and impactful solutions
Free with trial This image showcases a unique pie chart centerpiece featuring a beautiful flower, symbolizing the convergence of AI, creativity, and design. It highlights how these elements come together to inspire innovation, fostering impactful solutions that reflect human ingenuity and technological advancement. Convergence infographic illustrations Exploring the Intersection of AI Creativity and Design Through a Vibrant Pie Chart Illustration. This image showcases a unique pie chart centerpiece featuring a beautiful flower, symbolizing the convergence of AI, creativity, and design. It highlights how these elements come together to inspire innovation, fostering impactful solutions that reflect human ingenuity and technological advancement
Free with trial This captivating abstract image portrays the convergence of science and healthcare through a dynamic interplay of blue hexagon shapes. The intricate merging suggests a harmonious blend of cutting-edge technology with traditional medical practices. The vibrant blue hues evoke a sense of innovation and progress, while the geometric forms symbolize the systematic, precise nature of modern medicine. Convergence infographic illustrations Innovative Medical Technologies Abstract Hexagon Design Visualizing the Future of Science and Healthcare. This captivating abstract image portrays the convergence of science and healthcare through a dynamic interplay of blue hexagon shapes. The intricate merging suggests a harmonious blend of cutting-edge technology with traditional medical practices. The vibrant blue hues evoke a sense of innovation and progress, while the geometric forms symbolize the systematic, precise nature of modern medicine
Free with trial An airplane represents the convergence of aviation and technology in a digital network illustrating global connectivity. Convergence infographic illustrations Airplane navigating digital networks global airport infographic futuristic aerial view aviation technology. An airplane represents the convergence of aviation and technology in a digital network illustrating global connectivity
Free with trial Network visualization, data flow representation, abstract connectivity diagram, modern infographic element, technology concept. Convergence infographic vectors Minimalist vector design of interconnected lines and dots, red highlights emphasize key nodes in network structure. Network visualization, data flow representation, abstract connectivity diagram, modern infographic element, technology concept
Free with trial This infographic illustrates the integration of healthcare advancements, biotech innovations, and effective responses to COVID-19. It focuses on digital health solutions, vaccine development strategies, and the role of AI diagnostics in modern medicine's evolution during the pandemic. Convergence infographic illustrations Exploring the Convergence of Healthcare Innovations and COVID-19 Responses Through Digital Health Infographics. This infographic illustrates the integration of healthcare advancements, biotech innovations, and effective responses to COVID-19. It focuses on digital health solutions, vaccine development strategies, and the role of AI diagnostics in modern medicine's evolution during the pandemic
Free with trial This captivating abstract image showcases a geometric medical cross design, meticulously crafted with a dynamic interplay of vibrant colors and intricate patterns. The design effectively represents the convergence of medicine and science, evoking a sense of innovation and cutting-edge healthcare advancements. The bold, contrasting colors and complex shapes create a visually engaging backdrop. Convergence infographic illustrations Dynamic Geometric Cross Design A Vibrant Abstract Representation of Medical Science and Innovation for Healthcare. This captivating abstract image showcases a geometric medical cross design, meticulously crafted with a dynamic interplay of vibrant colors and intricate patterns. The design effectively represents the convergence of medicine and science, evoking a sense of innovation and cutting-edge healthcare advancements. The bold, contrasting colors and complex shapes create a visually engaging backdrop
Free with trial This captivating close-up image showcases a glowing medical cross superimposed on a miniature microchip. The vibrant illumination evokes a powerful visual metaphor for the convergence of healthcare and advanced technology. This stunning visual represents the transformative potential of integrated medical solutions, highlighting the future of diagnostics, treatment, and personalized care. The. Convergence infographic illustrations Illuminating the Future of Healthcare A Glowing Medical Cross on a Microchip Symbolizing CuttingEdge Health Technology. This captivating close-up image showcases a glowing medical cross superimposed on a miniature microchip. The vibrant illumination evokes a powerful visual metaphor for the convergence of healthcare and advanced technology. This stunning visual represents the transformative potential of integrated medical solutions, highlighting the future of diagnostics, treatment, and personalized care. The
Free with trial Dive into the dynamic world of entertainment with this captivating 3D infographic. Visualize the evolving landscape of the industry, examining key sectors like video games, virtual reality, and augmented reality. The interactive chart allows for a deep exploration of market trends, revenue projections, and technological advancements. Discover compelling insights into the growth of digital. Convergence infographic illustrations Interactive 3D Visualization of the Entertainment Industry Exploring Trends in Video Games Virtual Reality and Beyond. Dive into the dynamic world of entertainment with this captivating 3D infographic. Visualize the evolving landscape of the industry, examining key sectors like video games, virtual reality, and augmented reality. The interactive chart allows for a deep exploration of market trends, revenue projections, and technological advancements. Discover compelling insights into the growth of digital
Free with trial Human hands delicately interact with a futuristic transparent screen, illustrating the convergence of resource sharing and artificial intelligence for enhanced efficiency. This conceptual image portrays a collaborative network where AI optimizes data flow within a digital ecosystem. The scene evokes a sense of future-forward innovation, ideal for projects visualizing business strategies, data. Convergence infographic illustrations Human hands interact with a futuristic transparent screen displaying concepts of resource sharing and artificial intelligence. Human hands delicately interact with a futuristic transparent screen, illustrating the convergence of resource sharing and artificial intelligence for enhanced efficiency. This conceptual image portrays a collaborative network where AI optimizes data flow within a digital ecosystem. The scene evokes a sense of future-forward innovation, ideal for projects visualizing business strategies, data
Free with trial Diagonal arrows pointing to center grunge doodle design element set. Focus inward to shared centre. Handdrawn pointers. Dynamic sketchy rough direction cliparts. Distressed black ink line symbols. Convergence infographic illustrations Diagonal arrows pointing to center grunge doodle design element set
Free with trial Diagonal arrows pointing to center bold thick stroke graphic element set. Focus inward to shared centralization. Expressive grunge marker highlight pointers. Ink rough direction. Vector illustration. Convergence infographic vectors Diagonal arrows pointing to center bold thick stroke graphic element set
Free with trial Diagonal arrows pointing to center hand-drawn sketch graphic element set. Focus inward to shared centralization. Doodle direction. Minimal black pointers. Ink freehand symbols. Scribble illustration. Convergence infographic vectors Diagonal arrows pointing to center hand-drawn sketch graphic element set
Free with trial Two opposing curves converge into a single arrow pointing forward with a tapered stroke. Convergence infographic vectors Arrow with two directions coming together, pointing in one direction and thickness tapering. Two opposing curves converge into a single arrow pointing forward with a tapered stroke.
Free with trial This Hand-Drawn Crossing Arrows Symbol Features Two Arrows Intersecting in a Bold, Sketchy Style, Created with Black Marker Strokes and Organic Freehand Lines. The Doodle-Inspired Design with Natural Imperfections Makes It Ideal for Indicating Interaction, Choice, Divergence, Convergence, or Directional Flow. Fully Isolated on a Transparent Background, This Graphic Element Is Perfect for Infographics, Presentations, Web Design, Social Media Graphics, Educational Materials, Branding, and Print Projects, Adding a Creative, Casual, and Handcrafted Touch to Any Layout. Convergence infographic vectors Hand-Drawn Crossing Arrows Symbol Isolated on a Transparent Background. This Hand-Drawn Crossing Arrows Symbol Features Two Arrows Intersecting in a Bold, Sketchy Style, Created with Black Marker Strokes and Organic Freehand Lines. The Doodle-Inspired Design with Natural Imperfections Makes It Ideal for Indicating Interaction, Choice, Divergence, Convergence, or Directional Flow. Fully Isolated on a Transparent Background, This Graphic Element Is Perfect for Infographics, Presentations, Web Design, Social Media Graphics, Educational Materials, Branding, and Print Projects, Adding a Creative, Casual, and Handcrafted Touch to Any Layout.
Free with trial A minimalist black and white illustration featuring two sets of arrows. The top arrows point upwards, diverging from a central point, while the bottom arrows point downwards, converging towards a central point. The design is clean and modern, suitable for representing various concepts such as growth, decline, convergence, divergence, or opposing forces. Convergence infographic vectors Converging and Diverging Arrows Icon. A minimalist black and white illustration featuring two sets of arrows. The top arrows point upwards, diverging from a central point, while the bottom arrows point downwards, converging towards a central point. The design is clean and modern, suitable for representing various concepts such as growth, decline, convergence, divergence, or opposing forces.
Free with trial This futuristic image depicts the intricate world of Artificial Intelligence and robotics. Two sleek robotic arms frame a vibrant digital network, pulsating with data and connectivity. Various hexagonal icons symbolize key AI concepts: a central AI chip, a brain for machine learning, gears for automation, and charts for data analysis. Binary code and circuit patterns enhance the high-tech atmosphere, illustrating the convergence of advanced technology, innovation, and digital transformation. Ideal for showcasing the future of smart systems and intelligent automation. Convergence infographic illustrations AI and Robotics Future: Global Technology Network. This futuristic image depicts the intricate world of Artificial Intelligence and robotics. Two sleek robotic arms frame a vibrant digital network, pulsating with data and connectivity. Various hexagonal icons symbolize key AI concepts: a central AI chip, a brain for machine learning, gears for automation, and charts for data analysis. Binary code and circuit patterns enhance the high-tech atmosphere, illustrating the convergence of advanced technology, innovation, and digital transformation. Ideal for showcasing the future of smart systems and intelligent automation.
Free with trial Abstract background featuring a network of interconnected nodes and lines. The image is divided into two color schemes: blue on the left and orange on the right, converging at a central bright point. This design evokes concepts of connectivity, technology, data transfer, and communication. Suitable for use in presentations, websites, and marketing materials related to technology, science, and innovation. Convergence infographic illustrations Abstract Network Connection Background. Abstract background featuring a network of interconnected nodes and lines. The image is divided into two color schemes: blue on the left and orange on the right, converging at a central bright point. This design evokes concepts of connectivity, technology, data transfer, and communication. Suitable for use in presentations, websites, and marketing materials related to technology, science, and innovation.
Free with trial A modern, abstract vector background featuring overlapping teal and blue geometric polygons with clean lines and subtle gradients. The composition suggests depth and movement through angular facets, ideal for tech, business, or creative projects. Suitable for covers, posters, website headers, presentations, and marketing visuals, this design conveys professionalism, innovation, and contemporary style while remaining versatile for various color schemes. Convergence infographic vectors Geometric Teal Abstract Background with Prismatic Facets. A modern, abstract vector background featuring overlapping teal and blue geometric polygons with clean lines and subtle gradients. The composition suggests depth and movement through angular facets, ideal for tech, business, or creative projects. Suitable for covers, posters, website headers, presentations, and marketing visuals, this design conveys professionalism, innovation, and contemporary style while remaining versatile for various color schemes.
Free with trial Glowing neon wireframe van moving through orange grid tunnel, with CO2 plug leaf icons. Vehicle, cargo, 3d, visualization, emissions, glow, hexagon. Convergence infographic illustrations Glowing neon wireframe van moving through orange grid tunnel, with CO2 plug leaf icons