Free with trial Large three dimensional green arrow facing downwards, symbol for decrease decline lower prices or falling trends in economy and business sectors. Cost price decrease illustrations Green arrow pointing down isolated on white for negative indicators. Large three dimensional green arrow facing downwards, symbol for decrease decline lower prices or falling trends in economy and business sectors
Free with trial Three bold red downward-pointing arrows, each featuring a prominent percentage symbol. This imagery effectively communicates concepts of decline, discounts, or cost reduction in a clear and impactful visual format. Cost price decrease illustrations Red downward arrows with percentage symbols representing financial decreases and savings opportunities isolated on white. Three bold red downward-pointing arrows, each featuring a prominent percentage symbol. This imagery effectively communicates concepts of decline, discounts, or cost reduction in a clear and impactful visual format
Free with trial A red arrow pointing down with a white percentage symbol, signifying a decrease or sale, isolated on a transparent background. Cost price decrease vectors Red downward pointing arrow with a white percentage symbol indicating a sale or discount isolated on transparent background. A red arrow pointing down with a white percentage symbol, signifying a decrease or sale, isolated on a transparent background
Free with trial A black industrial oil drum featuring a red downward arrow icon representing falling fuel market prices. Cost price decrease illustrations Black oil barrel with a red down arrow showing a decrease in fuel prices. A black industrial oil drum featuring a red downward arrow icon representing falling. A black industrial oil drum featuring a red downward arrow icon representing falling fuel market prices
Free with trial A visual representation of declining oil prices featuring stacks of black oil barrels and a prominent red arrow indicating a downward trend in the market. Cost price decrease illustrations Oil price drop decreasing crude oil barrels with red downward arrow graphic. A visual representation of declining oil prices featuring stacks of black oil barrels and a prominent red arrow indicating a downward trend in the market
Free with trial A black downward arrow merges with a percentage symbol on a white background. Clear details and vibrant colors. Cost price decrease illustrations Black downward arrow with percentage symbol on white background decrease. A black downward arrow merges with a percentage symbol on a white background. Clear details and vibrant colors
Free with trial Line and solid icons of scissors cutting banknote for financial budget reduction concepts. Cost price decrease vectors Scissors cutting dollar bill icon set for cost reduction and budget saving. Line and solid icons of scissors cutting banknote for financial budget reduction concepts
Free with trial Three bright green arrows with percentage symbols pointing downwards, symbolizing a reduction or discount, isolated on a transparent background. Cost price decrease vectors Three green downward pointing arrows with percentage symbols indicating a decrease in rates or prices isolated on transparent. Three bright green arrows with percentage symbols pointing downwards, symbolizing a reduction or discount, isolated on a transparent background
Free with trial The image shows a three-dimensional green arrow pointing downward with a percentage symbol inside it. The arrow represents a decline or reduction, often associated with discounts, lowered prices, or decreases in rates and percentages. Cost price decrease illustrations Green downward arrow symbolizing a decrease in percentage or discount rates. The image shows a three-dimensional green arrow pointing downward with a percentage symbol inside it. The arrow represents a decline or reduction, often associated with discounts, lowered prices, or decreases in rates and percentages
Free with trial Black oil barrels are arranged with a large red downward-trending arrow pointing downwards, symbolizing a decrease in oil prices. The barrels are positioned on a white circular platform, highlighting the concept of falling market values. The red arrow standing out against the black barrels signifies financial decline or economic trends related to oil markets. Cost price decrease vectors Black oil barrels with a red downward trending arrow indicating falling prices. Black oil barrels are arranged with a large red downward-trending arrow pointing downwards, symbolizing a decrease in oil prices. The barrels are positioned on a white circular platform, highlighting the concept of falling market values. The red arrow standing out against the black barrels signifies financial decline or economic trends related to oil markets.
Free with trial The inscription rates arrow in the down direction. Cost price decrease illustrations Price reduction. The inscription rates arrow in the down direction
Free with trial A black bar graph with dollar signs above each bar and a downward pointing arrow, representing financial decline or cost reduction on a white. Cost price decrease illustrations Bar graph with dollar signs and downward arrow on white background money finance. A black bar graph with dollar signs above each bar and a downward pointing arrow, representing financial decline or cost reduction on a white
Free with trial Money bag and stack pile coins line icon. Cost reduction illustration. Vector illustration. Cost price decrease vectors Money bag and stack pile coins line icon
Free with trial The image features three identical red arrows pointing downward, each displaying a percentage symbol. This visual metaphor commonly represents a decline or reduction in percentages, often used in contexts like financial decreases, discount promotions, or rate reductions. Cost price decrease illustrations Three red downward arrows symbolizing a decrease in percentage rates or discounts. The image features three identical red arrows pointing downward, each displaying a percentage symbol. This visual metaphor commonly represents a decline or reduction in percentages, often used in contexts like financial decreases, discount promotions, or rate reductions
Free with trial Modern reduction line icon. Premium pictogram isolated on a white background. Vector illustration. Stroke high quality symbol. Decrease icon in modern line style. Cost price decrease vectors Modern reduction line icon.
Free with trial Demand spelled out with wooden blocks arranged in a descending staircase pattern against a light blue background represents economic principles of supply and demand market trends and financial analys. Cost price decrease illustrations Demand supply economics business market finance investment strategy planning growth decrease increase concept analysis forecast tr. Demand spelled out with wooden blocks arranged in a descending staircase pattern against a light blue background represents economic principles of supply and demand market trends and financial analys
Free with trial A 3D rendered bar chart illustrates a downward trend. Two tall green bars are followed by two shorter pink bars, representing a decrease in value. A bright yellow arrow sharply descends from right to left, crossing over the bars and emphasizing the decline. The composition is set against a solid light blue background. Cost price decrease illustrations 3D Bar Chart with Falling Yellow Arrow Indicating Decline on Blue Background graph. A 3D rendered bar chart illustrates a downward trend. Two tall green bars are followed by two shorter pink bars, representing a decrease in value. A bright yellow arrow sharply descends from right to left, crossing over the bars and emphasizing the decline. The composition is set against a solid light blue background
Free with trial Three green arrows pointing downwards, each featuring a white percentage sign. This imagery signifies financial decline, price reduction, or decreasing interest rates, often associated with sales or economic trends. Cost price decrease illustrations Green downward arrows with percentage signs symbolizing falling prices or interest rates. Three green arrows pointing downwards, each featuring a white percentage sign. This imagery signifies financial decline, price reduction, or decreasing interest rates, often associated with sales or economic trends
Free with trial Set of outline and solid dollar coin icons with arrow pointing down for economy. Cost price decrease vectors Dollar coins with downward arrow icon representing financial loss and price reduction set. Set of outline and solid dollar coin icons with arrow pointing down for economy
Free with trial Stock exchange board, market index graphs and charts, vector screen background. Stock exchange board display with financial data numbers, stock trade rates of bank investments growth and decrease. Cost price decrease vectors Stock exchange board, market index graphs, charts. Stock exchange board, market index graphs and charts, vector screen background. Stock exchange board display with financial data numbers, stock trade rates of bank investments growth and decrease
Free with trial Three prominent green downward-pointing arrows each bearing a percentage symbol represent a decrease in financial values or rates. This visual depicts economic decline or reduction effectively. Cost price decrease illustrations Green percentage down arrows symbolizing declining rates finance business growth reduction. Three prominent green downward-pointing arrows each bearing a percentage symbol represent a decrease in financial values or rates. This visual depicts economic decline or reduction effectively
Free with trial A visual representation of deflation, showing a decrease in the general pricing and economic activity , high resolution. Cost price decrease illustrations Economic Downturn. Deflation concept. A visual representation of deflation, showing a decrease in the general pricing and economic activity , high resolution
Free with trial Three green arrows with white percent symbols pointing downward, representing concept of interest rate decrease or sale discount. Cost price decrease illustrations Three green percentage arrows pointing down isolated on white background indicating reduction. Three green arrows with white percent symbols pointing downward, representing concept of interest rate decrease or sale discount
Free with trial A visual representation of falling prices or discounts. Six bright red arrows, each featuring a white percentage sign, point downwards, signifying economic changes or promotional offers. Cost price decrease illustrations Six red downward pointing arrows with percentage symbols indicating sales or price reductions. A visual representation of falling prices or discounts. Six bright red arrows, each featuring a white percentage sign, point downwards, signifying economic changes or promotional offers
Free with trial Falling barrels with petroleum isolated on white background. Oil price change concept. Cost price decrease illustrations Falling barrels with petroleum isolated on white background
Free with trial This image illustrates the volatile nature of the oil market, showcasing oil barrels and storage tanks alongside a map of the Middle East, signifying global energy dynamics and price fluctuations. Cost price decrease illustrations The global oil market is depicted with barrels and tanks symbolizing the oil industry fluctuating price chart. This image illustrates the volatile nature of the oil market, showcasing oil barrels and storage tanks alongside a map of the Middle East, signifying global energy dynamics and price fluctuations.
Free with trial Modern reduction line icon. Premium pictogram isolated on a white background. Vector illustration. Stroke high quality symbol. Decrease icon in modern line style. Cost price decrease vectors Modern reduction line icon.
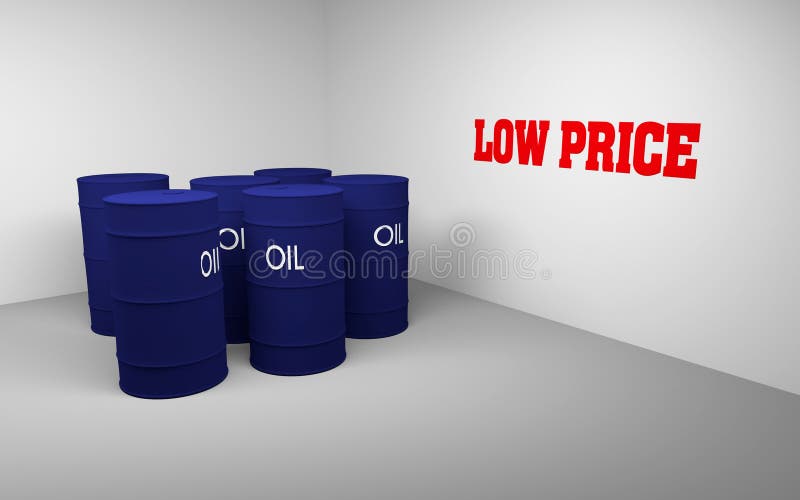
Free with trial Several 3D blue drums/barrels and write text low price on the wall, 3d rendering. Cost price decrease illustrations Oil barrels. Several 3D blue drums/barrels and write text low price on the wall, 3d rendering
Free with trial Increasing the quality and optimizing the costs of products or services to improve efficiency. Effective business, effective risk. Cost price decrease illustrations Cost and quality control, business strategy and project management concept. Increasing the quality and optimizing the costs of products or services to improve efficiency. Effective business, effective risk
Free with trial Increasing the quality and optimizing the costs of products or services to improve efficiency. Effective business, effective risk. Cost price decrease illustrations Cost and quality control, business strategy and project management concept. Increasing the quality and optimizing the costs of products or services to improve efficiency. Effective business, effective risk
Free with trial Image featuring an oil barrel paired with a bold red downward arrow, symbolizing a sharp decline in petroleum prices and an ongoing energy market crisis. The visual concept represents falling fuel demand, economic slowdown, reduced revenue, and global market instability. Ideal for financial reports, energy sector analysis, business presentations, and economic downturn illustrations. Cost price decrease illustrations Oil barrel with red downward arrow representing energy market crisis and price drop concept, AI generated. image featuring an oil barrel paired with a bold red downward arrow, symbolizing a sharp decline in petroleum prices and an ongoing energy market crisis. The visual concept represents falling fuel demand, economic slowdown, reduced revenue, and global market instability. Ideal for financial reports, energy sector analysis, business presentations, and economic downturn illustrations.
Free with trial Image featuring an oil barrel paired with a bold red downward arrow, symbolizing a sharp decline in petroleum prices and an ongoing energy market crisis. The visual concept represents falling fuel demand, economic slowdown, reduced revenue, and global market instability. Ideal for financial reports, energy sector analysis, business presentations, and economic downturn illustrations. Cost price decrease illustrations Oil barrel with red downward arrow representing energy market crisis and price drop concept, AI generated. image featuring an oil barrel paired with a bold red downward arrow, symbolizing a sharp decline in petroleum prices and an ongoing energy market crisis. The visual concept represents falling fuel demand, economic slowdown, reduced revenue, and global market instability. Ideal for financial reports, energy sector analysis, business presentations, and economic downturn illustrations.
Free with trial Image featuring an oil barrel paired with a bold red downward arrow, symbolizing a sharp decline in petroleum prices and an ongoing energy market crisis. The visual concept represents falling fuel demand, economic slowdown, reduced revenue, and global market instability. Ideal for financial reports, energy sector analysis, business presentations, and economic downturn illustrations. Cost price decrease illustrations Oil barrel with red downward arrow representing energy market crisis and price drop concept, AI generated. image featuring an oil barrel paired with a bold red downward arrow, symbolizing a sharp decline in petroleum prices and an ongoing energy market crisis. The visual concept represents falling fuel demand, economic slowdown, reduced revenue, and global market instability. Ideal for financial reports, energy sector analysis, business presentations, and economic downturn illustrations.
Free with trial Image featuring an oil barrel paired with a bold red downward arrow, symbolizing a sharp decline in petroleum prices and an ongoing energy market crisis. The visual concept represents falling fuel demand, economic slowdown, reduced revenue, and global market instability. Ideal for financial reports, energy sector analysis, business presentations, and economic downturn illustrations. Cost price decrease illustrations Oil barrel with red downward arrow representing energy market crisis and price drop concept, AI generated. image featuring an oil barrel paired with a bold red downward arrow, symbolizing a sharp decline in petroleum prices and an ongoing energy market crisis. The visual concept represents falling fuel demand, economic slowdown, reduced revenue, and global market instability. Ideal for financial reports, energy sector analysis, business presentations, and economic downturn illustrations.
Free with trial Image featuring an oil barrel paired with a bold red downward arrow, symbolizing a sharp decline in petroleum prices and an ongoing energy market crisis. The visual concept represents falling fuel demand, economic slowdown, reduced revenue, and global market instability. Ideal for financial reports, energy sector analysis, business presentations, and economic downturn illustrations. Cost price decrease illustrations Oil barrel with red downward arrow representing energy market crisis and price drop concept, AI generated. image featuring an oil barrel paired with a bold red downward arrow, symbolizing a sharp decline in petroleum prices and an ongoing energy market crisis. The visual concept represents falling fuel demand, economic slowdown, reduced revenue, and global market instability. Ideal for financial reports, energy sector analysis, business presentations, and economic downturn illustrations.
Free with trial Image featuring an oil barrel paired with a bold red downward arrow, symbolizing a sharp decline in petroleum prices and an ongoing energy market crisis. The visual concept represents falling fuel demand, economic slowdown, reduced revenue, and global market instability. Ideal for financial reports, energy sector analysis, business presentations, and economic downturn illustrations. Cost price decrease illustrations Oil barrel with red downward arrow representing energy market crisis and price drop concept, AI generated. image featuring an oil barrel paired with a bold red downward arrow, symbolizing a sharp decline in petroleum prices and an ongoing energy market crisis. The visual concept represents falling fuel demand, economic slowdown, reduced revenue, and global market instability. Ideal for financial reports, energy sector analysis, business presentations, and economic downturn illustrations.
Free with trial Image featuring an oil barrel paired with a bold red downward arrow, symbolizing a sharp decline in petroleum prices and an ongoing energy market crisis. The visual concept represents falling fuel demand, economic slowdown, reduced revenue, and global market instability. Ideal for financial reports, energy sector analysis, business presentations, and economic downturn illustrations. Cost price decrease illustrations Oil barrel with red downward arrow representing energy market crisis and price drop concept, AI generated. image featuring an oil barrel paired with a bold red downward arrow, symbolizing a sharp decline in petroleum prices and an ongoing energy market crisis. The visual concept represents falling fuel demand, economic slowdown, reduced revenue, and global market instability. Ideal for financial reports, energy sector analysis, business presentations, and economic downturn illustrations.
Free with trial Image featuring an oil barrel paired with a bold red downward arrow, symbolizing a sharp decline in petroleum prices and an ongoing energy market crisis. The visual concept represents falling fuel demand, economic slowdown, reduced revenue, and global market instability. Ideal for financial reports, energy sector analysis, business presentations, and economic downturn illustrations. Cost price decrease illustrations Oil barrel with red downward arrow representing energy market crisis and price drop concept, AI generated. image featuring an oil barrel paired with a bold red downward arrow, symbolizing a sharp decline in petroleum prices and an ongoing energy market crisis. The visual concept represents falling fuel demand, economic slowdown, reduced revenue, and global market instability. Ideal for financial reports, energy sector analysis, business presentations, and economic downturn illustrations.
Free with trial Image featuring an oil barrel paired with a bold red downward arrow, symbolizing a sharp decline in petroleum prices and an ongoing energy market crisis. The visual concept represents falling fuel demand, economic slowdown, reduced revenue, and global market instability. Ideal for financial reports, energy sector analysis, business presentations, and economic downturn illustrations. Cost price decrease illustrations Oil barrel with red downward arrow representing energy market crisis and price drop concept, AI generated. image featuring an oil barrel paired with a bold red downward arrow, symbolizing a sharp decline in petroleum prices and an ongoing energy market crisis. The visual concept represents falling fuel demand, economic slowdown, reduced revenue, and global market instability. Ideal for financial reports, energy sector analysis, business presentations, and economic downturn illustrations.
Free with trial Image featuring an oil barrel paired with a bold red downward arrow, symbolizing a sharp decline in petroleum prices and an ongoing energy market crisis. The visual concept represents falling fuel demand, economic slowdown, reduced revenue, and global market instability. Ideal for financial reports, energy sector analysis, business presentations, and economic downturn illustrations. Cost price decrease illustrations Oil barrel with red downward arrow representing energy market crisis and price drop concept, AI generated. image featuring an oil barrel paired with a bold red downward arrow, symbolizing a sharp decline in petroleum prices and an ongoing energy market crisis. The visual concept represents falling fuel demand, economic slowdown, reduced revenue, and global market instability. Ideal for financial reports, energy sector analysis, business presentations, and economic downturn illustrations.
Free with trial Percent sign, people stand near a percent. Specials, sales, price cuts, rate reduction. Vector illustration. Cost price decrease vectors Percent sign, people stand near a percent
Free with trial Pound sterling coin with red arrow pointing down, symbol of financial crisis, currency decrease, recession, and economic trouble. Cost price decrease vectors Falling pound sterling coin with downward arrow indicating financial loss and currency depreciation illustration. Pound sterling coin with red arrow pointing down, symbol of financial crisis, currency decrease, recession, and economic trouble
Free with trial Up and down line icon Percentage arrow, Design concept for banking credit interest rate finance. Cost price decrease vectors Up, percentage, decline, pictogram, interest, decrease, increase, interest rate, gdp, growth, business growth, profit, arrow up. up and down line icon Percentage arrow, Design concept for banking credit interest rate finance
Free with trial Lower GDP blue gradient concept icon. Negative unemployment outcome. Financial loss. Decrease in economy. Social issue idea thin line illustration. Vector isolated outline RGB color drawing. Cost price decrease vectors Lower GDP blue gradient concept icon
Free with trial Financial and stock investment market concept. Fluctuation of value which price is rising up and falling down along the way. Cost price decrease vectors Financial and stock investment market concept.
Free with trial Financial and stock investment market concept. Fluctuation of value which price is rising up and falling down along the way. Cost price decrease vectors Financial and stock investment market concept.
Free with trial Modern reduction line icon. Premium pictogram isolated on a white background. Vector illustration. Stroke high quality symbol. Decrease icon in modern line style. Cost price decrease vectors Modern reduction line icon.
Free with trial Shopping basket price down means low prices and discounts. Cost price decrease illustrations Lower prices on purchases. Shopping basket price down means low prices and discounts
Free with trial Coin with dollar sign, downward arrow. Symbol of financial loss, cost reduction, decrease in value. Business concept. Cost price decrease vectors Orange coin with dollar sign and blue downward arrow representing financial loss or decreasing value concept business finance. Coin with dollar sign, downward arrow. Symbol of financial loss, cost reduction, decrease in value. Business concept
Free with trial Coin with dollar sign, downward arrow. Symbol of financial loss, cost reduction, decrease in value. Business concept. Cost price decrease vectors Blue coin with dollar sign and orange downward arrow representing financial loss or decreasing value concept business finance. Coin with dollar sign, downward arrow. Symbol of financial loss, cost reduction, decrease in value. Business concept
Free with trial Oil industry crisis concept. Enlarged oil drop with crude oil 6 month price chart and an arrow pointing downwards on background. Vector Illustration. Square format. Cost price decrease vectors Oil crisis concept. Oil industry crisis concept. Enlarged oil drop with crude oil 6 month price chart and an arrow pointing downwards on background. Vector Illustration. Square format
Free with trial Residential property value scale with percentage changes. illustrates market price dynamics and assessment, emphasizing real estate investment trends ,Generative ai. Cost price decrease illustrations Real estate market dynamics, house on a scale illustrating percentagebased value changes and investment trends in the housing. Residential property value scale with percentage changes. illustrates market price dynamics and assessment, emphasizing real estate investment trends ,Generative ai
Free with trial Graph reducing the cost of a barrel of oil. Stock illustration. Cost price decrease vectors Barrel of oil
Free with trial Three dimensional bright green arrows pointing downwards with white percentage symbols symbolizing a reduction or sale isolated on a transparent background. Cost price decrease vectors Three bright green downward pointing arrows with percentage symbols indicating a decrease or discount isolated on transparent. Three dimensional bright green arrows pointing downwards with white percentage symbols symbolizing a reduction or sale isolated on a transparent background
Free with trial World financial crisis, Oil price drop, Collapse of the economy, Bad economy reduction, Financial crisis, Market fall, Bankruptcy, Budget recession, Investment expenses. Cost price decrease vectors World financial crisis
Free with trial Three red arrows with percentage signs pointing down, symbolizing a financial decline or reduction, isolated on a transparent background. Cost price decrease vectors Three bright red downward pointing arrows with white percentage symbols signifying a decrease in value or interest rates isolated. Three red arrows with percentage signs pointing down, symbolizing a financial decline or reduction, isolated on a transparent background
Free with trial Financial crisis icons. Concept of decrease economy, bankruptcy, poverty. Vector doodle signs with broken piggy bank, cut money, down graph, destroyed bank and safe with lock. Cost price decrease vectors Financial crisis, bankruptcy, poverty icons. Financial crisis icons. Concept of decrease economy, bankruptcy, poverty. Vector doodle signs with broken piggy bank, cut money, down graph, destroyed bank and safe with lock
Free with trial Decrease icon or logo isolated sign symbol vector illustration - Collection of high quality black style vector icons, seles chart icon isolated sign symbol vector illustration - Collection of high quality. Cost price decrease vectors Decrease icon or logo isolated sign symbol vector illustration
Free with trial Modern graph line icon. Premium pictogram isolated on a white background. Vector illustration. Stroke high quality symbol. Decrease icon in modern line style. Cost price decrease vectors Modern graph line icon.
Free with trial Modern reduction line icon. Premium pictogram isolated on a white background. Vector illustration. Stroke high quality symbol. Decrease icon in modern line style. Cost price decrease vectors Modern reduction line icon.
Free with trial Oil barrels on the price chart, falling price of oil concept. Cost price decrease illustrations Barrel lower. Oil barrels on the price chart, falling price of oil concept.
Free with trial Bankruptcy online service or platform. Financiall crisis with falling down profit graph and money decrease. Online financing. Flat vector illustration. Cost price decrease illustrations Bankruptcy online service or platform. Financiall crisis with falling
Free with trial Growing bar chart from black oil barrels isolated over white background. Cost price decrease illustrations Barrel hi price. Growing bar chart from black oil barrels isolated over white background
Free with trial Down bar chart from black oil barrels isolated over white background. Cost price decrease illustrations Barrel low price. Down bar chart from black oil barrels isolated over white background
Free with trial Percentage arrow down, percentage decrease-interest rate drop, Business failed and financial crisis concept. Cost price decrease vectors Business failed and financial crisis concept
Free with trial Loan reduction abstract concept with a man sitting on a falling arrow of a graph symbolizing a decrease in the interest rate on a loan. Flat cartoon vector illustration. Cost price decrease vectors Loan reduction abstract concept. Loan reduction abstract concept with a man sitting on a falling arrow of a graph symbolizing a decrease in the interest rate on a loan. Flat cartoon vector illustration
Free with trial Cute Cost reduction icon. Dollar Down. cartoon style. colorful icon. isolated on white background. Cost price decrease vectors Cute Cost reduction icon.vector illustration. Cute Cost reduction icon. Dollar Down. cartoon style.colorful icon.isolated on white background
Free with trial Stock graph crisis cartoon flat vector illustration. Stock financial trade market diagram landing page template. Financial arrow decrease graph. Cost price decrease vectors Stock graph crisis cartoon vector landing page template. Stock financial trade market diagram. Stock graph crisis cartoon flat vector illustration. Stock financial trade market diagram landing page template. Financial arrow decrease graph.
Free with trial Bankruptcy web banner or landing page set. Financiall crisis with falling down profit graph and money decrease. Idea of financial and business decline and loses. Flat vector illustration. Cost price decrease vectors Bankruptcy web banner or landing page set. Financiall crisis
Free with trial Illustration of an entrepreneur who is burdened by excessive business costs flat design vector illustration, financial problems in business, the company operational costs are increasing, cost overruns. Cost price decrease illustrations Illustration of an entrepreneur who is burdened by excessive business costs flat design vector illustration, financial problems in
Free with trial Modern reduction line icon. Premium pictogram isolated on a white background. Vector illustration. Stroke high quality symbol. Decrease icon in modern line style. Cost price decrease vectors Modern reduction line icon.
Free with trial Modern reduction line icon. Premium pictogram isolated on a white background. Vector illustration. Stroke high quality symbol. Decrease icon in modern line style. Cost price decrease vectors Modern reduction line icon.
Free with trial Lower GDP red gradient concept icon. Negative unemployment outcome. Financial loss. Decrease in economy. Social issue idea thin line illustration. Vector isolated outline RGB color drawing. Cost price decrease vectors Lower GDP red gradient concept icon
Free with trial Bankruptcy web banner or landing page set. Financiall crisis with falling down profit graph and money decrease. Idea of financial and business risk and loses. Flat vector illustration. Cost price decrease vectors Bankruptcy web banner or landing page set. Financiall crisis with falling down
Free with trial Reduction chart icon Vector symbol or sign set collection in black and white outline. Cost price decrease vectors Decline Chart Icon Illustrating Decrease in Performance, Economic Downturn, and Analytical Data. Reduction chart icon Vector symbol or sign set collection in black and white outline
Free with trial Infographic graph showing lowering of price in simple colors on white backdrop. Business concept. Cost price decrease vectors Infographic graph showing lowering of price in simple colors on white backdrop
Free with trial Dollar currency price falling down, de dollarization crisis or bankruptcy problem, fluctuation and uncertainty concept, businessman falling down in big golden coin tied to leg with chains. Cost price decrease vectors Fluctuation and uncertainty or de dollarization crisis concept. Dollar currency price falling down, de dollarization crisis or bankruptcy problem, fluctuation and uncertainty concept, businessman falling down in big golden coin tied to leg with chains
Free with trial Modern reduction line icon. Premium pictogram isolated on a white background. Vector illustration. Stroke high quality symbol. Decrease icon in modern line style. Cost price decrease vectors Modern reduction line icon. Vector. Modern reduction line icon. Premium pictogram isolated on a white background. Vector illustration. Stroke high quality symbol. Decrease icon in modern line style
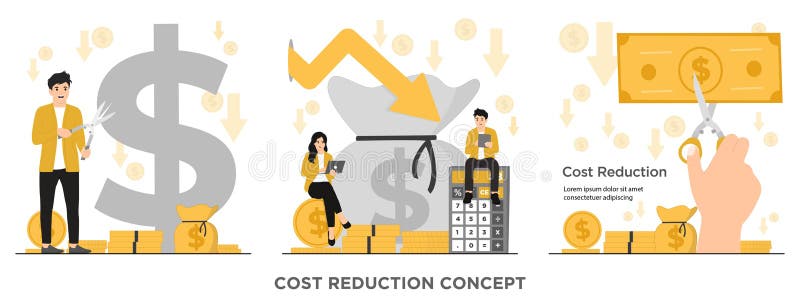
Free with trial Discover the power of cost reduction and optimization with our flat vector illustration. Cut costs and boost your business's efficiency today!. Cost price decrease vectors Flat vector costs reduction costs cut costs optimization business concept illustration. Discover the power of cost reduction and optimization with our flat vector illustration. Cut costs and boost your business's efficiency today!